Содержание

Просмотр системного журнала
Если в работе Windows 2012 появляется какая-то нестабильность, или появляются ошибки запуска\установки приложений, то это может быть связано с появлениями ошибок в самой операционной системе.
Все системные ошибки и предупреждения можно найти в «Журнале системы«.
В нем сохраняется информация о событиях, записываемых системными компонентами Windows.
Для просмотра и сохранения системного журнала нужно выполнить шаги:
Открыть «Пуск«:
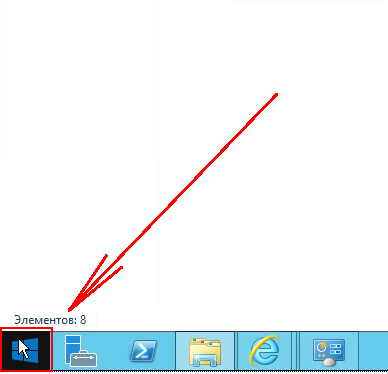
Открыть «Панель управления«:

В «Панели управления» выбрать «Просмотр журналов событий«

В открывшемся окне выбрать «Просмотр событий» -> «Журналы Windows» -> «Система«

Экспорт журнала
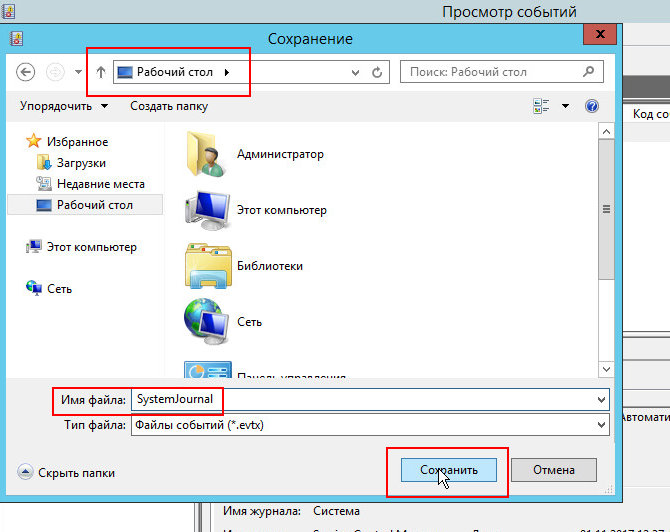
Системный журнал в полном объеме можно выгрузить путем нажатия на ссылку «Сохранить все события как…«

После нажатия ссылки «Сохранить все события как…» нужно выбрать путь и имя файла для сохраняемого журнала.
При сохранении файла возможно появление окна «Отображение сведений«.
В данном окне нужно выбрать пункт «Отображать сведения для следуюших языков: Русский«

Готово
Время на прочтение
3 мин
Количество просмотров 40K
Не так давно, для успешного прохождения аудита на соответствие стандартам PCI DSS, потребовалось включить аудит событий Windows серверов и что самое главное — настроить отправку уведомлений о критичных событиях на E-mail. Для Linux серверов вопрос решается установкой и настройкой OSSEC (ну еще могут понадобиться syslog ws loganalyzer и auditd), для Windows Server 2012 R2 да еще и русской версии он не подошел (в последствии нам таки удалось его адекватно настроить, если будет интересно — смогу описать как). Так что решили искать другие способы…
Первым дело следует включить аудит всех необходимых операций (управление учетными записями и контроль целостности файлов) в доменной политике. И если с аудитом операций над объектами Active Directory все просто, то вот с аудитом файловых операций придется повозиться. Тут, как нельзя кстати, компания Netwrix (не сочтите за рекламу, — компания автор коммерческого софта для аудита) подготовила замечательную статью: «Настройка аудита файловых серверов: подробная инструкция и шпаргалка» (.pdf).
Но вернемся к нашим «костылям». После успешной активации аудита всех необходимых операций и обнаружения в журналах Windows интересующих нас событий, встал вопрос об их отправке на сервер мониторинга… Логично было бы воспользоваться встроенными инструментами («Attach Task To This Event» не самый информативный инструмент, зато «родной» для Windows), но тут всплывает первый любопытный и не приятный момент от Microsoft — «Send an email and Display a message are deprecated for from Windows Server 2012 and Windows 8».
Send an e-mail (deprecated)

…
Согласно рекомендациям от Microsoft, как замену встроенному «deprecated» функционалу решили использовать скрипты PowerShell для фильтрации журналов и отправки по E-mail, благо есть подробные инструкции:
«Аудит Active Directory средствами Powershell с оповещением об изменениях».
«Аудит удаления и доступа к файлам и запись событий в лог-файл средствами Powershell»
Но тут возникла сложность другого характера: приведенные выше скрипты отсылали на E-mail только заголовки (темы) событий, тело письма было пустым  При всем при этом — если скрипт PowerShell запустить в PowerShell ISE «as Administrator», то приходит полное сообщение, как и было задумано!
пример скрипта отправки уведомления о событии ‘Заблокирован аккаунт’ — Event ID 4725:
$time =  (get-date) - (new-timespan -min 60)

$Subject = “Заблокирован аккаунт"
$Theme = “Только что был заблокирован аккаунт”
$Server = “smtp.server.local”
$From = “AD@domain.local”
$To = “support@domain.local”
$encoding = [System.Text.Encoding]::UTF8

#Выбирается последнее произошедшее событие с таким ID.
$TimeSpan = new-TimeSpan -sec 1
foreach($event in $events)
{
    $PrevEvent = $Event.Запись
    $PrevEvent = $PrevEvent - 1
    $TimeEvent = $Event.TimeCreated
    $TimeEventEnd = $TimeEvent+$TimeSpan
    $TimeEventStart = $TimeEvent- (new-timespan -sec 1)

$Body=Get-WinEvent -maxevents 1 -FilterHashtable @{LogName=”Security”;ID=4725;StartTime=$TimeEventStart;} | Select TimeCreated,@{n=”Account Name”;e={([xml]$_.ToXml()).Event.EventData.Data | ? {$_.Name -eq “TargetUserName”} |%{$_.’#text’}}},@{n=”Computer”;e={([xml]$_.ToXml()).Event.EventData.Data | ? {$_.Name -eq “TargetDomainName”}| %{$_.’#text’}}}
$body = $body -replace "@{" -replace "}" -replace "=", ": " -replace ";","`n" -replace "TimeCreated","Время события" -replace "^","`n"
$BodyM = $Body
}
Send-MailMessage -From $From -To $To -SmtpServer $server -Body “$BodyM `n$Theme” -Subject $Subject -Encoding $encoding
В общем, если у вас есть реально рабочие скрипты для такого случая — милости прошу в комментарии.
Мы же перешли к другому способу (вдохновила вот эта статья: «Мониторинг и оповещение о событиях в журналах Windows: триггеры событий» и выручила эта утилита: sendEmail):
- Добавляем в Task Scheduler задание по интересующему нас событию (прямо из журнала «Security» -> «Attach Task To This Event…«

- В Actions указываем запуск скрипта, в котором с помощью утилиты wevtutil делаем выборку из журнала и сохраняем результат в файл.
пример скрипта — выборка событий с Event ID 4726
del c:\Audit\query_ID4726.txt wevtutil qe Security /q:"*[System[(EventID=4726)]]" /f:text /rd:true /c:1 > c:\Audit\query_ID4726.txt - Вторым действием, с помощью утилиты sendEmail отправляем сохраненный файл по назначению:
пример аргументов для команды запуска sendEmail:
-f audit_AD@domain.local -s smtp.domain.local:25 -t support@domain.local -m "AD User Account Management - Event ID 426 - Account was Deleted" -a C:\Audit\query_ID4726.txt


В результате должны получать что-то типа этого:

P.S. Спасибо всем авторам источников, указанных ранее!
The Event Log is a powerful tool in Windows Server 2012 R2 that allows you to track and analyze system events and troubleshoot issues. It records information about various system events such as system startup/shutdown, hardware and software failures, security issues, and more. In this tutorial, we will guide you through the steps to check the Event Log on Windows Server 2012 R2.
Step 1: Open the Event Viewer
– Click on the Start button or press the Windows key.
– In the search bar, type «Event Viewer» and click on the «Event Viewer» app.
Step 2: Navigate to the Event Log
– In the Event Viewer window, you will see a tree-like structure on the left side.
– Expand the «Windows Logs» node to view the various event logs available.
– The commonly used event logs are:
– Application: Contains events logged by installed applications.
– Security: Records security-related events such as login attempts, user account changes, etc.
– System: Logs events related to system components, drivers, and services.
– Setup: Stores events related to Windows setup and installation.
Step 3: Check Event Log Details
– Click on the desired event log, for example, «Application.«
– You will see a list of events in the middle pane, with detailed information such as the date, time, event ID, source, and description.
– You can double-click on an event to view its specific details and additional information.
Step 4: Filter Events (optional)
– If you want to narrow down the events based on specific criteria, you can use the filtering option.
– In the right pane, click on «Filter Current Log» under «Actions.«
– Specify the desired filter criteria such as event sources, event IDs, keywords, etc.
– Click OK to apply the filter and view the filtered events.
Step 5: Clear Event Log (optional)
– If you want to clear the events from a specific event log, you can do so by right-clicking on the log and selecting «Clear Log.«
– A confirmation dialog box will appear, asking if you want to save the log before clearing. Choose the desired option.
Step 6: Export Event Log (optional)
– If you need to save a copy of the event log or share it with others, you can export it to a file.
– Right-click on the desired event log and select «Save All Events As.«
– Choose the file format (e.g., CSV, EVT, XML) and specify the location to save the file.
Pros Cons
1. Efficient troubleshooting tool 1. Overwhelming amount of data
2. Helps identify underlying issues 2. Requires understanding of event codes and descriptions
3. Provides detailed information 3. May not always provide clear solutions
By following these steps, you can easily check the Event Log on Windows Server 2012 R2 and leverage its valuable insights for system analysis and troubleshooting.
Video Tutorial: How do I find event logs in Windows Server?
Where are the event logs stored in Windows 2012?
In Windows 2012, event logs are stored in specific locations on the file system. Here are the default storage locations for event logs:
1. Application and Service Logs: The event logs for various applications and services are stored in the «C:\Windows\System32\winevt\Logs» directory. Each application or service has its folder within this directory, and the corresponding log files are stored there.
2. Windows Logs: The built-in Windows logs, such as Application, Security, System, Setup, and Forwarded Events, are located in the «C:\Windows\System32\winevt\Logs» directory as well. Each log file for these categories is stored in their respective folder within this directory.
To access the event logs in Windows 2012, you can follow these steps:
1. Open the Event Viewer: Press the Windows key + R to open the Run dialog box, then type «eventvwr.msc» and hit Enter. Alternatively, you can search for «Event Viewer» in the Start menu and select the corresponding result.
2. Navigate to the desired log: In the Event Viewer window, you will find a list of event logs on the left-hand side. Expand the «Windows Logs» folder and click on the specific log you want to view, such as «Application» or «Security.«
3. View log entries: Once you have selected a log, the central pane will display the log entries chronologically. You can scroll through the entries to examine the details, including event ID, source, date, and time.
Remember, the above instructions are specific to Windows 2012. Please note that the file paths or steps may vary slightly in different Windows versions, and depending on any system modifications or customizations made.
How do I view event logs?
To view event logs on various devices, you can follow these general steps:
1. Windows PC:
– Press the Windows key + R to open the Run dialog box.
– Type «eventvwr.msc» and hit Enter.
– In the Event Viewer window, you can browse different logs like Application, Security, and System. Expand the desired log to view events.
2. macOS:
– Click on the Spotlight search icon (magnifying glass) in the menu bar.
– Type «Console» and press Enter.
– The Console app will open, displaying logs from different categories on the left. Click on the desired log type to view events.
3. Linux (Ubuntu/Debian-based):
– Open the Terminal by pressing Ctrl + Alt + T.
– Type «sudo less /var/log/syslog» and press Enter.
– You can replace «syslog» with other log filenames like «auth.log» or «kern.log» to view specific event logs.
4. Android:
– Open the Settings app on your Android device.
– Look for the «About phone» or «About device» option and tap on it.
– Find «Build number» and tap on it multiple times until it enables developer options.
– Go back to the main Settings screen and find «Developer options» or «Developer settings.«
– Open «Developer options» and look for «Enable USB debugging» or a similar option.
– Connect your Android device to your computer via USB and use tools like Android Debug Bridge (ADB) to view logs.
5. iOS (iPhone/iPad):
– Connect your iPhone or iPad to a computer with iTunes or Finder installed.
– Open iTunes or Finder and select your device.
– Choose the «Summary» or «General» tab and look for the «View logs» or «Console» option.
– Click on it to view the event logs related to your iOS device.
Remember, the specific steps may vary depending on the operating system version and device, but these general guidelines should help you in viewing event logs across various platforms.
How do I export event logs from Windows Server 2012 r2?
To export event logs from Windows Server 2012 R2, follow these steps:
1. Launch the Event Viewer: Press the Windows key + X on your keyboard, then select «Event Viewer» from the menu that appears.
2. In the Event Viewer window, navigate to the specific event log you want to export. For example, if you want to export the System event log, expand the «Windows Logs» folder and select «System.«
3. Right-click on the event log you’ve selected and choose «Save All Events As.«
4. In the «Save As» dialog box, choose a destination folder where you want to save the exported event log. Provide a filename and select a file format, such as «CSV» (Comma Separated Value) or «EVTX» (Event Log Format). CSV is a widely used format that allows for easy analysis using spreadsheet programs like Microsoft Excel.
5. Click the «Save» button to begin the export process. A progress bar will indicate the status of the export.
6. Once the export is complete, you can find the exported event log file in the destination folder you selected earlier.
By following these steps, you will be able to export event logs from Windows Server 2012 R2. Remember to choose an appropriate file format that suits your needs for analysis or sharing purposes.
How to check user login history in Windows Server 2012 r2 Powershell?
In Windows Server 2012 R2, you can utilize PowerShell to check user login history by performing the following steps:
1. Open PowerShell: Click on the Start button, search for «PowerShell,» and select the PowerShell application.
2. Run PowerShell as an Administrator: Right-click on the PowerShell icon and choose «Run as Administrator» to ensure you have the necessary privileges to access the required information.
3. Enter PowerShell command: Once the PowerShell window opens, enter the following command:
«`powershell
Get-WinEvent -FilterHashtable @{Logname=’Security’; ID=’4624′} | Select-Object -Property TimeCreated, Message | Format-List
«`
This command utilizes the `Get-WinEvent` cmdlet to retrieve security events with Event ID 4624, which represents successful logins. The `Select-Object` cmdlet is used to display only the TimeCreated and Message properties, and `Format-List` formats the output for better readability.
4. View the login history: After entering the command, press Enter to execute it. PowerShell will list the login history with details such as the time of login and related messages.
Please note that this method assumes the default configuration of Windows Server 2012 R2. If any modifications have been made to the event log settings or security policies, the command may need to be adjusted accordingly.
Remember, it’s crucial to run PowerShell as an administrator to obtain the necessary permissions to access user login history.
Where is event log in Windows Server 2012 R2?
In Windows Server 2012 R2, the Event Viewer is the tool to access event logs. Here are the steps to find the Event Viewer:
1. Click on the «Start» button located at the bottom-left corner of the screen.
2. In the search bar, type «Event Viewer» and click on the corresponding result.
3. The Event Viewer window will open, providing you access to various logs categorized by different event types.
4. Expand the «Windows Logs» section, which contains the event logs related to Windows system components.
5. Here, you will find different categories such as Application, Security, Setup, System, and Forwarded Events.
6. Click on any of these categories to see the corresponding event logs.
7. For example, if you’re troubleshooting an application-related issue, go ahead and select the «Application» event log.
8. Within each category, you can see a list of events with details like event type, date, time, source, and event ID.
By utilizing the Event Viewer in Windows Server 2012 R2, you can monitor and analyze various events occurring on your system for troubleshooting, security audits, and system health analysis without relying solely on error messages.
Please note that the specific steps to access the Event Viewer may vary slightly depending on the server’s configuration and any customizations made.
How to check user login history Windows Server 2012?
To check user login history on Windows Server 2012, you can follow these steps:
1. Open the Event Viewer: Press the Windows key + R on your keyboard to open the Run dialog box. Type «eventvwr.msc» and hit Enter. This will launch the Event Viewer.
2. Navigate to the Security Event Log: In the Event Viewer, expand the «Windows Logs» folder on the left-hand side. Then, click on «Security» to open the Security Event Log.
3. Filter the Event Log: In the middle pane of the Event Viewer, click on the «Filter Current Log» option. This will open the Filter Current Log dialog box.
4. Define the Filter Criteria: In the Filter Current Log dialog box, specify the filter criteria to view user login history. Under the «Event sources» section, select «Security» from the drop-down menu. Then, in the «Logged» section, enter the desired time frame or leave it blank to retrieve all login records. Finally, click on the «OK» button.
5. View User Login Events: The Event Viewer will now display the filtered user login events in the middle pane. You can review the events to see user logins, including their usernames, login timestamps, and other relevant details.
Note: The ability to view user login history may require administrative privileges or elevated access on the Windows Server 2012 system.
Checking the event log in Windows Server 2012 is a simple process. To begin, open the Start menu and type “Event Viewer” into the search box. Once Event Viewer opens, you can view logs from different sources such as Windows Logs, Application, Security and System. Each of these categories contains various events that have occurred on your server. You can filter through them by using specific criteria such as date range or source to help find what you are looking for more quickly.
How do I find the event log in Windows Server?
Where is event log in Windows Server 2012 R2?
The Event Log in Windows Server 2012 R2 can be found through the Windows Administrative Tools. To access it, open the Control Panel and select System and Security. Under Administrative Tools, you will find Event Viewer. This will give you access to all of your event logs.
How do I view System logs in Windows Server 2012?
To view System logs in Windows Server 2012, you can use the Event Viewer utility. This tool allows you to view information about system events such as application and service errors, warnings, and informational messages that are logged by Windows components. To open Event Viewer:
1) Open the Start menu and type “Event Viewer” into the search bar.
2) Click on “View event logs” from the list of results.
3) In Event Viewer, expand “Windows Logs” on the left side of the window to see all available log types. The System log contains events related to system services such as driver or hardware issues; for example, an error message when a device fails to start up correctly. You can double-click any item in this list for more details about each event.
How do I check the System event log?
Checking the System event log is a useful way to troubleshoot problems you may be having with your computer. In order to check this log, you will need to open Event Viewer. Here are the steps:
1. Open the Start menu and type “Event Viewer” into the search bar.
2. Select Event Viewer from the list of results that appear in order for it to open up on your screen.
3. On the left side of the window, expand Windows Logs and select System from within it.
4. Once selected, all of your system logs should populate in a chronological order on the right side of your screen where you can then view them as needed and address any issues that may have occurred during their creation time frame if necessary or simply analyze them for informational purposes accordingly!
Where is Event Viewer log server 2012?
Event Viewer log server 2012 can be accessed through the Windows Server Manager. To open it, please follow these steps:
1. Open the Start menu and type «Server Manager» into the search bar. Select «Server Manager» from the list of results.
2. In Server Manager, select Tools at the top of the window and then choose Event Viewer from this list of tools to open it up on your computer’s screen.
3. Once opened, you will have access to various logs stored in Event Viewer such as application logs, system logs, security logs and more that are specific to Windows Server 2012 systems.
4. You can review each log individually or use filters provided by Event Viewer for more precise searches about events recorded in your system’s history bookkeeping records over time on Windows Server 2012 systems and beyond.
How to check System event log in cmd?
You can check the system event log in Windows Command Prompt (CMD) by using the “eventquery.vbs” command. This will allow you to view all of your system events in a text-based format for easy viewing and analysis. To use this command, open CMD and type «cscript eventquery.vbs» followed by any additional parameters you want to specify like the log name or source name. For example, if you wanted to view only entries from the Application log, type “cscript eventquery.vbs /l application». This will output all entries from that particular log into your terminal window which you can then scroll through or copy/paste as needed.
How do I view file audit logs in server 2012?
To view file audit logs in Server 2012, you must enable the Advanced Audit Policy Configuration. This can be done by following these steps:
1. Open the Group Policy Management Console (GPMC) from within Administrative Tools or type «gpedit.msc» into the Start menu search bar and select it from the list of results.
2. Locate your desired GPO in your domain’s tree structure, right-click on it and select Edit from the context menu that appears.
3. Navigate to Computer Configuration > Policies > Windows Settings > Security Settings > Advanced Audit Policy Configuration > System Audit Policies – Local Group Policy Object and double-click on any policy listed there to edit its settings.
4. Select “Define these policy settings” checkbox and click OK twice to confirm changes made above when prompted with confirmation dialogs; this will enable Advanced Auditing for that group policy object (GPO).
5a) To view file access audits, navigate to File System subcategory under System Audit Policies – Local Group Policy Object section as before; make sure that both Successful and Failed options are checked for “Audit File Access” policies under this category; also check other policies related to auditing folder/file permissions modification if necessary depending on what actions need to be monitored via audit log entries generated by system events such as creation/deletion of files etc..
5b) To view folder access audits, navigate to Object Access subcategory instead; similarly make sure that appropriate success/failure combinations are selected for “Audit Handle Manipulation” policies there so they match up with intended activities being monitored via logs generated by server operations processing requests against folders & their contents stored over network resources accessible through Server 2012 instance(s).
Once all relevant auditing settings have been configured properly according desired specifications, restart affected machine(s) running Server 2012 so new configuration parameters become effective & active upon next startup sequence completed successfully without encountering any errors while doing so during process execution phase ongoing at given moment in time throughout entire operation procedure currently taking place accordingly associated with particular task requested previously somewhere else using different set of tools available accordingly employed through respective means specified initially when initiated originally elsewhere located somewhere else entirely apart elsewhere far away removed from current position point location situated remotely across various sites located geographically distributed around globe interconnected together forming single global network infrastructure composed out of vast array interconnected links established between them used commonly commonly referred interchangeably known collectively generally speaking exchanging information frequently routinely daily basis maintained managed controlled operated closely supervised continuously observed carefully monitored regularly inspected often times multiple times per day twenty four seven three hundred sixty five days year resulting end product delivering quality service satisfaction guaranteed
How to check logs in cmd?
Checking logs in Command Prompt (CMD) can be done by using the Windows Event Viewer. To access this tool, open the Start menu and search for ‘Event Viewer.’ Once you have opened Event Viewer, you will then need to navigate to the log file of interest; these are located under ‘Windows Logs,’ which includes Application, Security, Setup and System. When viewing a log file, there are several elements available such as details about an event or application errors. You can also filter events by type or source if needed. To do this click on the Filter Current Log option at the top of Event viewer window.
Журнал событий – это инструмент, доступный в операционной системе Windows Server 2012 R2, который позволяет отслеживать и анализировать различные события, связанные с работой сервера. Это мощный инструмент, который может быть использован администраторами для мониторинга и устранения проблем в системе.
В журнале событий сохраняются записи о различных событиях, таких как ошибки, предупреждения, информационные сообщения и другие. Администраторы могут использовать этот журнал для выявления проблем в системе и принятия мер по их устранению. При этом информация, сохраняемая в журнале, может быть очень полезна для проведения диагностики и анализа действий, связанных с работой сервера.
Одним из важных преимуществ журнала событий Windows Server 2012 R2 является его гибкость и настраиваемость. Администраторы могут настроить журнал таким образом, чтобы он сохранял только определенные типы событий или определенные данные. Это позволяет сократить объем информации, сохраняемой в журнале, и упростить анализ событий.
Кроме того, Windows Server 2012 R2 предоставляет инструменты для улучшения работы журнала событий. Например, администраторы могут настроить фильтры, чтобы отображать только определенные события или исключать некоторые типы событий. Также в Windows Server 2012 R2 добавлены новые возможности для сопоставления событий с конкретными задачами и автоматизации их обработки.
Использование и улучшение работы журнала событий Windows Server 2012 R2 может значительно повысить эффективность администрирования сервера. Знание о происходящих событиях в системе, своевременное реагирование на них и принятие соответствующих мер могут помочь предотвратить серьезные проблемы и обеспечить стабильную и надежную работу сервера.
Содержание
- События Windows Server 2012 R2
- Повышение производительности
- Оптимизация работы сервера
- Обновление системы
События Windows Server 2012 R2
Windows Server 2012 R2 предоставляет журнал событий, который служит важным инструментом для мониторинга и анализа происходящего в операционной системе. Журнал событий записывает информацию о различных процессах, действиях, ошибках и предупреждениях, происходящих на сервере.
События в журнале могут представлять собой полезную информацию, которая помогает системным администраторам в определении проблем и улучшении работы сервера. При правильном использовании и анализе журнала событий, можно обнаружить потенциальные проблемы до того, как они приведут к серьезным последствиям.
Журнал событий в Windows Server 2012 R2 имеет различные категории событий, такие как «Система», «Безопасность», «Приложения» и т.д. Каждая категория содержит свой набор событий, связанных с определенными аспектами работы сервера.
Системные события, например, содержат информацию о происходящих изменениях в системе, ошибках связанных с железом или драйверами, а также другую важную информацию, которая может помочь в решении проблем и принятии необходимых мер.
События безопасности предоставляют информацию о действиях пользователей, доступе к файлам и ресурсам, а также различные важные события, связанные с безопасностью сервера.
Журнал событий также позволяет настраивать уровни важности событий, чтобы фильтровать информацию и сосредоточиться на наиболее значимых событиях. Например, можно настроить журнал на запись только критических ошибок или предупреждений, исключая менее значимые события.
Для работы с журналом событий Windows Server 2012 R2 можно использовать специальные инструменты, такие как «События Windows» и «Снимок состояния системы». Эти инструменты позволяют просматривать события, фильтровать их по различным критериям, выполнять анализ и диагностику проблем.
В целом, журнал событий Windows Server 2012 R2 является мощным инструментом, который помогает системным администраторам отслеживать и анализировать происходящие события на сервере. Использование этого инструмента в сочетании с другими инструментами и методами мониторинга позволяет повысить надежность и эффективность работы сервера.
Повышение производительности
| Способ | Описание |
|---|---|
| Настройка размеров журнала | Установка оптимальных размеров журнала позволяет избежать переполнения и уменьшить нагрузку на систему. Рекомендуется увеличить максимальный размер журнала и указать, что журнал должен переписываться при достижении максимального размера. Это позволит избежать потери важной информации и сохранить старые записи событий для последующего анализа. |
| Отключение ненужных журналов | Если в системе созданы журналы, которые не содержат необходимой вам информации, можно отключить их. Это снизит нагрузку на систему и упростит процесс анализа событий. При этом, если в будущем понадобится информация из этих журналов, их можно будет снова включить. |
| Фильтрация записей | Применение фильтров позволяет отсеивать лишнюю информацию и сосредоточиться на наиболее важных событиях. Windows Server 2012 R2 предоставляет возможность настроить фильтры по типу события, уровню важности, источнику и другим параметрам. Это позволяет получить более четкую картину происходящего и сократить объем записей в журнале. |
| Мониторинг журнала событий | Регулярное мониторинг журнала событий позволяет своевременно обнаруживать и решать проблемы, а также оптимизировать производительность системы. Можно настроить задачи планировщика для автоматического мониторинга и анализа журнала событий, а также использовать специальные инструменты для отслеживания и анализа событий. |
Применение вышеуказанных способов по повышению производительности журнала событий Windows Server 2012 R2 поможет сделать его работу более эффективной и улучшить общую производительность системы.
Оптимизация работы сервера
| Рекомендации | Описание |
|---|---|
| 1 | Отключите неиспользуемые службы и компоненты |
| 2 | Настройте оптимальные параметры энергосбережения |
| 3 | Управляйте памятью и процессорным временем |
| 4 | Настройте дисковую подсистему |
| 5 | Оптимизируйте сетевые настройки |
Отключение неиспользуемых служб и компонентов позволит освободить память и процессорное время сервера, устранить неиспользуемые потоки данных и связанные с ними ресурсы. Рекомендуется регулярно проверять и отключать службы и компоненты, которые не используются на сервере.
Настройка оптимальных параметров энергосбережения позволит снизить энергопотребление и тепловыделение сервера. Рекомендуется использовать энергосберегающие режимы работы, включая управление процессорным временем и памятью.
Управление памятью и процессорным временем позволяет оптимизировать использование ресурсов сервера и предотвращать превышения предельных значений, которые могут привести к снижению производительности и стабильности работы системы.
Настройка дисковой подсистемы включает в себя оптимизацию работы с жесткими дисками, RAID-массивами, кэшем дисков и файловой системой. Рекомендуется использовать современные технологии для повышения производительности и надежности хранения данных.
Оптимизация сетевых настроек включает в себя настройку сетевых адаптеров, протоколов, маршрутизации и брандмауэра. Рекомендуется использовать оптимальные настройки для обеспечения высокой производительности и безопасности сети.
Обновление системы
1. Установка последних обновлений.
- Периодически проверяйте наличие новых обновлений для вашей операционной системы.
- Автоматическая установка обновлений может быть настроена для облегчения процесса.
- Процедура установки обновлений может потребовать перезагрузки сервера.
2. Резервное копирование системы.
- Перед выполнением обновления рекомендуется создать полный резервный образ системы.
- Это позволит восстановить систему в случае возникновения проблем после обновления.
3. Проверка совместимости.
- Перед установкой обновлений убедитесь, что ваша система совместима с новыми версиями программного обеспечения.
- Проверьте совместимость существующих драйверов и приложений со следующей версией операционной системы.
4. Тестирование на пилотной группе.
- Перед обновлением всей системы можно провести тестирование на небольшой группе серверов.
- Это поможет выявить возможные проблемы и неполадки до обновления всех компонентов.
5. Планирование обновлений.
- Установка обновлений лучше выполнять вне рабочих часов, чтобы не прерывать работу существующих сервисов.
- Рассмотрите возможность использования функции планового обновления, которая позволяет задать специфическое время для установки обновлений.
6. Контроль за процессом обновления.
- Во время обновления системы рекомендуется вести контроль и журналирование процесса для отслеживания возможных ошибок или неудачных обновлений.
- Это поможет скорректировать процедуру обновления в будущем и избежать проблем.
Следуя правильной процедуре обновления операционной системы Windows Server 2012 R2, вы можете обеспечить безопасность и надежность вашей инфраструктуры и улучшить ее работу.