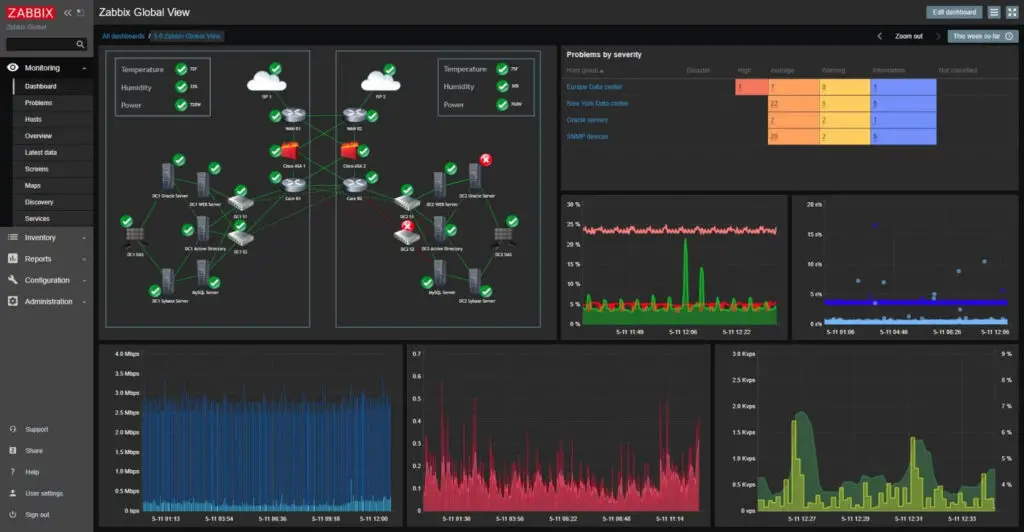
23.05.2018 — Установка и настройка активного Zabbix агента 
Много статей написано о том, как настроить мониторинг тех или иных устройств используя Zabbix сервер и Zabbix агенты. Но все примеры сводятся к тому, что ставится агент на компьютер например с windows добавляется узел сети на сервере как обычный агент (не активный) и все хорошо работает так как у них есть ip связность и они видят друг друга. В некоторых примерах показывают, как они пробрасываю порт, 10050 до устройства которое нужно мониторить и далее также настраивают.
Вот интересно, во всех этих примеров никто не говорит, что делать, когда устройств 100 и пробрасывать порт до них кажется не очень хорошей идеей!?
Но это все примеры, когда Zabbix сервер находится за NAT или вообще в маршрутизируемой сети с ip связностью. А что, если нужно мониторить действительно 100 и более устройств? Тут на помощь приходит работа zаbbix агента в активном режиме. Что значит активный режим? То, что не сервер будет периодически опрашивать агента, а наоборот агент будет подключаться к серверу смотреть какие данные он должен собирать и после сбора сам отправлять на сервер.
На эту тему много что написано, но конкретных примеров нет.
Поэтому в этой статье я опишу метод пошаговой настройки как роутеров, так и Zabbix сервера и агента, который мы применяем в нашей практике абоненсткого обслуживания серверов и сетевого оборудования. Я не в коем случаи не претендую на то, что мой вариант самый правильный:). Больше хочу помочь в понимании тем, кто только начал разбираться что да как.
Итак, у нас есть следующая схема

По понятным соображениям два последних октета белых ip буду затирать.
Сервер SRV03 находится за NAT, на маршрутизаторе MikroTik настроен srcnat masquerade на сеть 192.168.0.0\24
На сервер SRV03 ставим Zabbix agent

Строку Server и Server Active пишем белый ip нашего роутера на котором далее пробросим порт на Zabbix сервер. Закомментированные строки не учитываются.
Идем на MikroTik в сети LAN 2 и делаем правило проброса порт 10051 на наш заббикс сервер

Тесть все подключения, которые приходят на интерфейс ether1-WAN на порт 10051 отправлять на адрес 192.168.45.18 с портом 10051.
Теперь запустим наш Zabbix агент на сервере. Видим, в лог файле написано агент стартанул нормально, но при подключении не нашел активных проверок для хоста SRV03 то есть для себя.

Это то и понятно так как не чего нем еще не создано, сделаем это. Создадим узел сети с именем SRV03 именно с таким же, как и название сервера с другим работать не будет учтите это.

В поле интерфейсы агента пиши белый ip роутера (не серый ip самого сервера) за которым находиться наш SRV03 порт пишем 10051 (он по умолчания для активных проверок) и сохраняем.
После перезапускаем службу и видим в лог файле что надпись о ненайденных проверках для SRV03 отсутствует это значит, что он успешно подключился к серверу Zabbix и нашел там себя.

По идеи в столбце доступность должно загорается зеленым «ZBX» но при работе агента в активном режиме этого не происходит, в обычном да загорается.

Проверить можно ли действительно все работает, можно добавив элементы данных и посмотреть приходят ли различные параметры с SRV03. У меня есть шаблон в нем уже созданы триггеры и элементы данных.
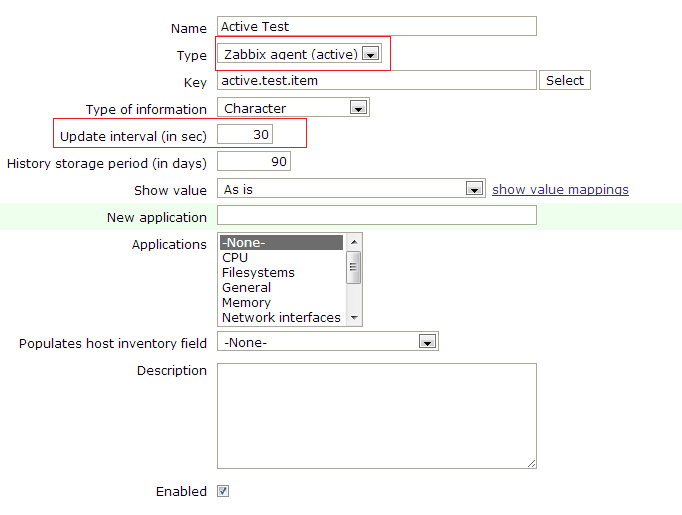
Заметьте, когда создаете ЭД надо выбирать Тип: Zabbix агент (активный).

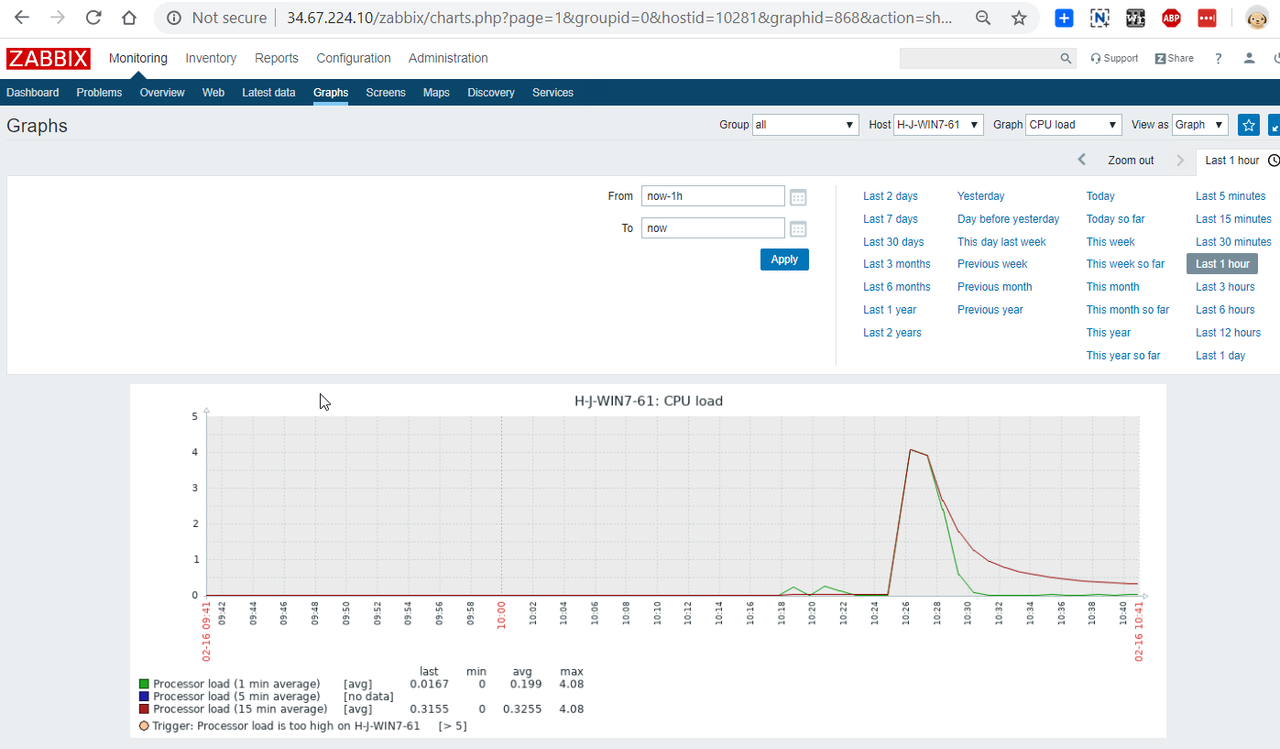
Посмотри приходят ли данные и видим, что все работает.

Подведем итог
1) В конфиге Zabbix агента в Server Aktive пишем белый ip роутера за которым ZServer
2) На этом роутере пробрасывает порт 10051 до ZServera
3) Создаем узел сети с такие же именем, как и ПК один в один.
4) Добавляем элементы данных выбирая тип «: Zabbix агент (активный)».
5) И путь вас не смущает серый значок «ZBX»
Zabbix имеет два типа проверок агента: активные и пассивные. Каждый тип имеет свои преимущества и недостатки, которые мы рассмотрим в этой статье вместе с тем, как их настроить.
Типы проверок
Активные проверки агента Zabbix инициируются сервером Zabbix. Активные проверки полезны при мониторинге большого количества машин или сборе данных через определенные интервалы времени. Они также полезны при мониторинге данных, которые часто меняются, таких как использование процессора или сетевой трафик. Активные проверки могут быть запланированы на определенные интервалы времени, что позволяет администраторам собирать данные через регулярные интервалы времени.
Пассивные проверки инициируются агентом Zabbix на удаленной машине, когда происходит изменение наблюдаемых данных. Это означает, что серверу не нужно постоянно опрашивать удаленные машины, что снижает сетевой трафик и нагрузку на сервер. Пассивные проверки полезны при мониторинге данных, которые изменяются редко, таких как использование диска или памяти. Пассивные проверки также могут быть полезны при мониторинге машин, находящихся за брандмауэрами или NAT, поскольку сервер Zabbix не должен инициировать проверки самостоятельно. Так же при настроенных пассивных проверках можно пользоваться удаленными командами.
Настройка проверок
Чтобы настроить агент Zabbix для активных или пассивных проверок, измените файл конфигурации /etc/zabbix/zabbix_agentd.conf. Установите опцию «Server» на IP-адрес или имя хоста сервера Zabbix для пассивных проверок, а для активных проверок установите опцию «ServerActive». Обратите внимание, что вы можете настроить и активный, и пассивный режимы одновременно.
В веб-интерфейсе Zabbix вы можете настроить тип проверки для элемента. Перейдите в раздел «Configuration» > «Hosts», выберите хост, который вы хотите настроить, и перейдите на вкладку «Item». Откройте элемент и установите тип «Zabbix agent (active)» или «Zabbix agent (passive)», чтобы указать тип проверки для элемента.

Заключение
Чтобы получить максимальную отдачу от агента Zabbix, важно понимать различия между активными и пассивными проверками и настраивать их в соответствии с вашими потребностями, и мы рассмотрели эти два типа опроса и узнали, как их настроить.
Аverage rating : 5
Оценок: 1
191028
Санкт-Петербург
Литейный пр., д. 26, Лит. А
+7 (812) 403-06-99
![]()
700
300
ООО «ИТГЛОБАЛКОМ ЛАБС»
191028
Санкт-Петербург
Литейный пр., д. 26, Лит. А
+7 (812) 403-06-99
![]()
700
300
ООО «ИТГЛОБАЛКОМ ЛАБС»
![]()
700
300
In this tutorial, I will show you how to install Zabbix agent for Windows server using an MSI Installer package and how to monitor Windows server with Zabbix monitoring system.
Using this guide you can monitor almost the entire Windows OS family: Windows server 2012 R2, Windows Server 2016, Windows Server 2019, Windows 10, Windows 8 and Windows 7.
Installation is quite simple, just download and install the Zabbix agent MSI installer following steps 1 and 2, but if you want to learn more, read the full guide.
In short, Zabbix agent is a lightweight application that can collect various performance data from the operating system – such as CPU, memory, disk, and network interface utilization – and forward it to a central point (server) for storage and visualization. It runs on any modern operating system and is very flexible because its functionality can be extended with scripts and modules.
You can read more about the Zabbix agent on the Zabbix official site and if you stumbled on this tutorial by accident and you never heard of the Zabbix monitoring system, then stop whatever you doing and install it on your favorite Linux distribution in less than 10 minutes: CentOS/RHEL, Ubuntu, Debian, Rasberry Pi.
Need help with installing Zabbix agent on Linux OS? Check out this guide:
Zabbix Agent (Linux): Install on Ubuntu, CentOS, RHEL, Debian, etc.
Table of Contents
- Step 1: Download Zabbix Agent Installer for Windows (msi)
- Step 2: Install Zabbix Agent on Windows using MSI installer
- Step 3: Add Windows host to Zabbix monitoring system
- Step 4: Check if Zabbix Agent is working correctly
- Step 5: Restart Zabbix Agent service on Windows
- Step 6: Configure auto registration for Windows Zabbix Agents
- Step 7: Configure PSK encryption on Zabbix Agent (Windows)
- a. Generate PSK key
- b. Configure Zabbix agent to support PSK encryption
- c. Enable PSK encryption on the agent in Zabbix frontend
- Step 8: Install Zabbix agent via Windows command-line (CMD)
- a. Run CMD as administrator
- b. Download Zabbix agent
- c. Change directory and set installation folder
- d. Install Zabbix agent using msiexec
- e. Example of Zabbix agent installation with additional options
- Step 9: Understanding Active vs Passive Zabbix Agent mode
Step 1: Download Zabbix Agent Installer for Windows (msi)
In this tutorial, I will use the latest Zabbix agent 5.0.2 LTS version, that version is compatible with Zabbix server 5.x or newer.
| Windows Zabbix Agent v1 LTS v6.0.x | Download: 64-bit or 32-bit |
| Windows Zabbix Agent v2 LTS v6.0.x (recommended) | Download: 64-bit or 32-bit |
I always recommend using the latest LTS version to take full advantage of new features and improved performance so make sure to download installer zabbix_agent2-6.0.7-windows-amd64-openssl.msi for 64-bit Windows or zabbix_agent2-6.0.7-windows-i386-openssl.msi for 32-bit Windows.
And don’t try to install a 32-bit package on 64-bit Windows because it won’t work!
Step 2: Install Zabbix Agent on Windows using MSI installer
I will install Zabbix Agent on Windows server using installation wizard but if you prefer command-line based installation check out section “Install Zabbix agent via Windows command-line (CMD)”
Just to make clear, in this tutorial I will use Zabbix server with IP address 192.168.5.43 to monitor Windows machine called w01services with IP address 192.168.5.22.
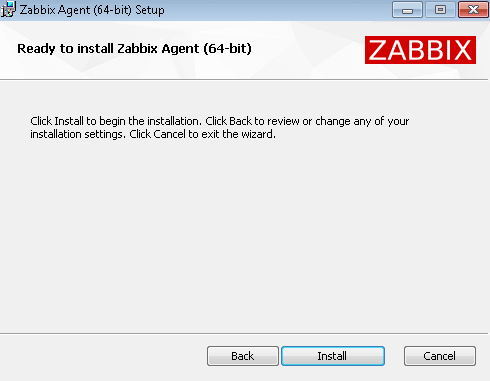
Double click on Zabbix MSI installer that you have downloaded in the previous step and click “Next” just as shown in the image below.
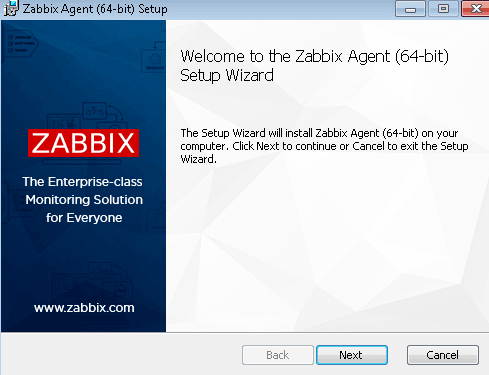
Accept the terms and click the “Next” button.

Define custom “Host name” or use fully qualified domain name (FQDN) of the Windows machine in the “Host name” field. Then enter IP address of the Zabbix server under “Zabbix server IP/DNS” and “Server or Proxy for active checks” field and you are done.
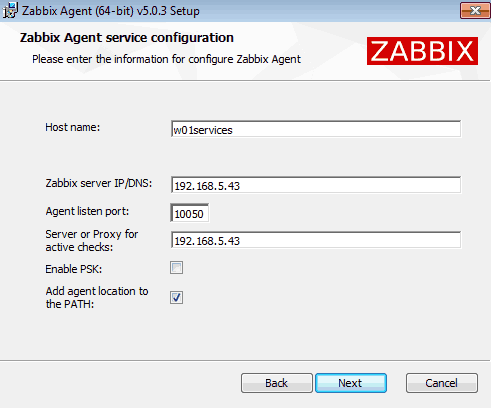
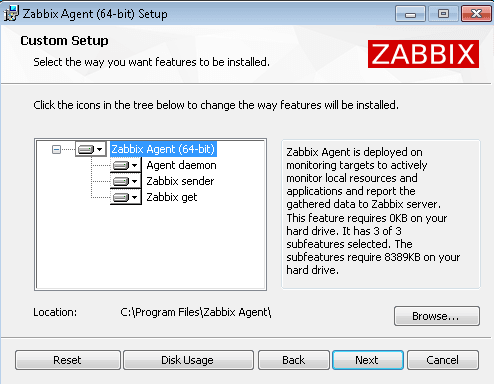
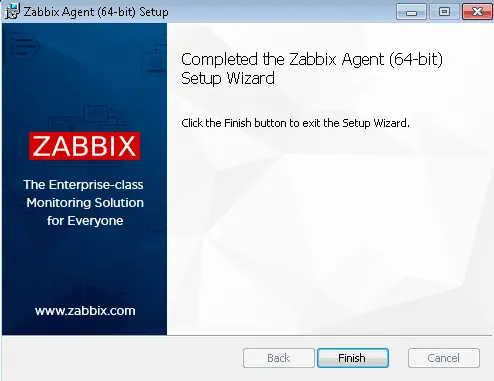
Select “Add agent location to the PATH” and go through the rest of the installation by clicking “Next“, “Install” and “Finish“.
You don’t need to configure Windows firewall manually because the MSI installer will automatically add a firewall rule to permit Zabbix TCP port 10050.
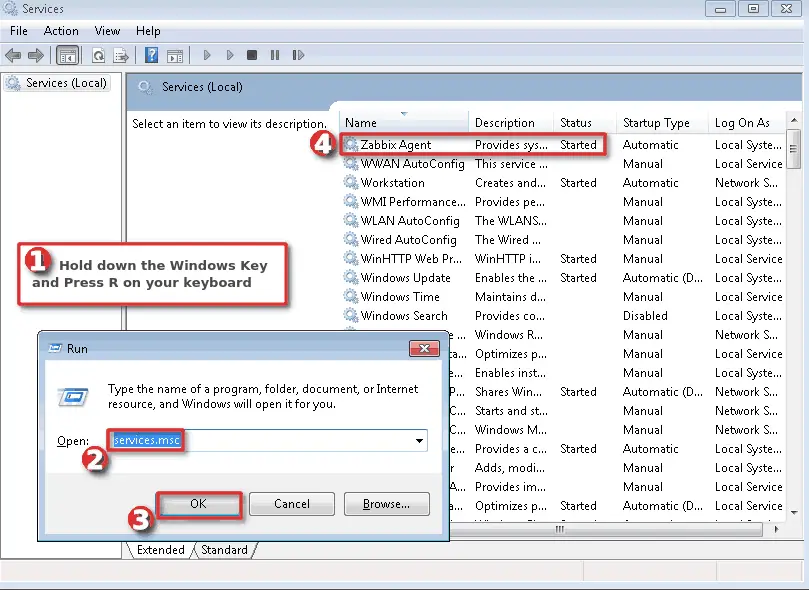
Finally, we need to check that the Zabbix agent is up and running.
Hold down the “Windows key” and press “R” on the keyboard, type “services.msc“, press “OK” and check the “Status” column for “Zabbix Agent” service exactly as shown in the picture below. Status should be “Started” if the installation was successful.
WELL DONE!
You have successfully installed and configured Zabbix agent on Windows OS!
Now it’s time to add that Windows host to Zabbix monitoring system.
Step 3: Add Windows host to Zabbix monitoring system
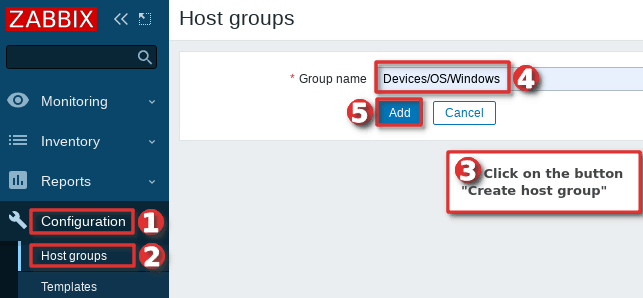
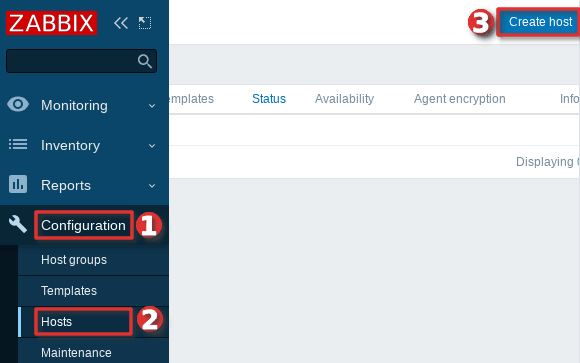
You can add a host to existing host group or you can create a new host group for your Windows servers. I will create host group “Devices/OS/Windows“ using “Host groups” option under “Configuration” section on the Zabbix frontend. Click “Create host group” button, define “Group name” and click “Add” (you only need to create host group once):
Navigate to “Host” menu under “Configuration” tab and then click “Create host” option to create a host in Zabbix:
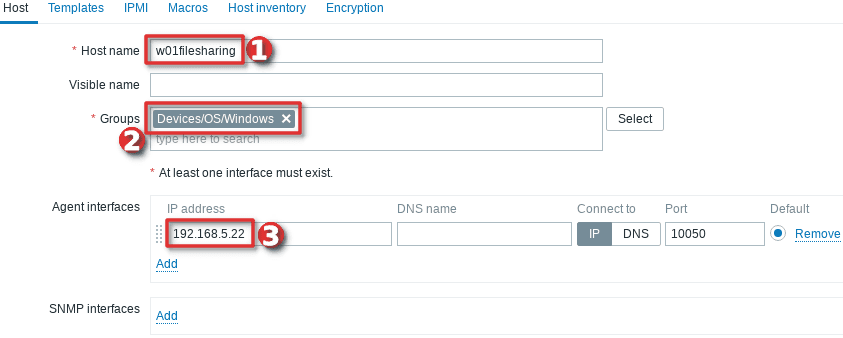
Define “Hostname” and set “Groups” using your newly created host group. Then set the IP address of the Windows server under “Agent interfaces” section
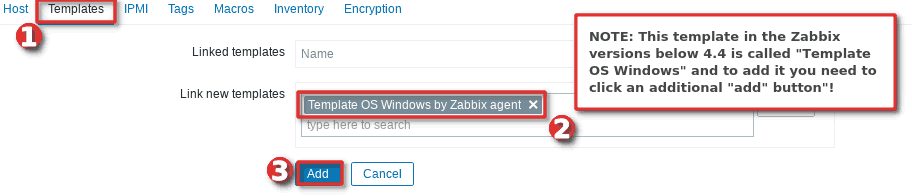
Switch to tab “Templates” and choose the “Template OS Windows by Zabbix agent” template under section “Link new template” by typing “OS Windows …”.
And you’re done! If you are interested in automating this whole process of adding Windows hosts to Zabbix see the section “Configure auto registration for Windows Zabbix agents“
Note that in this tutorial I m using a template “Template OS Windows by Zabbix agent” that can only monitor passive Zabbix agents. However, if you want to monitor your host using Zabbix agents in active mode use a template called “Template OS Windows by Zabbix agent active“. Check out the section “Understanding Active vs Passive Zabbix Agent mode” to learn more about the differences between the active and passive agent mode.
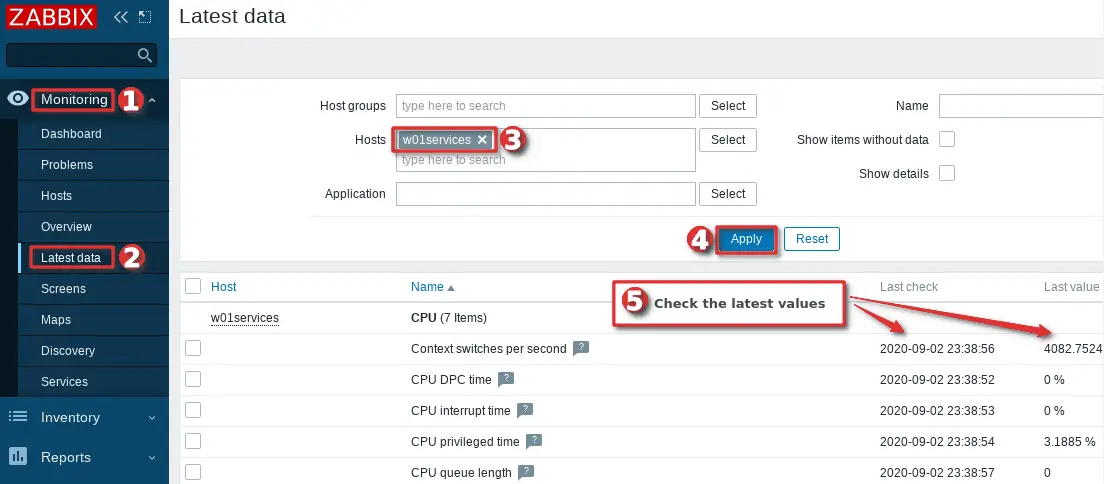
Step 4: Check if Zabbix Agent is working correctly
You can check that the Zabbix agent is working properly by using the “Latest Data” option on the Zabbix frontend. Wait up to 5 minutes after you have installed and started Zabbix agent to allow for data to be collected. Look at columns “Last check” and “Latest value” and if they are updating then the agent is working.
Your agent should be working and collecting data by now, but if you experience any problems, restart Zabbix agent service and check the log “C:\Program Files\zabbix\zabbix_agentd.log“. And if there is nothing unusual in the log file then check the firewall – make sure that TCP port 10050 on the host (where Zabbix agent is installed) and TCP port 10051 on the Zabbix server side are open.
CONGRATULATIONS!
You have successfully installed Zabbix Agent and your Windows server is being monitored!
No need to do anything else as other steps are optional!
CONTINUE TO LEARN MORE:
How to manage Zabbix agent service on Windows
Auto registration of Zabbix agents (Windows OS)
Learn how to Secure Zabbix Agent
Alternative Zabbix agent installation via Windows command-line (CLI)
Understanding Active vs Passive Zabbix Agent mod
Step 5: Restart Zabbix Agent service on Windows
In the previous steps, we learned how to check the status of Zabbix agent service using the “services.msc” option, and now we will learn how to use the command line interface (CMD) to stop or start the agent and check its status.
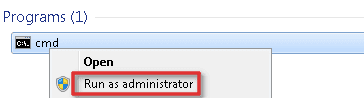
Click on “Windows Start” button and type “cmd” in the search bar, right-click on “cmd” icon and select option “Run as administrator” and use these commands to start/stop the agent:
net stop "Zabbix Agent"
net start "Zabbix Agent"
And to check Zabbix agent service status use the command:
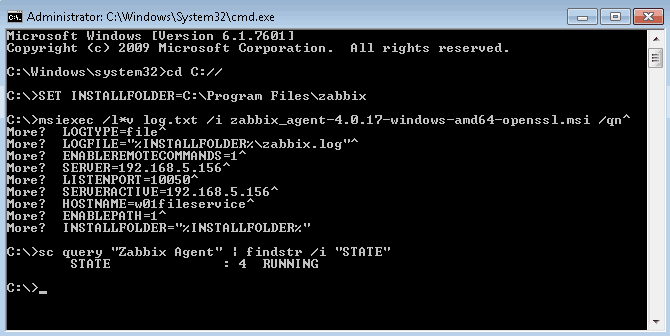
sc query "Zabbix Agent" | findstr /i "STATE"
You should get status “RUNNING” if the Zabbix agent is up and running!
Step 6: Configure auto registration for Windows Zabbix Agents
Adding one or two hosts to Zabbix manually is not a big problem. However, what if you need to add more servers to Zabbix? Or you just want to automate that tedious process of adding Windows hosts to Zabbix and linking them with the correct template and host group?
Don’t worry, you don’t have to write the script because Zabbix has a tool called “Auto registration”.
Before we configure Zabbix frontend, make sure that all of your Zabbix agents have “HostMetadata=Windows” line in their configuration file (default path: “C:\Program Files\zabbix\zabbix_agentd.conf“). And if that line does not exist, add it and restart the Zabbix Agent afterward. You can automate that via CLI like this:
echo HostMetadata=Windows >> C:\"Program Files"\zabbix\zabbix_agentd.conf
net stop "Zabbix Agent"
net start "Zabbix Agent"
In the future always install the Zabbix agent on Windows with the “HostMetadata=Windows” parameter if you are planning to use the auto-registration feature!
Now that we’ve clarified that let’s configure auto-registration on the Zabbix frontend.
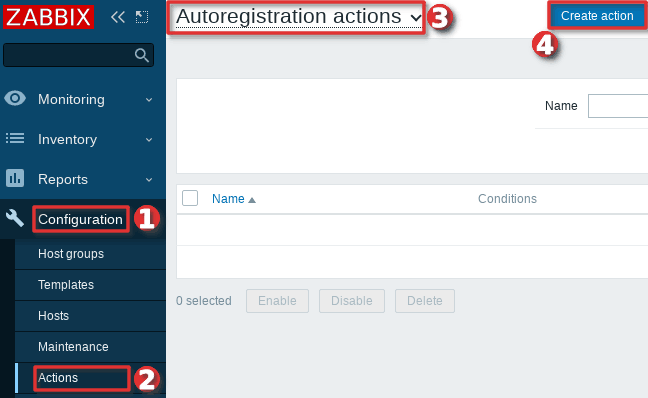
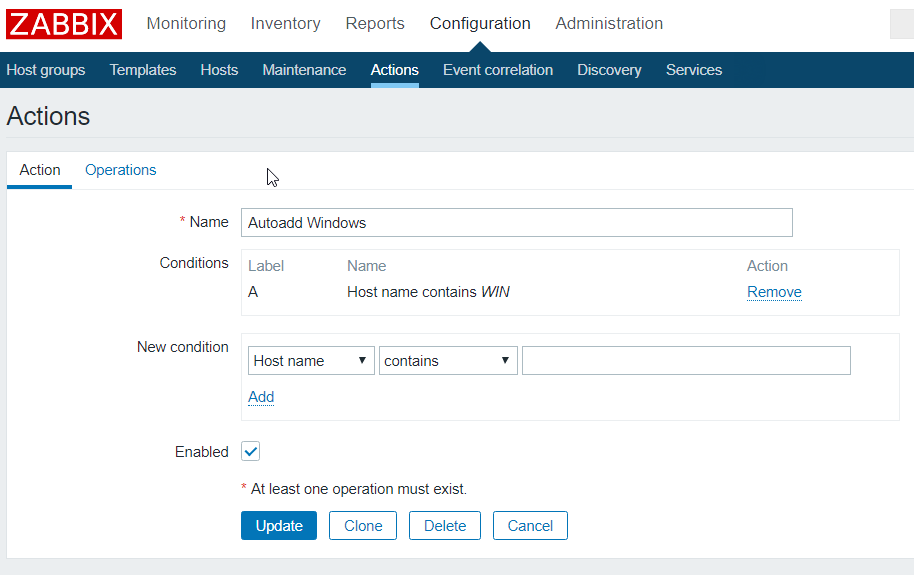
Go to the “Actions” tool under the “Configuration” section, then select “Auto registration” from the dropdown menu and click the “Create action” button.
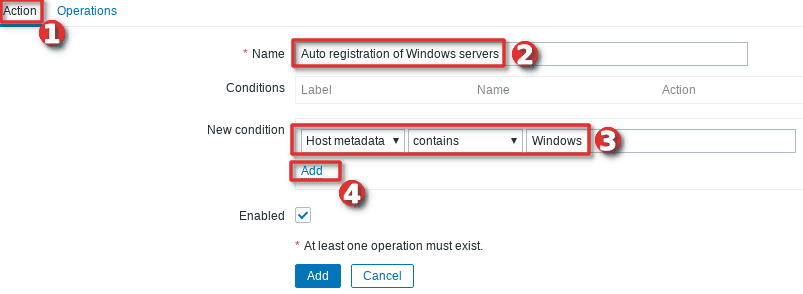
On the “Action” tab define the “Name” of the action and add a “New condition” that will check if the “Host metadata” contains the word “windows”.
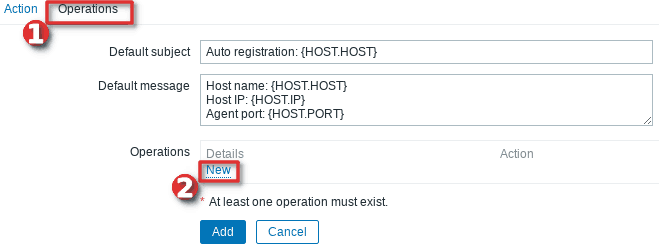
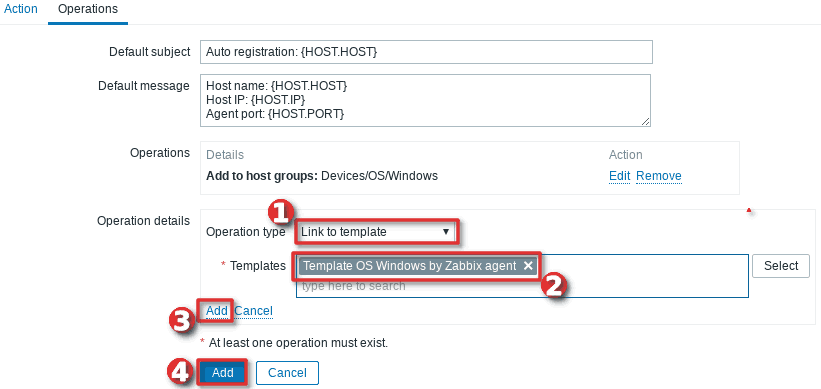
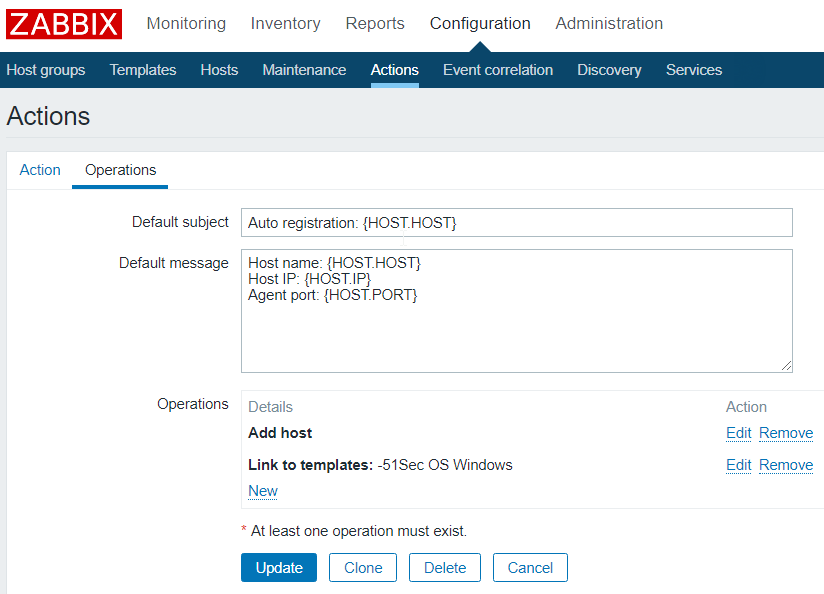
Then, change tab to “Operations” and add new operation.
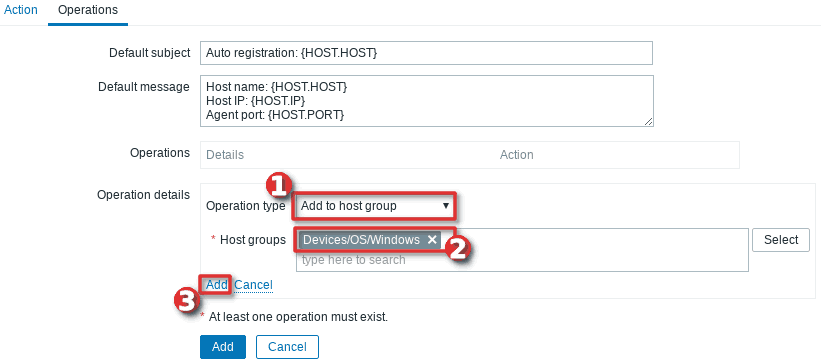
Define “Operation type” as “Add to host group” and then select to which “Host groups” will Windows hosts be added when discovered. In my case, I will use my custom host group called “Devices/OS/Windows“.
After that, you need to add a new operation by setting “Link to the template” as “Operation type” and then select which templates will be linked with the newly discovered Windows hosts. In my example, I will use template “Template OS Windows by Zabbix agent” (passive checks)
Well done! Auto-registration is configured. Wait a few minutes and your Windows server should appear in Zabbix. From now on, every time you install a Zabbix agent on a Windows server, it will automatically be added to the Zabbix and linked with the appropriate host group and template.
Note, that you can add anything you want to the “HostMetadata” parameter. For example, you can have a host that has in Zabbix agent configuration file defined “HostMetadata=Windows:Tomcat:Prod” or another with “HostMetadata=Windows:MSSQL:Test“. For the first host, you can configure auto-registration to add to host groups: “Windows”, “Web servers” and “Production servers” and to link templates that can monitor Windows and Tomcat server. And the second host can be added to host groups: “Windows”, “Databases”, and “Test servers” and linked with templates that can monitor Windows server and Microsoft SQL database.
Using PSK encryption on the Zabbix agents? Then there is one more step left, you need to add your PSK identity and PSK key using the “Auto Registration” option under the “Administration“→”General” section just as shown in the image below:
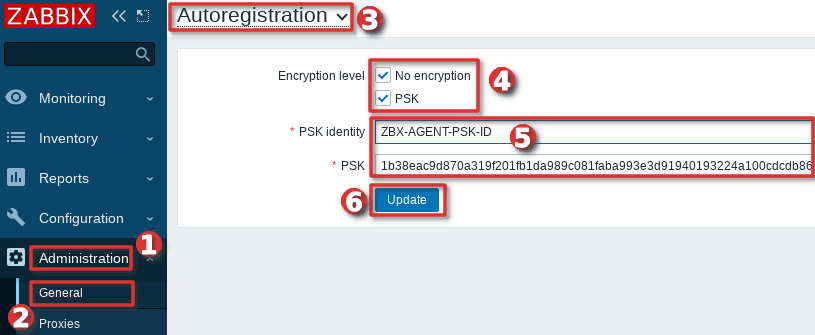
From now on, during the auto registration process, Zabbix will configure provided PSK identity and key on each registered host.
Step 7: Configure PSK encryption on Zabbix Agent (Windows)
Zabbix supports encrypted communications between Zabbix server and Zabbix agent using Transport Layer Security (TLS) protocol v.1.2. You can use certificate-based and pre-shared key-based encryption (PSK), but in this tutorial we will configure PSK encryption.
In this step, I will show you how to configure PSK encryption on an already installed Zabbix agent, but keep in mind that all of these configurations can be configured during the installation
a. Generate PSK key
Generate 256-bit (32 bytes) PSK key with openssl command on Zabbix server (or use some other tool on Windows):
$ openssl rand -hex 32
1b38eac9d870a319f201fb1da989c081faba993e3d91940193224a100cdcdb86
On Windows server, create a new text file “ZabbixAgentPSK.txt” in the default Zabbix agent installation folder (“C:\Program Files\zabbix“) and put that PSK key in the first line of the file. Don’t forget to save the file before closing.
b. Configure Zabbix agent to support PSK encryption
Open “C:\Program Files\zabbix\zabbix_agentd.conf” file with text editor (Notepad++) and add this configuration anywhere in file:
TLSConnect=psk
TLSAccept=psk
TLSPSKFile=C:\Program Files\zabbix\ZabbixAgentPSK.txt
TLSPSKIdentity=ZBX-AGENT-PSK-ID
Save and exit file. Keep in mind that “TLSPSKIdentity” can be anything, so for security reasons set something else – don’t use mine!
Don’t forget to restart Zabbix agent service after changing the configuration file!
c. Enable PSK encryption on the agent in Zabbix frontend
Communication between Zabbix agent and server is not yet encrypted because we have enabled PSK encryption on the agent side but not on the server side.
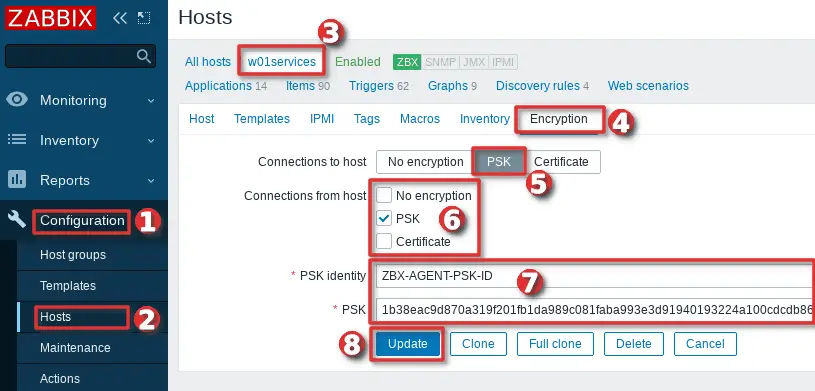
We need to enable encryption on the server side so go to web frontend and select your “Hosts” tab under the “Configuration” section and find and click on your Windows hosts.
On the “Encryption” tab set PSK under “Connections from hosts” option and copy/paste “PSK identity” and “PSK” (key) that is configured on the Zabbix agent.
When you are done with configuration click the “Update” button just as shown in the image below.
Keep in mind, that you can automate the configuration of the host encryption (PSK) on the frontend using the Zabbix auto registration process.
Step 8: Install Zabbix agent via Windows command-line (CMD)
This step is for those who prefer command-line based installation instead of wizard-based installation.
a. Run CMD as administrator
Click on “Windows Start” button and type “CMD” in the search bar, right-click on “cmd” and select option “Run as administrator“:
b. Download Zabbix agent
Download installer zabbix_agent2-6.0.7-windows-amd64-openssl.msi for 64-bit Windows or zabbix_agent2-6.0.7-windows-i386-openssl.msi for 32-bit Windowsand save it on a “C:\” disk or somewhere else.
c. Change directory and set installation folder
Change directory to the path where you have downloaded the MSI file and set the installation folder with commands:
cd C://
SET INSTALLFOLDER=C:\Program Files\zabbix
d. Install Zabbix agent using msiexec
Here is an example of Zabbix agent installation that will work for most people, just change parameteres “SERVER“, “SERVERACTIVE” and “HOSTNAME” to suit your enviroment.
msiexec /l*v log.txt /i zabbix_agent2-6.0.7-windows-amd64-openssl.msi /qn^
LOGTYPE=file^
LOGFILE="%INSTALLFOLDER%\zabbix.log"^
SERVER=192.168.5.156^
LISTENPORT=10050^
SERVERACTIVE=192.168.5.156^
HOSTNAME=w01fileservice^
ENABLEPATH=1^
INSTALLFOLDER="%INSTALLFOLDER%"
Check “Zabbix agent” service status with the command:
sc query "Zabbix Agent" | findstr /i "STATE"
If the Zabbix agent is up and running then the status should be “RUNNING“.
Note, if you are planning to use the auto-registration feature don’t forget to add “HostMetadata=Windows” parameter to “zabbix_agentd.conf” and restart Zabbix agent afterward because Zabbix CLI installation doesn’t support “HostMetadata” parameter:
echo HostMetadata=Windows >> C:\"Program Files"\zabbix\zabbix_agentd.conf
net stop "Zabbix Agent"
net start "Zabbix Agent"
e. Example of Zabbix agent installation with additional options
You can set almost any Zabbix agent parameter during installation, here is one example of an installation where many parameters are used.
SET INSTALLFOLDER=C:\Program Files\zabbix

msiexec /l*v log.txt /i zabbix_agent2-6.0.7-windows-amd64-openssl.msi /qn^
LOGTYPE=file^
LOGFILE="%INSTALLFOLDER%\zabbix.log"^
SERVER=10.10.10.162^
LISTENPORT=10055^
SERVERACTIVE=10.10.10.162^
HOSTNAME=cmr_server^
TLSCONNECT=psk^
TLSACCEPT=psk^
TLSPSKIDENTITY=CompanyPSKID^
TLSPSKFILE="%INSTALLFOLDER%\company_key.psk"^
TLSCAFILE="c:\temp\file1.txt"^
TLSCRLFILE="c:\temp\fil2.txt"^
TLSSERVERCERTISSUER="Company CA"^
TLSSERVERCERTSUBJECT="Company Cert"^
TLSCERTFILE="c:\temp\file4.txt"^
TLSKEYFILE="c:\temp\file5.txt"^
ENABLEPATH=1^
INSTALLFOLDER="%INSTALLFOLDER%"
SKIP=fw
Parameter “SKIP=fw” means that the firewall exception rule will not be added. Explanations of other parameters can be found in the official Zabbix documentation section Zabbix Agent (Windows).
Step 9: Understanding Active vs Passive Zabbix Agent mode
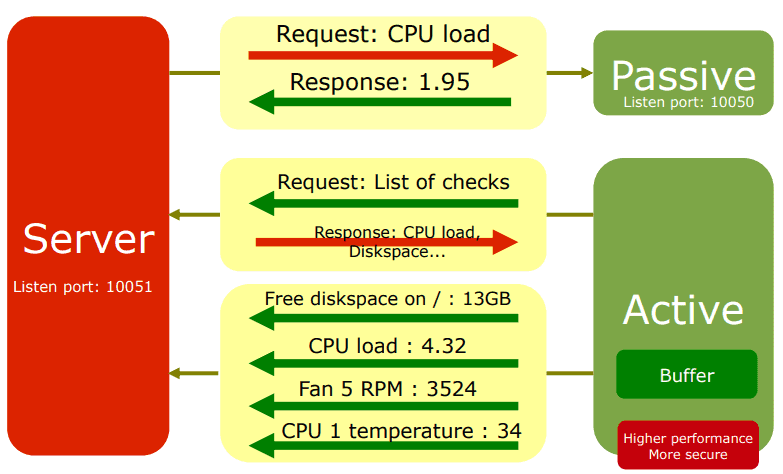
When using a Zabbix agent in active mode, it will connect to the Zabbix server via port 10051 to retrieve configuration and send data. This is a great feature that allows an active Zabbix agent to work behind the firewall and to offload the Zabbix server in large environments.
On the other hand, if you use a Zabbix agent in passive mode Zabbix server will initiate a connection via port 10050 and retrieve data from the agent. The Zabbix server will do this for every metric (item) every few minutes – which is very inefficient! Because of this, active mode is more recommended.
An additional advantage of the Zabbix agent in active mode is that it can read logs from the device and that is not possible if the Zabbix agent is used in passive mode.
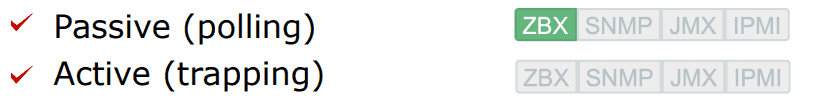
You can detect on Zabbix host if the agent is working in active or passive mode. Passive mode will show red or green “ZBX” icon in the agent status bar and active mode will show grey “ZBX” icon:
Learn how to setup Zabbix email notifications and escalations in a few minutes!

1. Download Zabbix Agent
Make sure you are using same version as your Zabbix server.
https://www.zabbix.com/download_agents
I am using Zabbix 4.0 LTS, so here is my download link for Windows Agent:
https://www.zabbix.com/downloads/4.0.17/zabbix_agent-4.0.17-windows-amd64-openssl.msi
https://www.zabbix.com/downloads/4.0.17/zabbix_agent-4.0.17-windows-i386-openssl.msi
2. Install Zabbix Agent
By default, it will install your agent as passive mode
2.1 Verify ports
For passive mode:
C:\Users\John>netstat -na | find “100”
TCP 0.0.0.0:10050 0.0.0.0:0 LISTENING
TCP [::]:10050 [::]:0 LISTENING
For both passive and active mode:
C:\Users\John>netstat -na | find “100”
TCP 0.0.0.0:10050 0.0.0.0:0 LISTENING
TCP 192.168.2.31:49524 34.67.224.10:10051 TIME_WAIT
TCP [::]:10050 [::]:0 LISTENING
For Avtive mode only:
C:\Users\John>netstat -na | find “100”
TCP 192.168.2.31:49688 34.67.224.10:10051 TIME_WAIT
2.2 Enable Active mode:
Wordpad edit C:\Program Files\Zabbix Agent\zabbix_agentd.conf. Find the section relating to ServerActive:
### Option: ServerActive
# List of comma delimited IP:port (or DNS name:port) pairs of Zabbix servers and Zabbix proxies for active checks.
# If port is not specified, default port is used.
# IPv6 addresses must be enclosed in square brackets if port for that host is specified.
# If port is not specified, square brackets for IPv6 addresses are optional.
# If this parameter is not specified, active checks are disabled.
# Example: ServerActive=127.0.0.1:20051,zabbix.domain,[::1]:30051,::1,[12fc::1]
#
# Mandatory: no
# Default:
# ServerActive=
ServerActive=34.67.224.10
2.3. Disable Passive check:
Change StartAgents value to 0.
### Option: StartAgents
# Number of pre-forked instances of zabbix_agentd that process passive checks.
# If set to 0, disables passive checks and the agent will not listen on any TCP port.
#
# Mandatory: no
# Range: 0-100
# Default:
# StartAgents=3
StartAgents=0
Remove following default passive related Server= settings.
### Option: Server
# List of comma delimited IP addresses, optionally in CIDR notation, or DNS names of Zabbix servers and Zabbix proxies.
# Incoming connections will be accepted only from the hosts listed here.
# If IPv6 support is enabled then ‘127.0.0.1’, ‘::127.0.0.1’, ‘::ffff:127.0.0.1’ are treated equally and ‘::/0’ will allow any IPv4 or IPv6 address.
# ‘0.0.0.0/0’ can be used to allow any IPv4 address.
# Example: Server=127.0.0.1,192.168.1.0/24,::1,2001:db8::/32,zabbix.domain
#
# Mandatory: yes, if StartAgents is not explicitly set to 0
# Default:
# Server=
### Option: ListenPort
# Agent will listen on this port for connections from the server.
#
# Mandatory: no
# Range: 1024-32767
# Default:
# ListenPort=10050
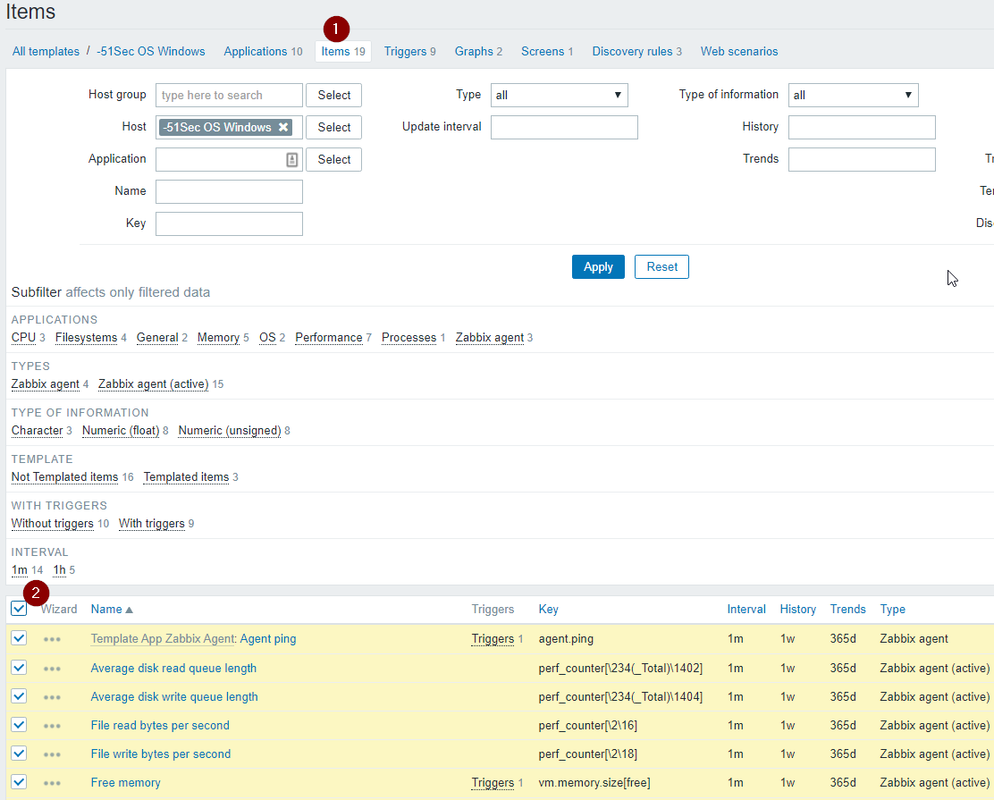
2.4 Make New Templates with ‘Zabbix Agent (active)’
Before I start changing hosts from passive to active checks, I needed to
make three new templates-objects. For each of
‘Template App Zabbix Agent’, ‘Template OS Linux’ and
‘Template App MySQL’, do:
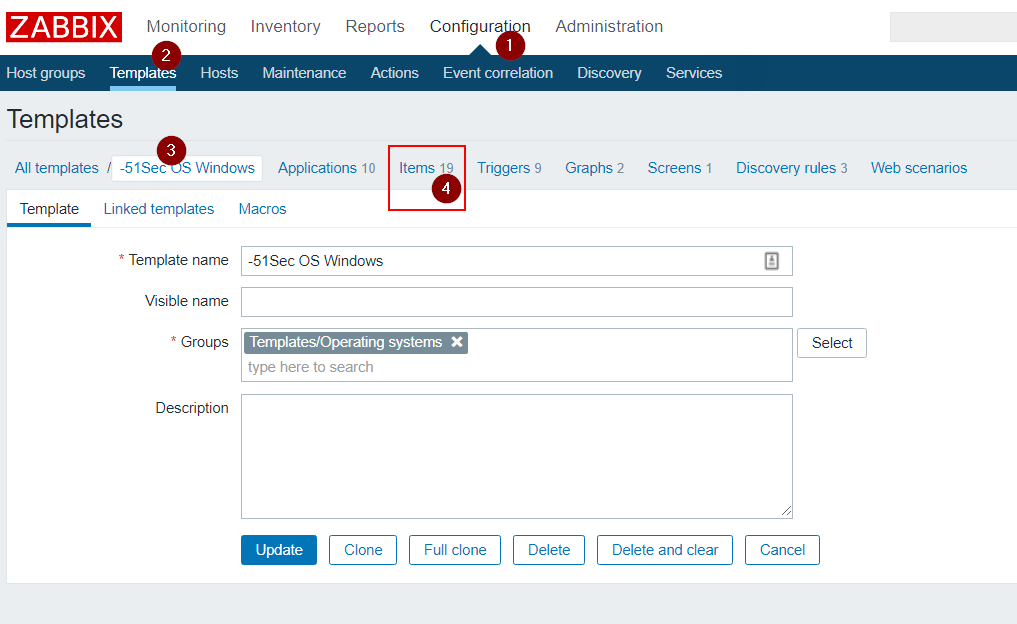
– Go to Configuration : Templates, select template $name
– scroll down, click ‘Full Clone’. Change the clone’s name to “$name
Active” and click ‘Add’ at the bottom.
– In Configuration : Templates, Find the new “$name Active” template,
click on the ‘Items’ item on its row.
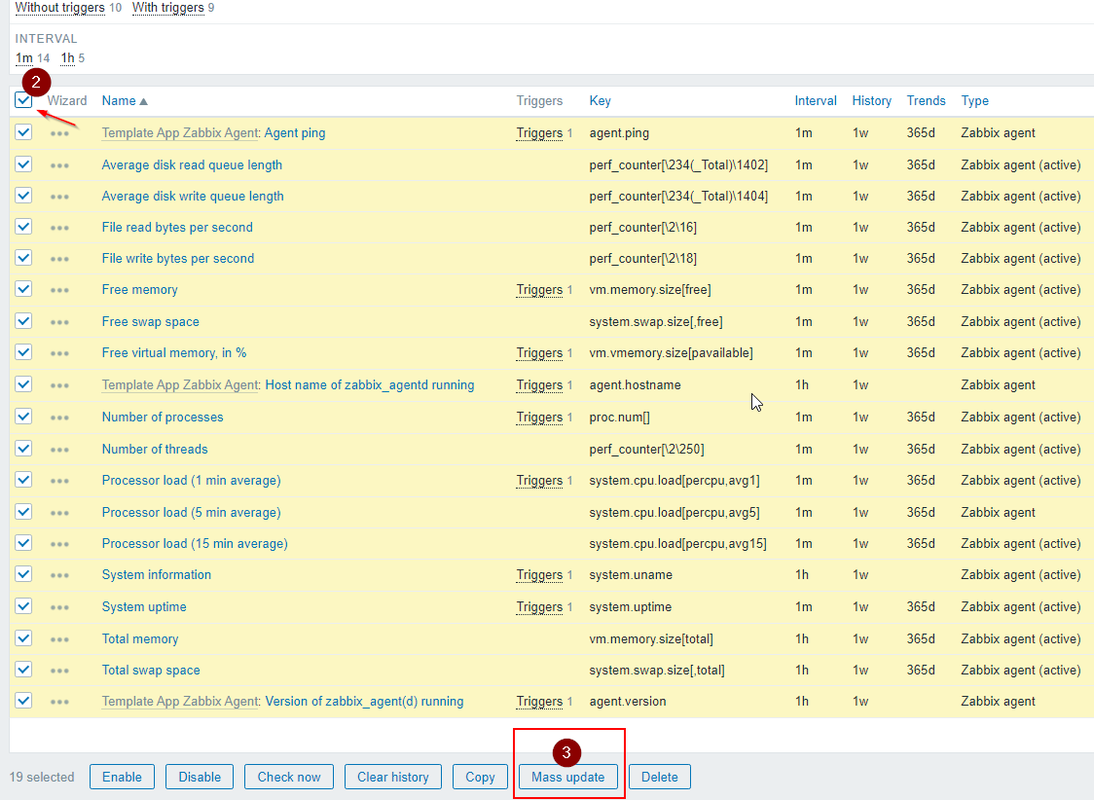
– Click on the checkbox in the upper-left to select all rows, scroll
down to the drop-down and select ‘Mass Update’ and click ‘Go’
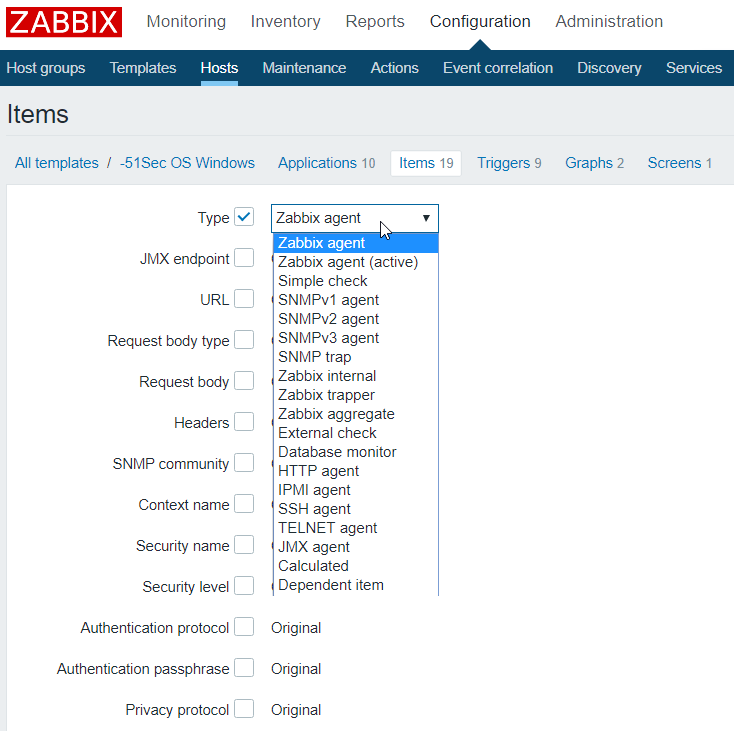
– Click the checkbox for ‘Type’ and select ‘Zabbix Agent (active)’ in
the dropdown that appears. Scroll down and click the ‘Update’ button.
Zabbix-Configuration-Template-Create/Clone a new Windows Template
Zabbix-Configuration-Template-Action-AutoRegistration
Пассивная проверка
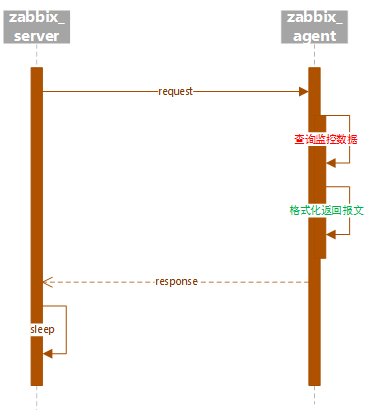
1, проактивные и пассивные относины к ссылке, здесь мы сказали, что инициатива и пассивная относится к «агенту».
2, агент работает в пассивном режиме, то Zabbix Server будет опросить агент, когда сервер Zabbix запланирован для мониторинга ключевого слова Zabbix в качестве параметра запроса. После получения запроса запросить данные мониторинга, соответствующую этому ключевому слову мониторинга, и, наконец, возвращает это на сервер.
3. Тип элемента мониторинга мониторинга пассивного режима, вам необходимо выбрать «Zabbix Agent» в интерфейсе настроек интерфейса.
Пассивные параметры конфигурации
Используя пассивный агент, вам необходимо указать следующие параметры конфигурации в файле конфигурации Zabbix_agentd.conf:
##### Passive checks related
### Option: Server
# List of comma delimited IP addresses, optionally in CIDR notation, or DNS names of Zabbix servers and Zabbix proxies.
# Incoming connections will be accepted only from the hosts listed here.
# If IPv6 support is enabled then '127.0.0.1', '::127.0.0.1', '::ffff:127.0.0.1' are treated equally
# and '::/0' will allow any IPv4 or IPv6 address.
# '0.0.0.0/0' can be used to allow any IPv4 address.
# Example: Server=127.0.0.1,192.168.1.0/24,::1,2001:db8::/32,zabbix.example.com
#
# Mandatory: yes, if StartAgents is not explicitly set to 0
# Default:
# Server=
Server=127.0.0.1
### Option: ListenPort
# Agent will listen on this port for connections from the server.
#
# Mandatory: no
# Range: 1024-32767
# Default:
# ListenPort=10050
### Option: ListenIP
# List of comma delimited IP addresses that the agent should listen on.
# First IP address is sent to Zabbix server if connecting to it to retrieve list of active checks.
#
# Mandatory: no
# Default:
# ListenIP=0.0.0.0
### Option: StartAgents
# Number of pre-forked instances of zabbix_agentd that process passive checks.
# If set to 0, disables passive checks and the agent will not listen on any TCP port.
#
# Mandatory: no
# Range: 0-100
# Default:
# StartAgents=3-
Server: Используется для указания имени хоста или IP-адрес сервера Zabbix. Этот параметр представляет собой список IP-адресов, разделенных запятыми (или именем), а агент Zabbix принимает только соединение, чтобы указать хост в списке. -
ListenPort: Номер порта, используемый для указания слушателя агента Zabbix, значение по умолчанию составляет 10050, диапазон значения составляет 1024-32767. -
ListenIP: Используется для указания IP-адреса прослушивателя агента Zabbix Agent, этот параметр подходит для случая, когда хост монитора имеет несколько сетевых карт или несколько IP-адресов. Этот параметр представляет собой список IP-адресов разделенных запятыми. -
StartAgents: Используется для указания количества экземпляров процессов Zabbix_Agentd заранее для обработки элементов пассивного мониторинга, значение по умолчанию составляет 3. Если этот параметр установлен на 0, пассивный режим агента отключен, а агент не будет прослушивать любой порт TCP.
Zabbix_get Tool.
Инструмент ZABBIX_GET может использоваться для моделирования процесса связи сети между пассивным агентом и сервером Zabbix. Zabbix_get применяется на стороне сервера и запрашивает данные агенту.
Применение:
zabbix_get [-s <host name or IP> ] [-p <port number> ] [-I <IP address> ] [-k <item key> ]Вариант:
-
-s/-host <host name or IP>: Укажите имя хоста или IP-адрес агента Monited Server. -
-p/--port <port number>: Укажите номер порта агента. По умолчанию 10050. -
-I/--source-address <IP address>: Укажите IP-адрес источника. -
-k/--key <item key>: Укажите ключевые слова для элемента мониторинга, чтобы получить соответствующие данные мониторинга.
пример: Выполните следующую команду на сервере Zabbix:
# -S: Укажите IP-адрес сторон агента
./zabbix_get -s 127.0.0.1 -p 10050 -k agent.ping
./zabbix_get -s 127.0.0.1 -p 10050 -k "system.cpu.load[all,avg1]"
./zabbix_get -s 127.0.0.1 -p 10050 -k "system.cpu.load[all,avg5]"
./zabbix_get -s 127.0.0.1 -p 10050 -k "system.cpu.load[all,avg15]"
рабочий процесс
Примечание. Для обработки потока «Данные мониторинга запросов» см. Следующий анализ.
Анализ источника: Listener_Thread
ZBX_THREAD_ENTRY(listener_thread, args)
{
	int		ret;
	zbx_socket_t	s;

	process_type = ((zbx_thread_args_t *)args)->process_type;
	server_num = ((zbx_thread_args_t *)args)->server_num;
	process_num = ((zbx_thread_args_t *)args)->process_num;

	zabbix_log(LOG_LEVEL_INFORMATION, "%s #%d started [%s #%d]", get_program_type_string(program_type),
			server_num, get_process_type_string(process_type), process_num);

	memcpy(&s, (zbx_socket_t *)((zbx_thread_args_t *)args)->args, sizeof(zbx_socket_t));

	zbx_free(args);

	 	// Бесконечная петля
	while (ZBX_IS_RUNNING())
	{
		zbx_setproctitle("listener #%d [waiting for connection]", process_num);
		// zbx_tcp_accept: select(),accept(),recv()
		ret = zbx_tcp_accept(&s, configured_tls_accept_modes);
		zbx_update_env(zbx_time());

		if (SUCCEED == ret)
		{
			zbx_setproctitle("listener #%d [processing request]", process_num);

			if ('\0' != *CONFIG_HOSTS_ALLOWED &&
					SUCCEED == (ret = zbx_tcp_check_allowed_peers(&s, CONFIG_HOSTS_ALLOWED)))
			{
				{
					 Process_Listener (& ы); // Пассивный режим Основная технологическая логика
				}
			}

			 			// Отключить
			zbx_tcp_unaccept(&s);
		}

		if (SUCCEED == ret || EINTR == zbx_socket_last_error())
			continue;

		 // Спать
		if (ZBX_IS_RUNNING())
			zbx_sleep(1);
	}
}


static void	process_listener(zbx_socket_t *s)
{
	AGENT_RESULT	result;
	char		**value = NULL;
	int		ret;

	 // ZBX_TCP_RECV_TO: READ (), прочитайте элемент мониторинга, отправленного концом сервера
	if (SUCCEED == (ret = zbx_tcp_recv_to(s, CONFIG_TIMEOUT)))
	{
		zbx_rtrim(s->buffer, "\r\n");

		 // Пример журнала: запрошенная [system.cpu.load [percpu, avg15]]]]]
		zabbix_log(LOG_LEVEL_DEBUG, "Requested [%s]", s->buffer);

		init_result(&result);

		 // Процесс: вызовите функцию элемента мониторинга (команда-> функция (и запрос, результат), данные мониторинга запросов
		if (SUCCEED == process(s->buffer, PROCESS_WITH_ALIAS, &result))
		 {/ Успех
			if (NULL != (value = GET_TEXT_RESULT(&result)))
			{
				 // Пример журнала: отправка обратно [0.640000]
				zabbix_log(LOG_LEVEL_DEBUG, "Sending back [%s]", *value);
				 // ZBX_TCP_SEND_TO: Написать (), отправьте элемент монитора на результат возврата сторона сервера
				ret = zbx_tcp_send_to(s, *value, CONFIG_TIMEOUT);
			}
		}
		else
		 {// не смогли
			value = GET_MSG_RESULT(&result);

			if (NULL != value)
			{
				static char	*buffer = NULL;
				static size_t	buffer_alloc = 256;
				size_t		buffer_offset = 0;

				zabbix_log(LOG_LEVEL_DEBUG, "Sending back [" ZBX_NOTSUPPORTED ": %s]", *value);

				if (NULL == buffer)
					buffer = (char *)zbx_malloc(buffer, buffer_alloc);

				zbx_strncpy_alloc(&buffer, &buffer_alloc, &buffer_offset,
						ZBX_NOTSUPPORTED, ZBX_CONST_STRLEN(ZBX_NOTSUPPORTED));
				buffer_offset++;
				zbx_strcpy_alloc(&buffer, &buffer_alloc, &buffer_offset, *value);

				ret = zbx_tcp_send_bytes_to(s, buffer, buffer_offset, CONFIG_TIMEOUT);
			}
			else
			{
				zabbix_log(LOG_LEVEL_DEBUG, "Sending back [" ZBX_NOTSUPPORTED "]");

				ret = zbx_tcp_send_to(s, ZBX_NOTSUPPORTED, CONFIG_TIMEOUT);
			}
		}

		free_result(&result);
	}

	if (FAIL == ret)
		zabbix_log(LOG_LEVEL_DEBUG, "Process listener error: %s", zbx_socket_strerror());
}
Активный контроль
1. Если агент работает в активном режиме, то агент запросит список активных элементов мониторинга на Zabbix Server, а затем отправить список активных элементов мониторинга на сервер Zabbix.
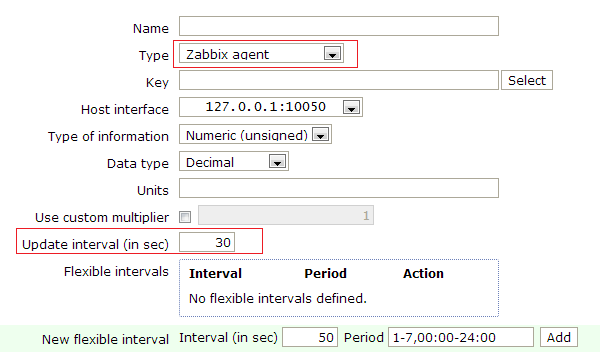
2. Тип элемента мониторинга активного режима требуется для выбора «Zabbix Agent» в интерфейсе интерфейса настройки.
3, в интерфейсе настроек передней частиUpdate interval: Монитор времени обновления данных в секундах. Этот параметр также будет получен, когда агент запрашивает список активных элементов мониторинга на сервер Zabbix. Агент будет активно отправлять данные мониторинга на сервер Zabbix на основе этого временного интервала. Мы увидим этот параметр в исходном коде.
Параметры конфигурации, связанные с активным режимом
Используйте Active Agent, вам необходимо указать следующие параметры конфигурации в файле конфигурации Zabbix_agentd.conf:
##### Active checks related

### Option: ServerActive
#	List of comma delimited IP:port (or DNS name:port) pairs of Zabbix servers and Zabbix proxies for active checks.
#	If port is not specified, default port is used.
#	IPv6 addresses must be enclosed in square brackets if port for that host is specified.
#	If port is not specified, square brackets for IPv6 addresses are optional.
#	If this parameter is not specified, active checks are disabled.
#	Example: ServerActive=127.0.0.1:20051,zabbix.domain,[::1]:30051,::1,[12fc::1]
#
# Mandatory: no
# Default:
# ServerActive=

ServerActive=127.0.0.1

### Option: Hostname
#	Unique, case sensitive hostname.
#	Required for active checks and must match hostname as configured on the server.
#	Value is acquired from HostnameItem if undefined.
#
# Mandatory: no
# Default:
# Hostname=

Hostname=Zabbix server

### Option: HostnameItem
#	Item used for generating Hostname if it is undefined. Ignored if Hostname is defined.
#	Does not support UserParameters or aliases.
#
# Mandatory: no
# Default:
# HostnameItem=system.hostname

### Option: HostMetadata
#	Optional parameter that defines host metadata.
#	Host metadata is used at host auto-registration process.
#	An agent will issue an error and not start if the value is over limit of 255 characters.
#	If not defined, value will be acquired from HostMetadataItem.
#
# Mandatory: no
# Range: 0-255 characters
# Default:
# HostMetadata=

### Option: HostMetadataItem
#	Optional parameter that defines an item used for getting host metadata.
#	Host metadata is used at host auto-registration process.
#	During an auto-registration request an agent will log a warning message if
#	the value returned by specified item is over limit of 255 characters.
#	This option is only used when HostMetadata is not defined.
#
# Mandatory: no
# Default:
# HostMetadataItem=

### Option: RefreshActiveChecks
#	How often list of active checks is refreshed, in seconds.
#
# Mandatory: no
# Range: 60-3600
# Default:
# RefreshActiveChecks=120

### Option: BufferSend
#	Do not keep data longer than N seconds in buffer.
#
# Mandatory: no
# Range: 1-3600
# Default:
# BufferSend=5

### Option: BufferSize
#	Maximum number of values in a memory buffer. The agent will send
#	all collected data to Zabbix Server or Proxy if the buffer is full.
#
# Mandatory: no
# Range: 2-65535
# Default:
# BufferSize=100

### Option: MaxLinesPerSecond
#	Maximum number of new lines the agent will send per second to Zabbix Server
#	or Proxy processing 'log' and 'logrt' active checks.
#	The provided value will be overridden by the parameter 'maxlines',
#	provided in 'log' or 'logrt' item keys.
#
# Mandatory: no
# Range: 1-1000
# Default:
# MaxLinesPerSecond=20-
ServerActive: Используется для указания Zabbix Server, способный получать данные мониторинга. Этот параметр — это список «IP-адресов: номеров портов» (или «имя хоста: номер порта») с запятой. Если номер порта не указан, используйте номер порта по умолчанию 10051. Если этот параметр не указан, активный режим агента отключен. -
Hostname: Используется для указания имени хоста контролируемого хоста, который является уникальным, который чувствителен к регистру. Это имя хоста должно быть идентичным имени хоста контролируемого хоста, зарегистрированного на передней странице Zabbix, в противном случае агент не будет успешно обновлять свой собственный список активных мониторинга. -
RefreshActiveChecks: Используется для уточнения временного интервала обновления активного списка элементов мониторинга, в считанные секунды. -
BufferSend: Используется для уточнения времени передачи буфера агента в секундах. Время накопления данных мониторинга не превышается временем, указанным этим параметром в буфере. -
BufferSize: Используется для указания размера буфера, то есть максимальное количество данных мониторинга. Если буфер заполнен, агент отправит все собранные данные мониторинга на сервер Zabbix или агент.
Zabbix_Sender Tools
Утилита Zabbix_Sender может использоваться для моделирования потоков сети связи между активными серверами агента и Zabbix. Zabbix_Sender применяется к стороне агента и передает данные на сервер.
Применение:
zabbix_sender [-hpzvIV] {-kso | [-T] -i <inputfile> } [-c <config-file> ]Вариант:
-
-c/--config <config-file>: Использоватьconfig-fileУказанный файл конфигурации. Zabbix_Sender прочитает детали сервера из файла конфигурации агента. Абсолютный путь файла конфигурации должен быть указан. По умолчанию Zabbix_Sender не читает какой-либо профиль. Zabbix_sender использует только в файле конфигурацииHostname、ServerActive(Только его первая запись) иSourceIPпараметр. -
-z/--zabbix-server <server>: Имя хоста или IP-адрес Zabbix Server. Если сервер контролируется прокси, то имя хоста или IP-адрес прокси должен быть указан. -
-p/--port <port>: Указывает номер порта сервера Capture (Frapper), работающий на сервере Zabbix. По умолчанию 10051. -
-s/--host <host>: Укажите имя хоста, зарегистрированное на странице передней части Zabbix. IP-адрес хоста и имя DNS не будет работать. -
-I/--source-address <IP>: Укажите IP-адрес источника. -
-k/--key <key>: Укажите ключевые слова для элемента мониторинга. -
-o/--value <value>: Укажите данные мониторинга. -
-i/--input-file <inputfile>: ИзinputfileДанные мониторинга нагрузки в указанном файле. -
-T/--with-timestamps: Эта опция может быть--input-fileОпция используется в сочетании. -
-r/--real-time: При получении данных мониторинга вы отправите его на сервер Zabbix. Эта опция может использоваться при чтении данных мониторинга со стандартного ввода.
пример: Выполните следующую команду на агенте Zabbix:
# ./zabbix_sender -c /etc/zabbix/zabbix_agentd.conf -k active.test.item -o 123.45рабочий процесс

Примечание. Для обработки потока «Данные мониторинга запросов» см. Следующий анализ.
Анализ исходного кода: Active_Checks_Thread
ZBX_THREAD_ENTRY(active_checks_thread, args)
{
	ZBX_THREAD_ACTIVECHK_ARGS activechk_args;

	time_t	nextcheck = 0, nextrefresh = 0, nextsend = 0, now, delta, lastcheck = 0;
	double	time_now;

	assert(args);
	assert(((zbx_thread_args_t *)args)->args);

	process_type = ((zbx_thread_args_t *)args)->process_type;
	server_num = ((zbx_thread_args_t *)args)->server_num;
	process_num = ((zbx_thread_args_t *)args)->process_num;

	zabbix_log(LOG_LEVEL_INFORMATION, "%s #%d started [%s #%d]", get_program_type_string(program_type),
			server_num, get_process_type_string(process_type), process_num);

	activechk_args.host = zbx_strdup(NULL, ((ZBX_THREAD_ACTIVECHK_ARGS *)((zbx_thread_args_t *)args)->args)->host);
	activechk_args.port = ((ZBX_THREAD_ACTIVECHK_ARGS *)((zbx_thread_args_t *)args)->args)->port;

	zbx_free(args);

	session_token = zbx_create_token(0);

	// инициализация активного мониторинга
	init_active_metrics();

	 	// Бесконечная петля
	while (ZBX_IS_RUNNING())
	{
		time_now = zbx_time();
		zbx_update_env(time_now);
		now = (int)time_now;

		 / / Отправить данные мониторинга в буфере, вызовите функции send_buffer
		if (now >= nextsend)
		{
			send_buffer(activechk_args.host, activechk_args.port);
			nextsend = time(NULL) + 1;
		}

		 // Обновить список активных элементов мониторинга, по умолчанию 120S щетка один раз.
		if (now >= nextrefresh)
		{
			zbx_setproctitle("active checks #%d [getting list of active checks]", process_num);
			 // Если обновление не удалось, в следующий раз после 60-х годов обновите его снова.
			if (FAIL == refresh_active_checks(activechk_args.host, activechk_args.port))
			{
				nextrefresh = time(NULL) + 60;
			}
			else
			{
				nextrefresh = time(NULL) + CONFIG_REFRESH_ACTIVE_CHECKS;
			}
		}

		 // Активно отправлять данные мониторинга
		if (now >= nextcheck && CONFIG_BUFFER_SIZE / 2 > buffer.pcount)
		{
			zbx_setproctitle("active checks #%d [processing active checks]", process_num);

			process_active_checks(activechk_args.host, activechk_args.port);

			if (CONFIG_BUFFER_SIZE / 2 <= buffer.pcount)	/* failed to complete processing active checks */
				continue;

			 // Найдите все минимальный интервал времени во всех активных метриках мониторинга, обновите время NextCreck, если вы не можете получить его, вы можете установить его по умолчанию 60-х.
			nextcheck = get_min_nextcheck();
			if (FAIL == nextcheck)
				nextcheck = time(NULL) + 60;
		}
		else
		{
			 // Текущее время - LastCheck <0, это произойдет в случае, когда системное время регулируется, в это время Zabbix должен соответственно обновлять значение NextCreck.
			if (0 > (delta = now - lastcheck))
			{
				zabbix_log(LOG_LEVEL_WARNING, "the system time has been pushed back,"
						" adjusting active check schedule");
				 // Время системы регулируется, обновляет расписание задач активных мониторинга, NextCreck + Delta для каждого индикатора
				update_schedule((int)delta);
				nextcheck += delta;
				nextsend += delta;
				nextrefresh += delta;
			}

			zbx_setproctitle("active checks #%d [idle 1 sec]", process_num);
			 / / Сон 1с, не отправляя активные метрики мониторинга
			zbx_sleep(1);
		}

		lastcheck = now;
	}

	zbx_free(session_token);
}

static void	process_active_checks(char *server, unsigned short port)
{
	const char	*__function_name = "process_active_checks";
	char		*error = NULL;
	int		i, now, ret;

	zabbix_log(LOG_LEVEL_DEBUG, "In %s() server:'%s' port:%hu", __function_name, server, port);

	now = (int)time(NULL);

	 // Traverse Active_Metrics, отправляет ИТ-сеанс
	for (i = 0; i < active_metrics.values_num; i++)
	{
		zbx_uint64_t		lastlogsize_last, lastlogsize_sent;
		int			mtime_last, mtime_sent;
		ZBX_ACTIVE_METRIC	*metric;

		metric = (ZBX_ACTIVE_METRIC *)active_metrics.values[i];

		 / / Если время NextCreck, установленном индикатором, превышает текущее время, индикатор не отправляет его, продолжайте следующий индикатор.
		if (metric->nextcheck > now)
			continue;

		...
		 // Отправить индикатор, вызовите функцию send_buffer
		send_buffer(server, port);
		 // Обновление Далее Отправить время
		metric->nextcheck = (int)time(NULL) + metric->refresh;
	}
}
1. Функция отправки индикатораsend_buffer,будутbufferДанные отправляются на стороне сервера,bufferДанные будут сериализоватьjsonСреда, затем используйтеzbx_tcp_sendФункция отправляется. Мы введем в следующую статью.
2、active_checks_threadВ 3 времени параметры, они являются:
-
RefreshActiveChecks: Используется для уточнения временного интервала обновления активного списка элементов мониторинга, в считанные секунды.-
«Текущее время — последнее время обновления> = Обновить интервал времени (
RefreshActiveChecksКогда вы обновляете активный мониторинг.
-
-
Update interval: Монитор времени обновления данных в секундах. Агент будет активно отправлять данные мониторинга на сервер Zabbix на основе этого временного интервала.-
«Текущее время — время доставки в последний раз> = Интервал времени отправки (
Update intervalПри отправке активного индикатора мониторинга.
-
-
BufferSend: Используется для уточнения времени передачи буфера агента в секундах. Время накопления данных мониторинга не превышается временем, указанным этим параметром в буфере.