Операционная система Windows, системные службы и приложения записывают события и ошибки в системные журналы, чтобы в дальнейшем у системного администратора была возможность проверки операционной системы и диагностики проблем.
Получить доступ к этим записям можно через встроенное приложение Просмотр событий (Event Viewer). Есть несколько вариантов запуска данного приложения:
- через меню Пуск – Средства администрирования Windows – >Просмотр событий (Start – Windows Administrative Tools – Event Viewer);
- в командной строке или в окне Выполнить набрать eventvwr.msc:

В Диспетчере серверов в разделе Средства выбрать Просмотр событий (Server Manager – Tools – Event Viewer):

Описание интерфейса программы
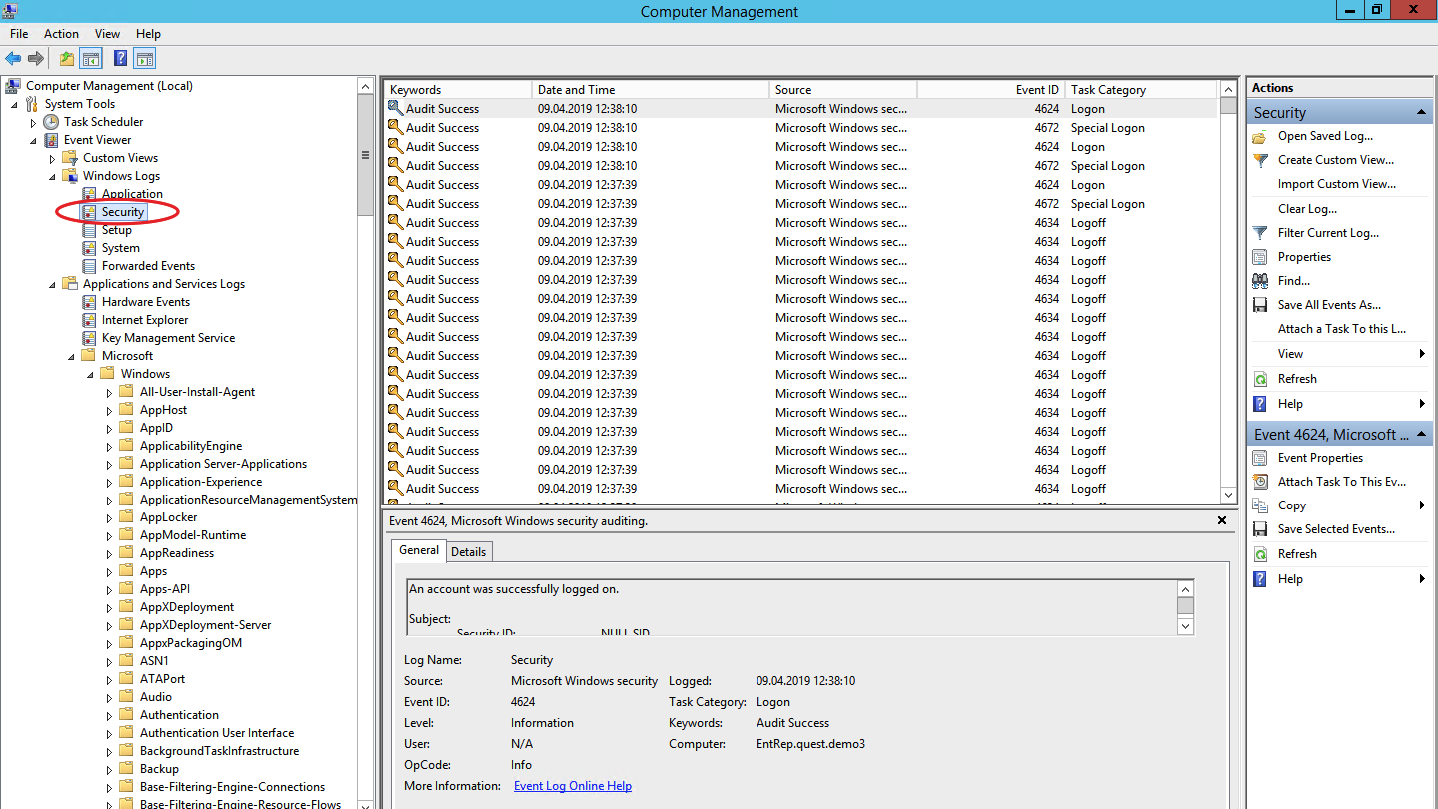
Окно программы состоит из следующих компонентов:

- Панель навигации позволяет выбрать конкретный журнал, записи которого необходимо просмотреть;
- Список событий, содержащийся в выбранном журнале. В колонках выведена базовая информация о событии. Их можно отсортировать по датам, типам, категориям событий и т.д.;
- Детальная информация о выбранном во второй панели событии. Также детальную информацию можно открыть в отдельном окне, если кликнуть по нужному событию два раза;
- Панель быстрых действий, которые можно совершить с данным журналом или событием. Действия также доступны в контекстном меню (клик правой кнопкой мыши по журналу или событию).
Для удобства просмотра и управления системные журналы разбиты по категориям:
- Приложения (Application) – как и гласит название, содержит события и ошибки приложений;
- Безопасность (Security) – если в операционной системе включена и настроена функция аудита, журнал будет содержать записи, связанные с отслеживанием соответствующих событий (например, авторизация пользователя или попытки неудачного входа в операционную систему);
- Система (System) – здесь регистрируются события операционной системы и системных сервисов;
- Установка (Setup) – события, связанные с инсталляцией обновлений Windows, дополнительных приложений.
В разделе Журналы приложений и служб (Applications and Services Logs) можно найти более детальную информацию о событиях отдельных служб и приложений, зарегистрированных в операционной системе, что бывает полезно при диагностике проблем в работе отдельных сервисов.
Сами события также разделяются на типы:
- Сведения (Information) — информируют о штатной работе приложений.
- Предупреждение (Warning) — событие, свидетельствующее о возможных проблемах в будущем (например, заканчивается свободное место на диске – приложения могут продолжать работу в штатном режиме, но когда место закончится совсем, работа будет невозможна).
- Ошибка (Error) — проблема, ведущая к деградации приложения или службы, потерям данных.
- Критическое (Critical) — значительная проблема, ведущая к неработоспособности приложения или службы.
- Аудит успеха (Success audit) — событие журнала Безопасность (Security), обозначающее успешно осуществленное действие, для которого включено отслеживание (например, успешный вход в систему).
- Аудит отказа (Failure audit) — событие журнала Безопасность (Security) обозначающее безуспешную попытку осуществить действие, для которого включено отслеживание (например, ошибка входа в систему).
Работа с журналами
Службы и приложения могут генерировать огромное количество самых разнообразных событий. Для простоты доступа к нужным записям журнала можно использовать функцию фильтрации журнала:

Правый клик по журналу – Фильтр текущего журнала… (>Filter Current Log…), либо выбрать данную функцию в панели быстрых действий. Открывшееся окно позволяет настроить фильтр и отобразить только те события, которые необходимы в данный момент:

Можно задать временной период, уровни события, выбрать журналы и конкретные источники событий. Если известны коды событий, которые нужно включить или исключить из фильтра, их также можно указать.
Когда необходимость в фильтрации событий отпадет, ее можно отключить действием Очистить фильтр (Clear Filter):

Приложение Просмотр событий (Event Viewer) позволяет также настроить дополнительные свойства журналов. Доступ к настройкам можно получить через панель быстрых действий, либо через контекстное меню журнала – правый клик по журналу – Свойства (Properties):

В открывшемся окне настроек можно увидеть путь, по которому сохраняется файл журнала, текущий размер, а также можно задать максимальный размер файла:

В нижней части окна можно выбрать вариант действия при достижении журналом максимального значения:
- Переписывать события при необходимости (Overwrite events as needed) – новое событие будет записываться поверх самого старого события в журнале, таким образом будут доступны события только за определенный диапазон времени.
- Архивировать журнал при заполнении (Overwrite the log when full) – заполненный журнал будет сохранен, последующие события будут записываться в новый файл журнала. При необходимости доступа к старым событиям, архивный файл можно будет открыть в приложении Просмотр событий (Event Viewer).
- Не переписывать события (Do not overwrite events) – при заполнении журнала выдается системное сообщение о необходимости очистить журнал, старые события не перезаписываются.
Аverage rating : 4.5
Оценок: 4
191028
Санкт-Петербург
Литейный пр., д. 26, Лит. А
+7 (812) 403-06-99
![]()
700
300
ООО «ИТГЛОБАЛКОМ ЛАБС»
191028
Санкт-Петербург
Литейный пр., д. 26, Лит. А
+7 (812) 403-06-99
![]()
700
300
ООО «ИТГЛОБАЛКОМ ЛАБС»
![]()
700
300
Время на прочтение
5 мин
Количество просмотров 63K
Пользовательская рабочая станция — самое уязвимое место инфраструктуры по части информационной безопасности. Пользователям может прийти на рабочую почту письмо вроде бы из безопасного источника, но со ссылкой на заражённый сайт. Возможно, кто-то скачает полезную для работы утилиту из неизвестно какого места. Да можно придумать не один десяток кейсов, как через пользователей вредоносное ПО может внедриться на внутрикорпоративные ресурсы. Поэтому рабочие станции требуют повышенного внимания, и в статье мы расскажем, откуда и какие события брать для отслеживания атак.
Для выявления атаки на самой ранней стадии в ОС Windows есть три полезных событийных источника: журнал событий безопасности, журнал системного мониторинга и журналы Power Shell.
Журнал событий безопасности (Security Log)
Это главное место хранения системных логов безопасности. Сюда складываются события входа/выхода пользователей, доступа к объектам, изменения политик и других активностей, связанных с безопасностью. Разумеется, если настроена соответствующая политика.
Перебор пользователей и групп (события 4798 и 4799). Вредоносное ПО в самом начале атаки часто перебирает локальные учетные записи пользователей и локальные группы на рабочей станции, чтобы найти учетные данные для своих тёмных делишек. Эти события помогут обнаружить вредоносный код раньше, чем он двинется дальше и, используя собранные данные, распространится на другие системы.
Создание локальной учётной записи и изменения в локальных группах (события 4720, 4722–4726, 4738, 4740, 4767, 4780, 4781, 4794, 5376 и 5377). Атака может также начинаться, например, с добавления нового пользователя в группу локальных администраторов.
Попытки входа с локальной учётной записью (событие 4624). Добропорядочные пользователи заходят с доменной учётной записью и выявление входа под локальной учётной записью может означать начало атаки. Событие 4624 включает также входы под доменной учетной записью, поэтому при обработке событий нужно зафильтровать события, в которых домен отличается от имени рабочей станции.
Попытка входа с заданной учётной записью (событие 4648). Такое бывает, когда процесс выполняется в режиме “Запуск от имени” (run as). В нормальном режиме работы систем такого не должно быть, поэтому такие события должны находиться под контролем.
Блокировка/разблокировка рабочей станции (события 4800-4803). К категории подозрительных событий можно отнести любые действия, которые происходили на заблокированной рабочей станции.
Изменения конфигурации файрволла (события 4944-4958). Очевидно, что при установке нового ПО настройки конфигурации файрволла могут меняться, что вызовет ложные срабатывания. Контролировать такие изменения в большинстве случаев нет необходимости, но знать о них точно лишним не будет.
Подключение устройств Plug’n’play (событие 6416 и только для WIndows 10). За этим важно следить, если пользователи обычно не подключают новые устройства к рабочей станции, а тут вдруг раз — и подключили.
Windows включает в себя 9 категорий аудита и 50 субкатегорий для тонкой настройки. Минимальный набор субкатегорий, который стоит включить в настройках:
Logon/Logoff
- Logon;
- Logoff;
- Account Lockout;
- Other Logon/Logoff Events.
Account Management
- User Account Management;
- Security Group Management.
Policy Change
- Audit Policy Change;
- Authentication Policy Change;
- Authorization Policy Change.
Системный монитор (Sysmon)
Sysmon — встроенная в Windows утилита, которая умеет записывать события в системный журнал. Обычно требуется его устанавливать отдельно.

Эти же события можно в принципе найти в журнале безопасности (включив нужную политику аудита), но Sysmon даёт больше подробностей. Какие события можно забирать из Sysmon?
Создание процесса (ID события 1). Системный журнал событий безопасности тоже может сказать, когда запустился какой-нибудь *.exe и даже покажет его имя и путь запуска. Но в отличие от Sysmon не сможет показать хэш приложения. Злонамеренное ПО может называться даже безобидным notepad.exe, но именно хэш выведет его на чистую воду.
Сетевые подключения (ID события 3). Очевидно, что сетевых подключений много, и за всеми не уследить. Но важно учитывать, что Sysmon в отличие от того же Security Log умеет привязать сетевое подключение к полям ProcessID и ProcessGUID, показывает порт и IP-адреса источника и приёмника.
Изменения в системном реестре (ID события 12-14). Самый простой способ добавить себя в автозапуск — прописаться в реестре. Security Log это умеет, но Sysmon показывает, кто внёс изменения, когда, откуда, process ID и предыдущее значение ключа.
Создание файла (ID события 11). Sysmon, в отличие от Security Log, покажет не только расположение файла, но и его имя. Понятно, что за всем не уследишь, но можно же проводить аудит определённых директорий.
А теперь то, чего в политиках Security Log нет, но есть в Sysmon:
Изменение времени создания файла (ID события 2). Некоторое вредоносное ПО может подменять дату создания файла для его скрытия из отчётов с недавно созданными файлами.
Загрузка драйверов и динамических библиотек (ID событий 6-7). Отслеживание загрузки в память DLL и драйверов устройств, проверка цифровой подписи и её валидности.
Создание потока в выполняющемся процессе (ID события 8). Один из видов атаки, за которым тоже нужно следить.
События RawAccessRead (ID события 9). Операции чтения с диска при помощи “\\.\”. В абсолютном большинстве случаев такая активность должна считаться ненормальной.
Создание именованного файлового потока (ID события 15). Событие регистрируется, когда создается именованный файловый поток, который генерирует события с хэшем содержимого файла.
Создание named pipe и подключения (ID события 17-18). Отслеживание вредоносного кода, который коммуницирует с другими компонентами через named pipe.
Активность по WMI (ID события 19). Регистрация событий, которые генерируются при обращении к системе по протоколу WMI.
Для защиты самого Sysmon нужно отслеживать события с ID 4 (остановка и запуск Sysmon) и ID 16 (изменение конфигурации Sysmon).
Журналы Power Shell
Power Shell — мощный инструмент управления Windows-инфраструктурой, поэтому велики шансы, что атакующий выберет именно его. Для получения данных о событиях Power Shell можно использовать два источника: Windows PowerShell log и Microsoft-WindowsPowerShell / Operational log.
Windows PowerShell log

Загружен поставщик данных (ID события 600). Поставщики PowerShell — это программы, которые служат источником данных для PowerShell для просмотра и управления ими. Например, встроенными поставщиками могут быть переменные среды Windows или системный реестр. За появлением новых поставщиков нужно следить, чтобы вовремя выявить злонамеренную активность. Например, если видите, что среди поставщиков появился WSMan, значит был начат удаленный сеанс PowerShell.
Microsoft-WindowsPowerShell / Operational log (или MicrosoftWindows-PowerShellCore / Operational в PowerShell 6)

Журналирование модулей (ID события 4103). В событиях хранится информация о каждой выполненной команде и параметрах, с которыми она вызывалась.
Журналирование блокировки скриптов (ID события 4104). Журналирование блокировки скриптов показывает каждый выполненный блок кода PowerShell. Даже если злоумышленник попытается скрыть команду, этот тип события покажет фактически выполненную команду PowerShell. Ещё в этом типе события могут фиксироваться некоторые выполняемые низкоуровневые вызовы API, эти события обычно записывается как Verbose, но если подозрительная команда или сценарий используются в блоке кода, он будет зарегистрирован как c критичностью Warning.
Обратите внимание, что после настройки инструмента сбора и анализа этих событий потребуется дополнительное время на отладку для снижения количества ложных срабатываний.
Расскажите в комментариях, какие собираете логи для аудита информационной безопасности и какие инструменты для этого используете. Одно из наших направлений — решения для аудита событий информационной безопасности. Для решения задачи сбора и анализа логов можем предложить присмотреться к Quest InTrust, который умеет сжимать хранящиеся данные с коэффициентом 20:1, а один его установленный экземпляр способен обрабатывать до 60000 событий в секунду из 10000 источников.
Содержание:
- 1 Где находится журнал событий Windows
- 2 Как открыть журнал
- 3 Как использовать содержимое журнала
- 4 Очистка, удаление и отключение журнала
Даже когда пользователь ПК не совершает никаких действий, операционная система продолжает считывать и записывать множество данных. Наиболее важные события отслеживаются и автоматически записываются в особый лог, который в Windows называется Журналом событий. Но для чего нужен такой мониторинг? Ни для кого не является секретом, что в работе операционной системы и установленных программ могут возникать сбои. Чтобы администраторы могли находить причины таких ошибок, система должна их регистрировать, что собственно она и делает.
Итак, основным предназначением Журнала событий в Windows 7/10 является сбор данных, которые могут пригодиться при устранении неисправностей в работе системы, программного обеспечения и оборудования. Впрочем, заносятся в него не только ошибки, но также и предупреждения, и вполне удачные операции, например, установка новой программы или подключение к сети.
Физически Журнал событий представляет собой набор файлов в формате EVTX, хранящихся в системной папке %SystemRoot%/System32/Winevt/Logs.
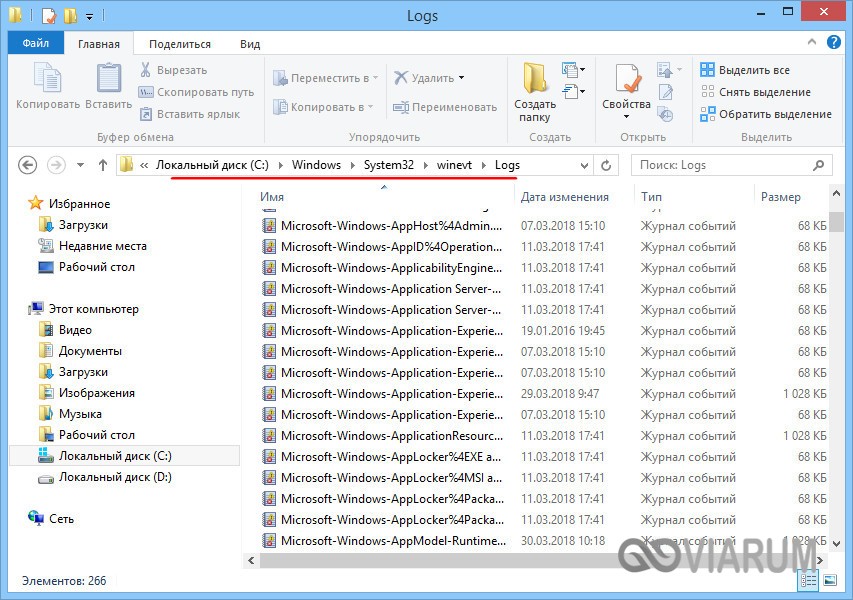
Хотя эти файлы содержат текстовые данные, открыть их Блокнотом или другим текстовым редактором не получится, поскольку они имеют бинарный формат. Тогда как посмотреть Журнал событий в Windows 7/10, спросите вы? Очень просто, для этого в системе предусмотрена специальная штатная утилита eventvwr.
Как открыть журнал
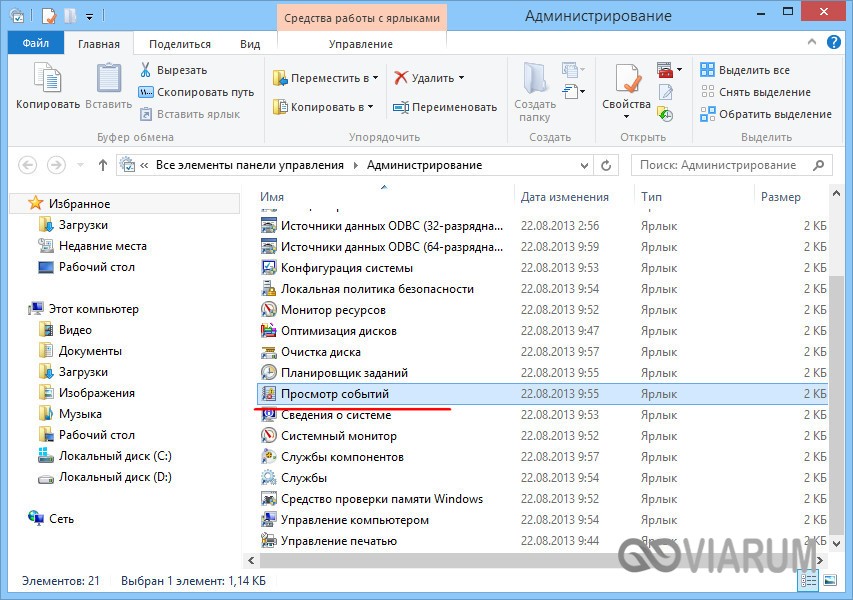
Запустить утилиту можно из классической Панели управления, перейдя по цепочке Администрирование – Просмотр событий или выполнив в окошке Run (Win+R) команду eventvwr.msc.
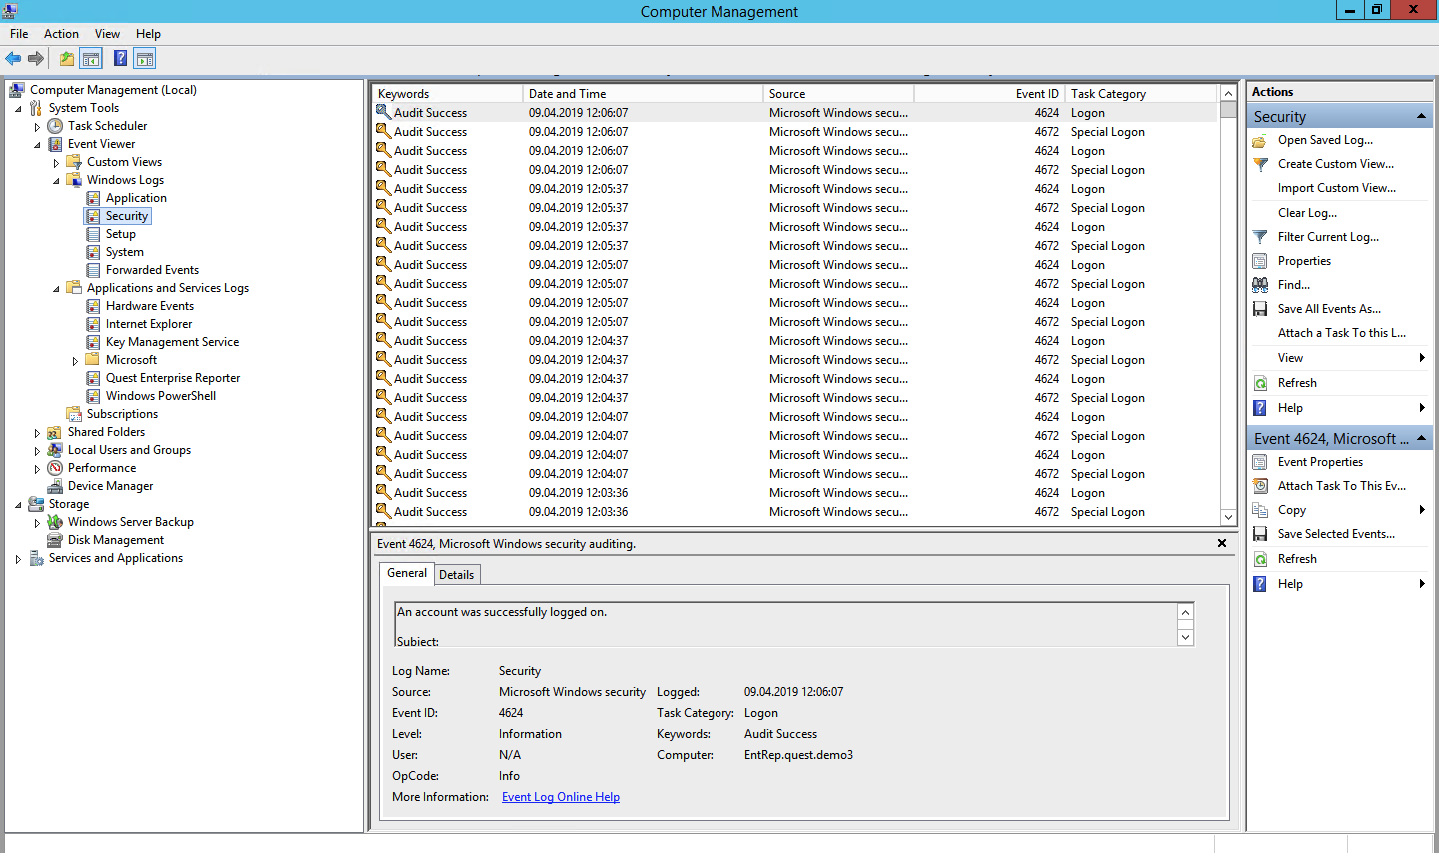
В левой колонке окна утилиты можно видеть отсортированные по разделам журналы, в средней отображается список событий выбранной категории, в правой – список доступных действий с выбранным журналом, внизу располагается панель подробных сведений о конкретной записи. Всего разделов четыре: настраиваемые события, журналы Windows, журналы приложений и служб, а также подписки.
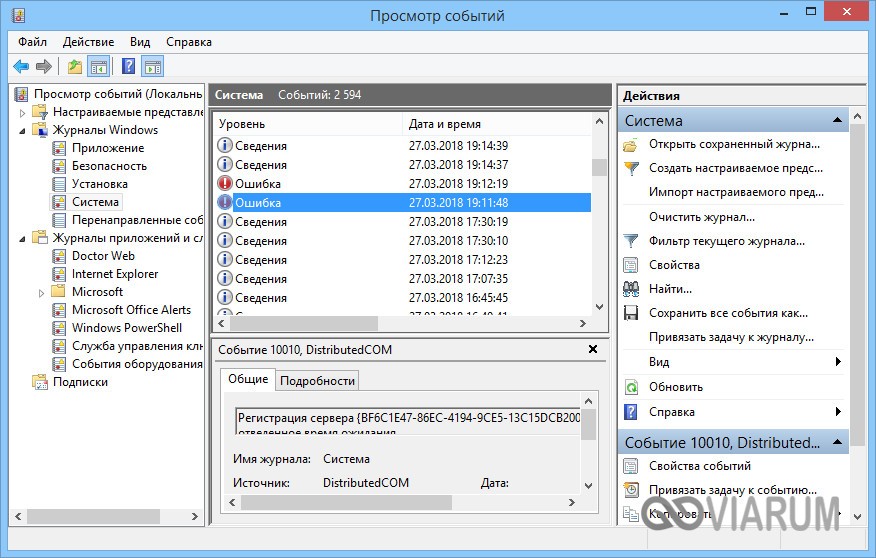
Наибольший интерес представляет раздел «Журналы Windows», именно с ним чаще всего приходится работать, выясняя причины неполадок в работе системы и программ. Журнал системных событий включает три основных и две дополнительных категории. Основные это «Система», «Приложения» и «Безопасность», дополнительные – «Установка» и «Перенаправленные события».
Категория «Система» содержит события, сгенерированные системными компонентами – драйверами и модулями Windows.
Ветка «Приложения» включает записи, созданные различными программами. Эти данные могут пригодиться как системным администраторам и разработчикам программного обеспечения, так и обычным пользователям, желающим установить причину отказа той или иной программы.
Третья категория событий «Безопасность» содержит сведения, связанные с безопасностью системы. К ним относятся входы пользователей в аккаунты, управление учётными записями, изменение разрешений и прав доступа к файлам и папкам, запуск и остановка процессов и так далее.
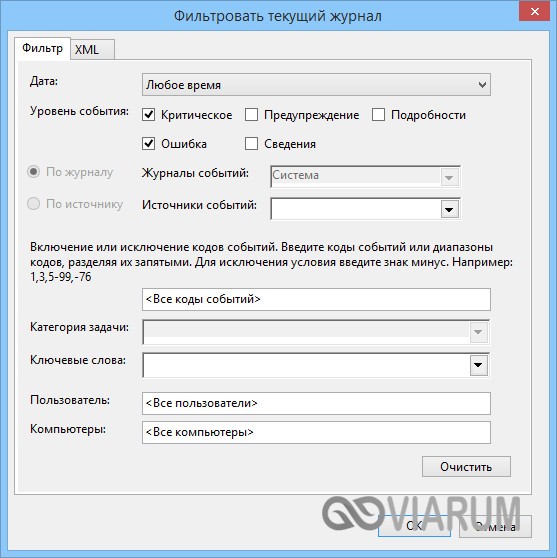
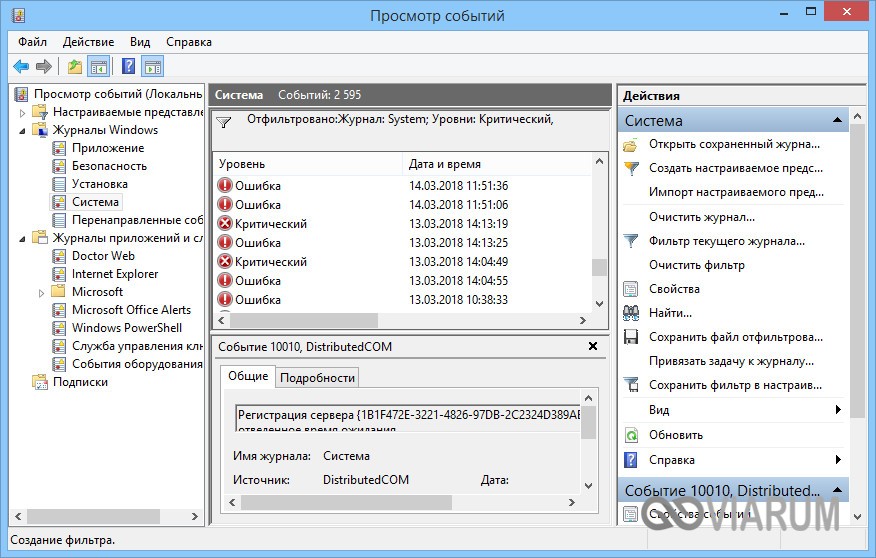
Так как число событий может исчисляться тысячами и даже десятками тысяч, в eventvwr предусмотрена возможность поиска и фильтрации событий по свойствам – важности, времени, источнику, имени компьютера и пользователя, коду и так далее. Допустим, вы хотите получить список системных ошибок. Выберите слева Журналы Windows – Система, справа нажмите «Фильтр текущего журнала» и отметьте в открывшемся окне галочкой уровень события – пункты «Ошибка» и «Критическое». Нажмите «OK» и утилита тут же отфильтрует записи.
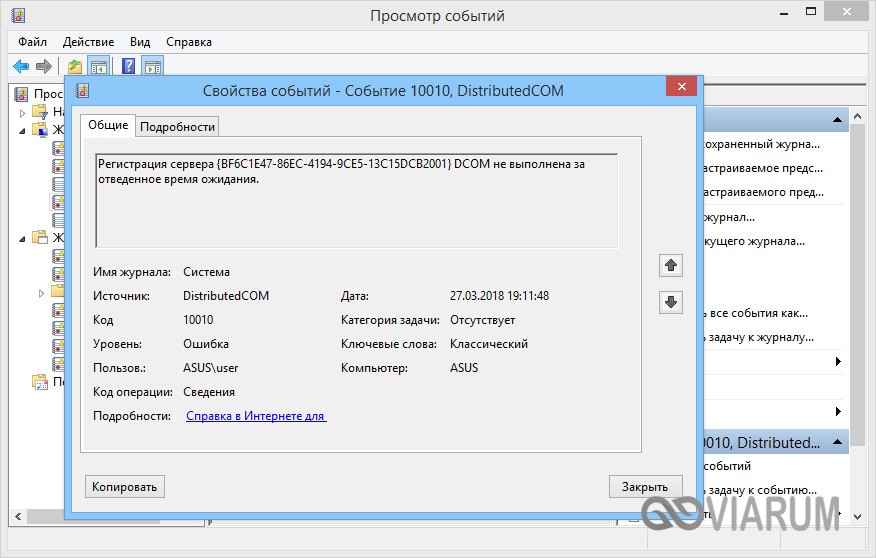
Чтобы просмотреть конкретную запись, кликните по ней дважды – сведения откроются в окошке «Свойства событий».
Как использовать содержимое журнала
Хорошо, теперь мы в курсе, где находится журнал событий и как его открыть, осталось узнать, как его можно использовать. Сразу нужно сказать, что в силу своей специфичности содержащиеся в нем сведения мало что могут поведать обычному пользователю. О чем говорит, к примеру, ошибка «Регистрация сервера {BF6C1E47-86EC-4194-9CE5-13C15DCB2001} DCOM не выполнена за отведенное время ожидания»? Не обладающему соответствующими знаниями юзеру будет непросто определить причину неполадки, с другой стороны, что мешает поискать ответ в Интернете?
Так, описание приведенной выше ошибки имеется на сайте Microsoft и указывает оно на проблемы со SkyDrive, кстати, не представляющие совершенно никакой угрозы. Если вы не пользуетесь этим сервисом, ошибку можно игнорировать или отключить ее источник в «Планировщике заданий». А еще описание ошибки можно отправить разработчику, предварительно сохранив его в файл XML, CSV или TХT.
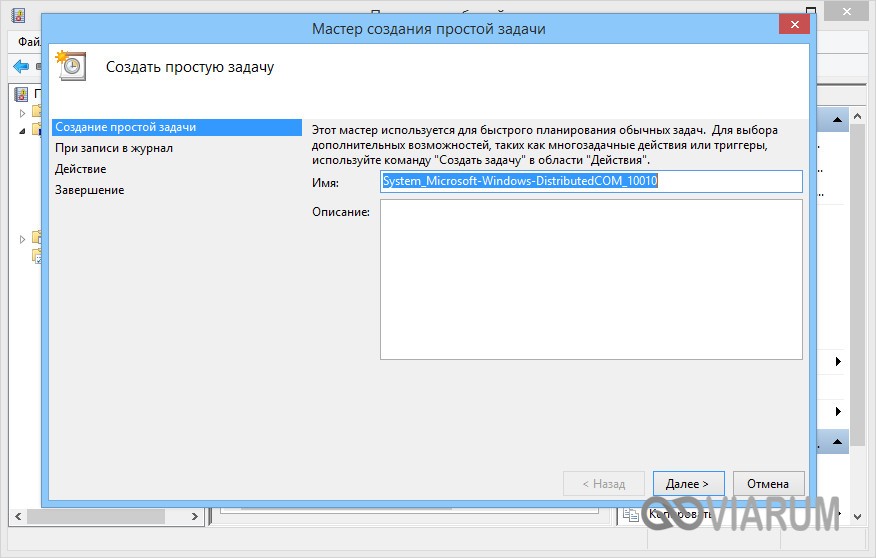
Также пользователи могут связывать отслеживаемые события с задачами в «Планировщике заданий». Для этого необходимо кликнуть ПКМ по записи, выбрать «Привязать задачу к событию» и создать с помощью запустившегося мастера нужное задание. В следующий раз, когда произойдет такое событие, система сама запустит выполнение задания.
Очистка, удаление и отключение журнала
На жестком диске файлы журнала занимают сравнительно немного места, тем не менее, у пользователя может возникнуть необходимость их очистить. Сделать это можно разными способами: с помощью оснастки eventvwr, командной строки и PowerShell. Для выборочной очистки вполне подойдет ручной способ. Нужно зайти в журнал событий, кликнуть ПКМ по очищаемому журналу в левой колонке и выбрать в меню опцию «Очистить журнал».

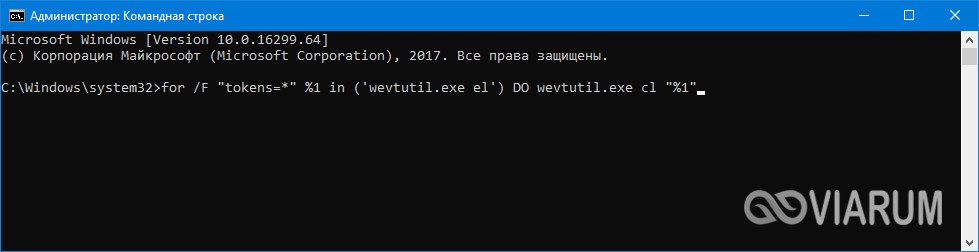
Если вы хотите полностью удалить все записи журнала, удобнее будет воспользоваться запущенной от имени администратора командной строкой. Команда очистки выглядит следующим образом:
for /F “tokens=*” %1 in (‘wevtutil.exe el’) DO wevtutil.exe cl “%1”

Вместо командной строки для быстрой и полной очистки журнала также можно воспользоваться консолью PowerShell. Откройте ее с повышенными правами и выполните в ней такую команду:
wevtutil el | Foreach-Object {wevtutil cl “$_”}

При очистке через PowerShell в журнале могут остаться несколько записей. Это не беда, в крайнем случае события можно удалить вручную.
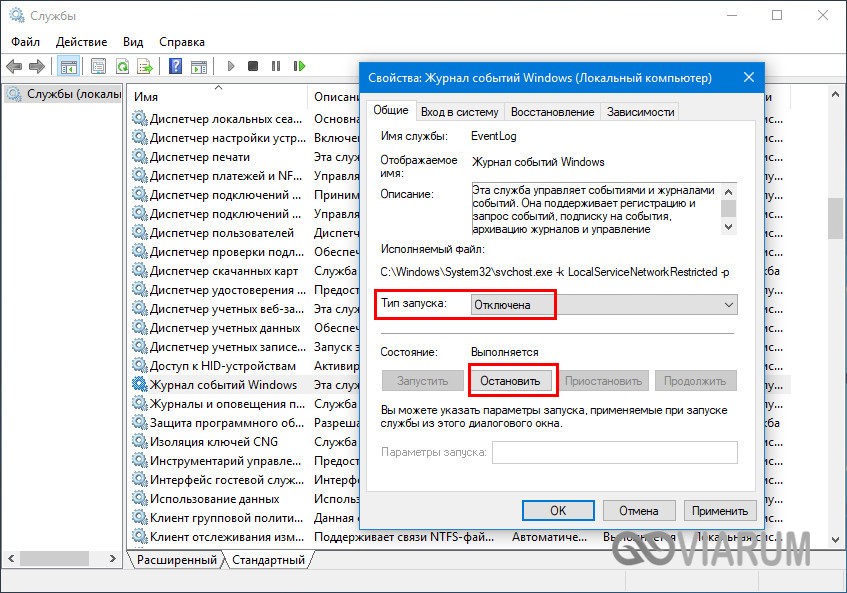
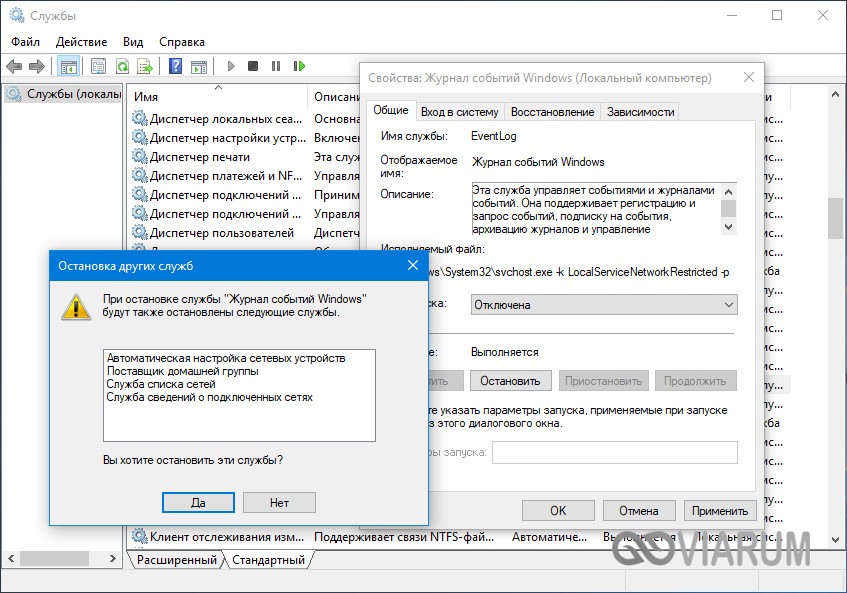
Итак, мы знаем, как открыть журнал событий, знаем, как его использовать и очищать, в завершение давайте посмотрим, как его полностью отключить, хотя делать это без особой нужды не рекомендуется, так как вместе с журналом событий отключатся некоторые, возможно нужные вам службы.
Командой services.msc откройте оснастку «Службы», справа найдите «Журнал событий Windows», кликните по нему дважды, в открывшемся окошке свойств тип запуска выберите «Отключено», а затем нажмите кнопку «Остановить».
Изменения вступят в силу после перезагрузки компьютера. Вот и все, больше системные и программные события регистрироваться не будут.
Introduction to Windows Event Logs and the tools to query them.
Event Logs are recorded events occurring in the execution of a system. This provided audit trail can be utilized to understand activity and diagnosis of a system. This includes complex systems with little user interaction.
A defender can use event logs to combine entries from multiple sources with statistical analysis to view possible correlations. SIEM’s can be used to accomplish this in a large enterprise environment where one can view the logs from all the endpoints, appliances, etc. to query the logs from multiple devices instead of manually connecting to a single device to view its logs.
The Windows Event Logs are not text files that can be viewed using a text editor. The raw data can be translated into XML using the Windows API. The events in these log files are stored in a proprietary binary format with a .evt or .evtx extension. The log files with the .evtx file extension typically reside in C:\Windows\System32\winevt\Logs.
Elements of a Windows Event Log
Elements of a Windows Event Log
Event logs are used to troubleshoot incidents and understanding the situation and to remediate.
Elements in event logs in Windows systems are:
-
System Logs: Records events associated with the Operating System segments. They may include information about hardware changes, device drivers, system changes, and other activities related to the device.
-
Security Logs: Records events connected to logon and logoff activities on a device. The system’s audit policy specifies the events. The logs are an excellent source for analysts to investigate attempted or successful unauthorized activity.
-
Application Logs: Records events related to applications installed on a system. The main pieces of information include application errors, events, and warnings.
-
Directory Service Events: Active Directory changes and activities are recorded in these logs, mainly on domain controllers.
-
File Replication Service Events: Records events associated with Windows Servers during the sharing of Group Policies and logon scripts to domain controllers, from where they may be accessed by the users through the client servers.
-
DNS Event Logs: DNS servers use these logs to record domain events and to map out.
-
Custom Logs: Events are logged by applications that require custom data storage. This allows applications to control the log size or attach other parameters, such as ACLs, for security purposes.
Event logs can be classified into types to describe the activity resulting a logged event.
|
Event type |
Description |
|---|---|
|
Error |
Indicates a significant problem such as loss of data or functionality. |
|
Warning |
May indicate a possible future problem. |
|
Information |
Describes successful operation of an application, driver, or service. |
|
Success Audit |
Recorded audited security access attempt that is successful. |
|
Failure Audit |
Recorded audited security access attempt that fails. |
Recorded audited security access attempt that is successful.
Three main ways of accessing these event logs within a Windows system:
-
1.
Event Viewer (GUI-based application)
-
2.
Wevtutil.exe (command-line tool)
-
3.
Get-WinEvent (PowerShell cmdlet)
In any Windows system, the Event Viewer, a Microsoft Management Console (MMC) snap-in, can be launched by simply right-clicking the Windows icon in the taskbar and selecting Event Viewer. For the savvy sysadmins that use the CLI much of their day, Event Viewer can be launched by typing eventvwr.msc. It is a GUI-based application that allows you to interact quickly with and analyze logs.
Event Viewer has three panes.
-
1.
The pane on the left provides a hierarchical tree listing of the event log providers.
-
2.
The pane in the middle will display a general overview and summary of the events specific to a selected provider.
-
3.
The pane on the right is the actions pane.

The following section is the Applications and Services Logs. Expand this section and drill down on Microsoft > Windows > PowerShell > Operational. PowerShell will log operations from the engine, providers, and cmdlets to the Windows event log.
Right-click on Operational then Properties.
Within Properties, we see the log location, log size, and when it was created, modified, and last accessed. Within the Properties window, we can also see the maximum set log size and what action to take once the criteria are met. This concept is known as log rotation. These are discussions held with corporations of various sizes. How long does it take to keep logs, and when it’s permissible to overwrite them with new data.

Lastly, noticing the Clear Log button at the bottom right. Know there are legitimate reasons to use this button, such as during security maintenance, but adversaries will likely attempt to clear the logs to go undetected. Note: This is not the only method to remove the event logs for any given event provider.
Focusing on the middle pane, we can display the events specific to a selected provider. In this case, PowerShell/Operational.

The event provider’s name and the number of events logged and displayed here.
Each column of the pane presents a particular type of information as described below:
-
Level: Highlights the log recorded type based on the identified event types specified earlier. In this case, the log is labeled as Information.
-
Date and Time: Highlights the time at which the event was logged.
-
Source: The name of the software that logs the event is identified. From the above image, the source is PowerShell.
-
Event ID: This is a predefined numerical value that maps to a specific operation or event based on the log source. This makes Event IDs not unique, so
Event ID 4103in the above image is related to Executing Pipeline but will have an entirely different meaning in another event log. -
Task Category: Highlights the Event Category. This entry will help you organize events so the Event Viewer can filter them. The event source defines this column.

The middle pane has a split view. More information is displayed in the bottom half of the middle pane for any event you click on.
This section has two tabs: General and Details.
-
General is the default view, and the rendered data is displayed.
-
The Details view has two options: Friendly view and XML view.

Lastly, we can open a saved log within the Actions pane. This is useful if the remote machine can’t be accessed. The logs can be provided to the analyst.
The Create Custom View and Filter Current Log are nearly identical. The only difference between the 2 is that the By log and By source radio buttons are greyed out in Filter Current Log. What is the reason for that? The filter we can make with this specific action only relates to the current log. Hence no reason for by log or by source to be enabled.


Why are these actions beneficial? If we don’t want all the events associated with PowerShell/Operational cluttering all the real estate in the pane and are only interested in 4104 events. That is possible with these two actions.
To view event logs from another computer, right-click Event Viewer (Local) > Connect to Another Computer...

Connect to Another Computer
What is the Event ID for the first recorded event?

Filter on Event ID 4104. What was the 2nd command executed in the PowerShell session?

What is the Task Category for Event ID 4104?

Analyze the Windows PowerShell log. What is the Task Category for Event ID 800?

Pipeline Execution Details
Wevtutil.exe is a tool that can be utilized for allowing querying of event logs via command line and Powershell. An addition to the tool is the ability to install/uninstall event manifests, run queries, and to export/archive/clear logs.

Under Usage is a brief example of how to use the tool. ep (enum-publishers) is used as a command for wevtutil.exe.
Next are Common options that can be used with WIndows Events Utility.

The bottom of the command prompt shows wevtutil COMMAND /?. This provides additional information specific to a command. Ex, to get more information on the command qe (query-events):

How many log names are in the machine?

What event files would be read when using the query-events command?
event log, log file, structured query
What option would you use to provide a path to a log file?
What is the VALUE for /q?
The questions below are based on this command: wevtutil qe Application /c:3 /rd:true /f:text
What is the /rd option for?
What is the /c option for?
Maximum number of events to read
The Powershell cmdlet Get-WinEvent gets events from event logs and event tracing log files as well as remote computers. This cmdlet provides information on event logs and providers and allows for combining numerous events from multiple sources. This is put into a single command and filter using XPath, structured XML, and hash table queries.
The Get-WinEvent cmdlet replaces the Get-EventLog cmdlet.
Example 1: Get all logs from a computer
Example 1: Get all logs from a computer
Below describes how to obtainall event logs locally. The list starts with class logs before listing new Window Event logs. The RecordCount be zero or null.

Example 2: Get event log providers and log names
Example 2: Get event log providers and log names
Theis command results in the event log providers and their associated logs. The Name is the provider, and LogLinks is the log that is written to.

Log filtering allows for selecting events from an event log. Filter event logs using the Where-Object cmdlet as follows:

-LogName Application | Where-Object
It’s inefficient to send objects down the pipeline to a Where-Object command when working with large event logs. The use of the Get-WinEvent cmdlet’s FilterHashtable parameter is recommended to filter event logs. Achieve the same results as above by running the following command:
Get-WinEvent —FilterHashtable @{
The syntax of a hash table is as follows:
@{ <name> = <value>; [<name> = <value> ] …}
Guidelines for defining a hash table are:
-
Begin the hash table with an @ sign.
-
Enclose the hash table in braces {}
-
Enter one or more key-value pairs for the content of the hash table.
-
Use an equal sign (=) to separate each key from its value.
A semicolon is not needed if each key/value is seperated with a new line, as shown above for the -FilterHashtable for ProviderName='WLMS'.
The accepted key/value pairs for the Get-WinEvent FilterHashtable parameter:
|
Key name |
Value data type |
Accepts wildcard characters? |
|---|---|---|
|
LogName |
|
Yes |
|
ProviderName |
|
Yes |
|
Path |
|
No |
|
Keywords |
|
No |
|
ID |
|
No |
|
Level |
|
No |
|
StartTime |
|
No |
|
EndTime |
|
No |
|
UserID |
|
No |
|
Data |
|
No |
|
|
|
No |
Microsoft recommends making the hash table one key-value pair at a time when building a query. Event viewer can provide information on what is needed to build the hash table.

Using the information above, create a hash table:
Get-WinEvent —FilterHashtable @{
An example of a Git-WinEvent and FilterHashtable command/syntax:
Get-WinEvent —FilterHashtable @{LogName=‘Microsoft-Windows-PowerShell/Operational’; ID=4104} | Select-Object —Property Message | Select-String —Pattern ‘SecureString’
More about creating hash tables can be found
here
.
Answer the following questions using the
online
help documentation for Get-WinEvent
Execute the command from Example 1 (as is). What are the names of the logs related to OpenSSH?

OpenSSH/Admin,OpenSSH/Operational
Execute the command from Example 8. Instead of the string Policy search for PowerShell. What is the name of the 3rd log provider?

Microsoft-Windows-Powershell-DesiredStateConfiguration-FileDownloadManager
Execute the command from Example 9. Use Microsoft-Windows-PowerShell as the log provider. How many event ids are displayed for this event provider?

192 — Omit the first Line

How do you specify the number of events to display?
When using the FilterHashtable parameter and filtering by level, what is the value for Informational?

XPath (XML Path Language) provides standard syntax and semantics for addressing parts of an XML document and manipulating strings, numbers, and booleans. The Windows Event Log supports a subset of
XPath 1.0
.
Below is an example XPath query along with its explanation:
// The following query selects all events from the channel or log file where the severity level is less than or equal to 3 and the event occurred in the last 24 hour period.
XPath Query: *[System[(Level <= 3) and TimeCreated[timediff(@SystemTime) <= 86400000]]]
XPath event query starts with ‘*‘ or ‘Event‘.
Both wevtutil and Get-WinEvent support XPath queries as event filters.

Click on the Details tab and select the XML View radio button to understand how to use the XML View to construct a valid XPath query.

The first tag is the starting point. This can either be an * or the word Event.
The command so far looks like this: Get-WinEvent -LogName Application -FilterXPath '*'

Add that to the command: Get-WinEvent -LogName Application -FilterXPath '*/System/'
Note: Its best practice to explicitly use the keyword System but can use an * instead as with the Event keyword. The query -FilterXPath '*/*' is still valid.
The Event ID is 100. Plug that into the command.

The command now is: Get-WinEvent -LogName Application -FilterXPath '*/System/EventID=100'

When using wevtutil.exe and XPath to query for the same event log and ID, this is the result:

Two additional parameters were used in the above command to retrieve one event and for it not to contain any XML tags.
to query a different element, such as Provider Name, the syntax will be different. To filter on the provider, use the Name attribute of Provider

In the syntax above, the Provider Name is WLMS, and there are two Event IDs. Below will only query for events with Event ID 101:

Create XPath queries for elements within EventData.
The EventData element doesn’t always contain information.
Below is the XML View of the event for which we will build our XPath query.

Build the query for TargetUserName. In this case, that will be System. The XPath query would be:

The -MaxEvents parameter was used, and it was set to 1 to return one event.
Using Get-WinEvent and XPath, what is the query to find WLMS events with a System Time of 2020-12-15T01:09:08.940277500Z?
Get-Event -LogName Application -FilterXPath '*/System/Provider[@Name="WLMS"] and */System/TimeCreated[@SystemTime="2020-12-15T01:09:08.940277500Z"]'
Using Get-WinEvent and XPath, what is the query to find a user named Sam with an Logon Event ID of 4720?

Get-WinEvent -LogName Security -FilterXPath '*/EventData/Data[@Name="TargetUserName"]="Sam" and */System/EventID=4720'
Based on the previous query, how many results are returned?
Based on the output from the question #2, what is Message?
A user account was created
Still working with Sam as the user, what time was Event ID 4724 recorded? (MM/DD/YYYY H:MM:SS [AM/PM])

What is the Provider Name?
Microsoft-Windows-Security-Auditing
Some events will not be generated by default, and certain features will need to be enabled/configured on the endpoint, such as PowerShell logging. This feature can be enabled via Group Policy or the Registry.
Local Computer Policy > Computer Configuration > Administrative Templates > Windows Components > Windows PowerShell

Local Group Policy Editor
Some resources to provide more information about enabling this feature, along with its associated event IDs:
Another feature to enable/configure is Audit Process Creation, which will generate event ID 4688. This will allow command-line process auditing.
Local Computer Policy > Computer Configuration > Administrative Templates > System > Audit Process Creation

Putting Theory Into Practice
Putting Theory Into Practice
The next scenarios/questions are based on the external event log file titled merged.evtx found on the Desktop.
Scenario 1 (Questions 1 & 2): The server admins have made numerous complaints to Management regarding PowerShell being blocked in the environment. Management finally approved the usage of PowerShell within the environment. Visibility is now needed to ensure there are no gaps in coverage. You researched this topic: what logs to look at, what event IDs to monitor, etc. You enabled PowerShell logging on a test machine and had a colleague execute various commands.
What event ID is to detect a PowerShell downgrade attack?

What is the Date and Time this attack took place? (MM/DD/YYYY H:MM:SS [AM/PM])


Scenario 2 (Questions 3 & 4): The Security Team is using Event Logs more. They want to ensure they can monitor if event logs are cleared. You assigned a colleague to execute this action.
A Log clear event was recorded. What is the ‘Event Record ID’?


What is the name of the computer?

Scenario 3 (Questions 5, 6 & 7): The threat intel team shared its research on Emotet. They advised searching for event ID 4104 and the text «ScriptBlockText» within the EventData element. Find the encoded PowerShell payload.
What is the name of the first variable within the PowerShell command?

What is the Date and Time this attack took place? (MM/DD/YYYY H:MM:SS [AM/PM])

What is the Execution Process ID?

Scenario 4 (Questions 8 & 9): A report came in that an intern was suspected of running unusual commands on her machine, such as enumerating members of the Administrators group. A senior analyst suggested searching for «C:\Windows\System32\net1.exe«. Confirm the suspicion.
What is the Group Security ID of the group she enumerated?


Windows Event Log is a built-in feature of the Microsoft Windows operating system that records and stores various system, security, and application events that occur on a computer.
These events can include errors, warnings, and information messages. Using this event log, administrators can troubleshoot problems, monitor system health, and track user activity.
The Windows Event Log is organized into three main categories:
System, Application, and Security.
The Application log contains events related to applications and services, whereas the System log includes events associated with system components and drivers. Logon sessions, unsuccessful login attempts, and other security-related incidents are documented in the Security log.
This windows event log entries include detailed information such as the date and time the event occurred, the source of the event, and any relevant error codes.
Windows Event Log Importance

The role of event log monitoring is crucial for system and network engineers because it enables them to stay informed about any problems, illegal activity, network breakdowns, and other key issues that might be arising inside a computer.
It provides complete details about each event, including its origin, username, sensitivity level, and other information. This information can be very helpful in identifying and resolving structural failures, as well as in forecasting upcoming challenges based on data patterns.
Network administrators can effectively discover and handle issues before they become serious by keeping an eye on event logs. This might possibly save a lot of time and effort when investigating and fixing the issue. This can help to guarantee that systems continue to be safe, dependable, and performing at their best.
How to Access Windows Event Log?
#1. Using GUI
Step 1 – Open the Start menu and search for “Event Viewer”.
Step 2 – Click on the Event Viewer application to open it.
Step 3 – In the leftmost panel, you will see a list of event logs. Choose the Windows Logs option and then click the desired log to view.

Step 4 – In the middle panel, you can see a list of events for the selected log. You can use the filter options at the right-hand side of the screen to narrow down the events you are interested in.

Step 5 – To view the details of an event, double-click on it. This will open the Event Properties dialog box, which contains detailed information about the event ID, source, severity level, date and time, user name, computer name, and description.

Step 6 – You can use the menu options and toolbar at the top of the screen to perform various actions such as saving and clearing logs, creating custom views, and filtering events.
#2. Using Command Prompt
You can access the Windows Event Log using the Command Prompt or PowerShell by using the “wevtutil” command. Here are some examples.
- To display all events in the System log
wevtutil qe System- To display the events in the Application log
wevtutil qe ApplicationThe output may look like this.

- To display all events in the Security log
wevtutil qe Security- To display events from a specific source in the System log.
wevtutil qe System /f:text /c:1 /rd:true /q:"*[System[Provider[@Name='source_name']]]" Here you need to replace “source_name” with the name of the event source you want to view.
- To export events from a log to a file
wevtutil epl System C:\Logs\SystemLog.evtx

Replace “System” with the name of the log you want to export, and “C:\Logs\SystemLog.evtx” with the path and filename where you want to save the exported log.
#3. Using Run
You can also access the Windows Event Log using the Run dialog box in Windows. Here’s how:
Step 1 – Press the “Windows key + R” on your keyboard to open the Run dialog box.
Step 2 – Type “eventvwr.msc” in the Run dialog box and press Enter.

Step 3 – The Event Viewer utility will open and display the main console window.

Step 4 – In the left-hand side console window, you can expand the “Windows Logs” folder to see the System, Application, Security, Setup, and other logs.

Step 5 – Click on the log you want to view its contents in the right panel. You can filter and sort the events as well as create custom views & save them for future use.
When to use these Event Logs?
Generally, You can use the Windows Event Log whenever you need to monitor, troubleshoot, or audit events on a Windows system. Here are some specific situations where you might use it.
Monitoring system health
The Windows Event Log can provide valuable information about system errors, warnings, and performance issues which allows you to proactively monitor and maintain the health of your system.
Troubleshooting problems
When you encounter a problem on a Windows system, the Event Log can provide an indication of the cause and help you diagnose the issue. By analyzing event logs, you can easily identify the root cause of a problem and take steps to resolve it.
Auditing and tracking user activity
The Security log in the Event Log can be used to track user logins, logoff, failed logon attempts, and other security-related events, which can help you identify potential security threats and take appropriate action.
Compliance reporting
Many regulatory frameworks such as HIPAA, PCI-DSS, and GDPR require organizations to maintain event logs and provide regular reports. The Windows Event Log can be used to meet these compliance requirements.
How to Read these Event Logs?
It can be a little difficult to read the Windows Event Log at first, but with enough practice and familiarity, it gets simpler to understand the data it provides. Here are some general steps to follow when reading the Windows Event Log.
#1. Open the Event log
The first step is to open the event log. You can access it by using any of the above-mentioned methods.
#2. Navigate to the appropriate log
There are several logs in the Event Viewer, including the Application, System, Security, and Setup logs. Each log contains different types of events. Select the log that contains the events you want to view.
#3. Filter event
You can filter events by severity level, event source, date range, and other criteria. This can help you narrow down the events you are interested in.
#4. View event details
Examine each event carefully to view its details, including the event ID, source, severity level, date & time, user name, computer name, and description. This information can help you identify the cause of the event and take appropriate action.
#5. Use event properties
Many events have additional properties that provide more information about the event.
For example, a security event might have properties such as logon type, logon process, and authentication package. These properties can help you understand the context of the event and its significance.
#5. Analyze patterns
Always try to look for patterns in the events to identify recurring issues or trends. For example, if you see a series of disk errors, it could indicate a problem with the disk hardware or configuration.
Windows Event Severity Levels
The Windows Event Log uses severity levels to categorize events based on their importance or impact on the system. There are five severity levels in the Windows Event Log, listed below from highest to lowest severity:
- Critical: This severity level is reserved for events that indicate a critical system or application failure that requires immediate attention. Examples include system crashes, major hardware failures, and critical application errors.
- Error: It is used for events that indicate a serious problem that requires attention but not necessarily immediate action. Some common examples are application crashes, network connectivity failures, and disk errors.
- Warning: It indicates a potential issue that system administrators should keep an eye on, including low disk space warnings and security policy violations.
- Verbose: It is used for events that provide detailed information about system or application activity, typically for troubleshooting or debugging purposes.
- Information: It shows that everything went smoothly. Almost all logs include information events.
These severity levels allow administrators & system analysts to quickly identify critical issues that require attention and prioritize their response accordingly.
Conclusion ✍️
I hope you found this article helpful in learning about the windows event log and its importance. You may also be interested in learning about the various ways to recover deleted data in Windows 11.