Где скачать и как установить Debugging Tools for Windows
Решение написать данный пост появилось из-за того, что разобраться в том, где скачать Debugging Tools for Windows, не так то просто.
Так как следующую статью планируется написать на тему анализа дампов, то необходимо было облегчить для нашего читателя задачу скачивания и установки необходимого для анализа инструментария. В данном случае это только официальный отладчик Debugging Tools for Windows.
Как скачать и установить отладчик WinDbg?
Отладчик Debugging Tools for Windows содержится в пакете SDK (от англ. software development kit). SDK (от англ. software development kit) — набор средств разработки, который позволяет специалистам по программному обеспечению создавать приложения для определённого пакета программ, программного обеспечения базовых средств разработки, аппаратной платформы, компьютерной системы, игровых консолей, операционных систем и прочих платформ.
Источник: WikipediaПри скачивании пакета можно выбрать только нужный вам софт отцепив всё лишнее.
Скачиваем пакет SDK.
Для каждой версии Windows имеется своя версия пакета SDK. Скачать загрузчик для скачивания пакета SDK Windows 10 можно по этой ссылке. Для остальных версий Windows загрузчик можно скачать на странице архивов Microsoft. Самая старая версия ОС здесь — Windows 7.
Про иные способы скачивания пакета можете почитать на этой странице (если конечно владеете английским языком 🙂 )
Устанавливаем Debugging Tools for Windows из пакета SDK на Windows 10.
Нажав на ссылку Скачать программу установки > вы получите файл загрузчика пакета SDK — winsdksetup.exe.
- Запустите файл загрузчика winsdksetup.exe.
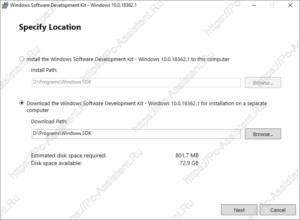
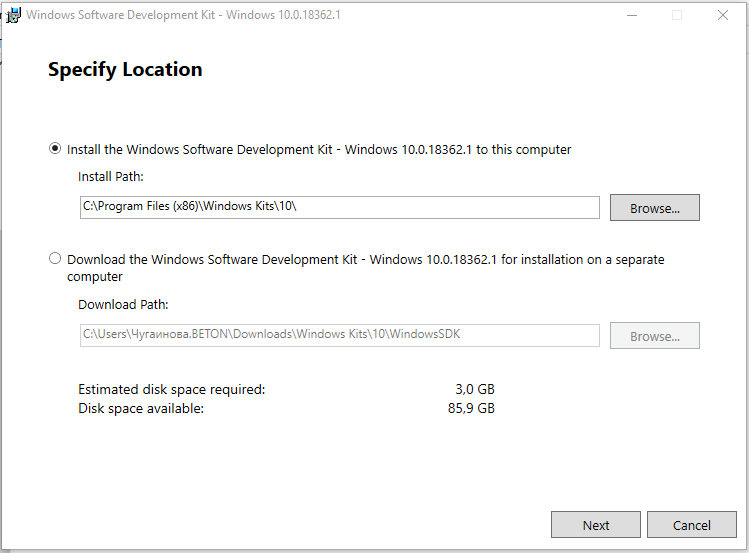
- Загрузчик предложит 2 способа доставки пакета. В первом случае (Install the Windows SDK to this computer — в переводе: Установите Windows SDK на этот компьютер) выбранный софт из пакета SDK сразу устанавливается в систему. Во втором (Download the Windows SDK for installation on a separate computer — в переводе Загрузите Windows SDK для установки на отдельный компьютер) дистрибутивы для установки выбранного софта будут скачаны в указанную вами папку.
 Здесь рекомендую вам выбрать второй вариант, так как скачанный отладчик, можно будет потом установить и на любой другой компьютер. Тут же рекомендую сменить папку куда будет загружен пакет.
 - На следующем шаге вас спросят разрешения отправить анонимную информацию об установке на серверы Microsoft или нет. Здесь выбирать вам
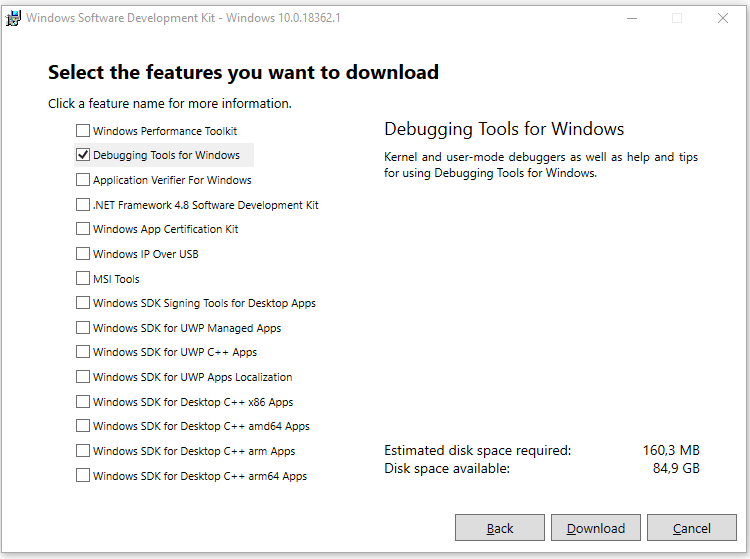
- Далее необходимо выбрать, что вы хотите установить из списка программ. Чтоб не устанавливать лишние программы снимаем все галочки и оставляем только одну Debugging Tools for Windows и жмем кнопку Download.
 Здесь рекомендую вам выбрать второй вариант, так как скачанный отладчик, можно будет потом установить и на любой другой компьютер. Тут же рекомендую сменить папку куда будет загружен пакет.
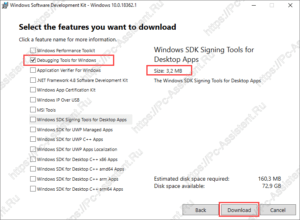
Будет загружена папка Installers, где находим файлы:
► X64 Debuggers And Tools-x86_en-us
► X64 Debuggers And Tools-x64_en-us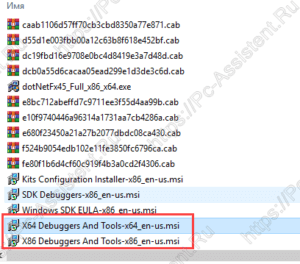
Прежде чем начать установку узнайте разрядность операционной системы и затем уже выберите правильную версию.
Запустив файл установки нужной версии, останется чуток подождать и Debugging Tools for Windows будет установлен. Запустить его можно через кнопку Пуск.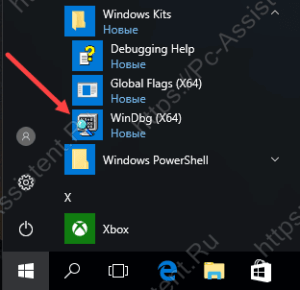
Теперь, когда вы знаете где скачать отладчик, можно смело приступать к анализу файла дампа. Об этом как раз и будет следующая статья на сайте.
Если вам понравилась эта статья, то пожалуйста, оцените её и поделитесь ею со своими друзьями на своей странице в социальной сети.

 (4 оценок, среднее: 4,75 из 5)
![]() Загрузка…
Загрузка…
В момент критического сбоя операционная система Windows прерывает работу и показывает синий экран смерти (BSOD). Содержимое оперативной памяти и вся информация о возникшей ошибке записывается в файл подкачки. При следующей загрузке Windows создается аварийный дамп c отладочной информацией на основе сохраненных данных. В системном журнале событий создается запись о критической ошибке.
Внимание! Аварийный дамп не создается, если отказала дисковая подсистема или критическая ошибка возникла на начальной стадии загрузки Windows.
Содержание:
- Типы аварийных дампов памяти Windows
- Как включить создание дампа памяти в Windows?
- Установка WinDBG в Windows
- Настройка ассоциации .dmp файлов с WinDBG
- Настройка сервера отладочных символов в WinDBG
- Анализ аварийного дампа памяти в WinDBG
Типы аварийных дампов памяти Windows
На примере актуальной операционной системы Windows 10 (Windows Server 2016) рассмотрим основные типы дампов памяти, которые может создавать система:
- Мини дамп памяти (Small memory dump) (256 КБ). Этот тип файла включает минимальный объем информации. Он содержит только сообщение об ошибке BSOD, информацию о драйверах, процессах, которые были активны в момент сбоя, а также какой процесс или поток ядра вызвал сбой.
- Дамп памяти ядра (Kernel memory dump). Как правило, небольшой по размеру — одна треть объема физической памяти. Дамп памяти ядра является более подробным, чем мини дамп. Он содержит информацию о драйверах и программах в режиме ядра, включает память, выделенную ядру Windows и аппаратному уровню абстракции (HAL), а также память, выделенную драйверам и другим программам в режиме ядра.
- Полный дамп памяти (Complete memory dump). Самый большой по объему и требует памяти, равной оперативной памяти вашей системы плюс 1MB, необходимый Windows для создания этого файла.
- Автоматический дамп памяти (Automatic memory dump). Соответствует дампу памяти ядра с точки зрения информации. Отличается только тем, сколько места он использует для создания файла дампа. Этот тип файлов не существовал в Windows 7. Он был добавлен в Windows 8.
- Активный дамп памяти (Active memory dump). Этот тип отсеивает элементы, которые не могут определить причину сбоя системы. Это было добавлено в Windows 10 и особенно полезно, если вы используете виртуальную машину, или если ваша система является хостом Hyper-V.
Как включить создание дампа памяти в Windows?
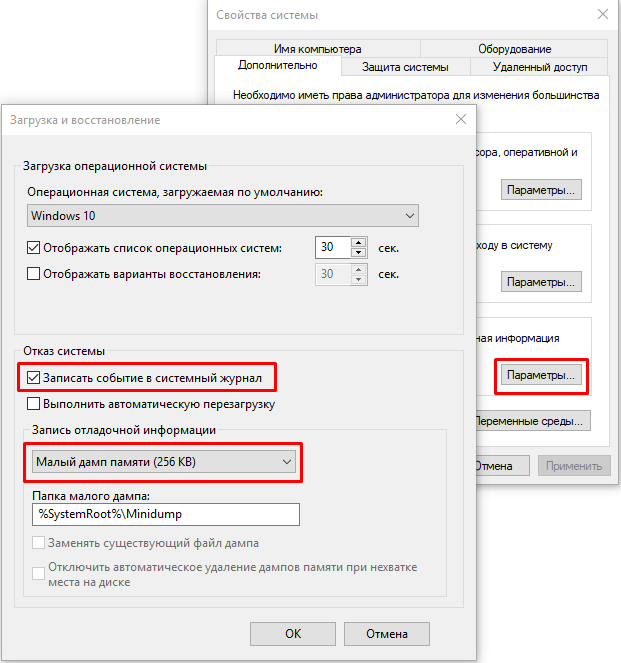
С помощью Win+Pause откройте окно с параметрами системы, выберите «Дополнительные параметры системы» (Advanced system settings). Во вкладке «Дополнительно» (Advanced), раздел «Загрузка и восстановление» (Startup and Recovery) нажмите кнопку «Параметры» (Settings). В открывшемся окне настройте действия при отказе системы. Поставьте галку в чек-боксе «Записать события в системный журнал» (Write an event to the system log), выберите тип дампа, который должен создаваться при сбое системы. Если в чек-боксе «Заменять существующий файл дампа» (Overwrite any existing file) поставить галку, то файл будет перезаписываться при каждом сбое. Лучше эту галку снять, тогда у вас будет больше информации для анализа. Отключите также автоматическую перезагрузку системы (Automatically restart).
В большинстве случаев для анализа причины BSOD вам будет достаточно малого дампа памяти.
Теперь при возникновении BSOD вы сможете проанализировать файл дампа и найти причину сбоев. Мини дамп по умолчанию сохраняется в папке %systemroot%\minidump. Для анализа файла дампа рекомендую воспользоваться программой WinDBG (Microsoft Kernel Debugger).
Установка WinDBG в Windows
Утилита WinDBG входит в «Пакет SDK для Windows 10» (Windows 10 SDK). Скачать можно здесь.
Файл называется winsdksetup.exe, размер 1,3 МБ.
WinDBG для Windows7 и более ранних систем включен в состав пакета «Microsoft Windows SDK for Windows 7 and .NET Framework 4». Скачать можно здесь.
Запустите установку и выберите, что именно нужно сделать – установить пакет на этот компьютер или загрузить для установки на другие компьютеры. Установим пакет на локальный компьютер.
Можете установить весь пакет, но для установки только инструмента отладки выберите Debugging Tools for Windows.
После установки ярлыки WinDBG можно найти в стартовом меню.
Настройка ассоциации .dmp файлов с WinDBG
Для того, чтобы открывать файлы дампов простым кликом, сопоставьте расширение .dmp с утилитой WinDBG.
- Откройте командную строку от имени администратора и выполните команды для 64-разрядной системы:
cd C:\Program Files (x86)\Windows Kits\10\Debuggers\x64
windbg.exe –IA
для 32-разрядной системы:
C:\Program Files (x86)\Windows Kits\10\Debuggers\x86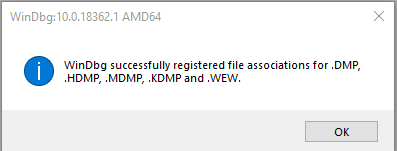
windbg.exe –IA - В результате типы файлов: .DMP, .HDMP, .MDMP, .KDMP, .WEW – будут сопоставлены с WinDBG.
Настройка сервера отладочных символов в WinDBG
Отладочные символы (debug-символы или symbol files) – это блоки данных, генерируемые в процессе компиляции программы совместно с исполняемым файлом. В таких блоках данных содержится информация о именах переменных, вызываемых функциях, библиотеках и т.д. Эти данные не нужны при выполнении программы, но полезные при ее отладке. Компоненты Microsoft компилируются с символами, распространяемыми через Microsoft Symbol Server.
Настройте WinDBG на использование Microsoft Symbol Server:
- Откройте WinDBG;
- Перейдите в меню File –> Symbol File Path;
- Пропишите строку, содержащую URL для загрузки символов отладки с сайта Microsoft и папку для сохранения кэша:
SRV*E:\Sym_WinDBG*http://msdl.microsoft.com/download/symbols
В примере кэш загружается в папку E:\Sym_WinDBG, можете указать любую. - Не забывайте сохранить изменения в меню File –> Save WorkSpace;
WinDBG произведет поиск символов в локальной папке и, если не обнаружит в ней необходимых символов, то самостоятельно загрузит символы с указанного сайта. Если вы хотите добавить собственную папку с символами, то можно сделать это так:
SRV*E:\Sym_WinDBG*http://msdl.microsoft.com/download/symbols;c:\Symbols
Если подключение к интернету отсутствует, то загрузите предварительно пакет символов с ресурса Windows Symbol Packages.
Анализ аварийного дампа памяти в WinDBG
Отладчик WinDBG открывает файл дампа и загружает необходимые символы для отладки из локальной папки или из интернета. Во время этого процесса вы не можете использовать WinDBG. Внизу окна (в командной строке отладчика) появляется надпись Debugee not connected.
Команды вводятся в командную строку, расположенную внизу окна.
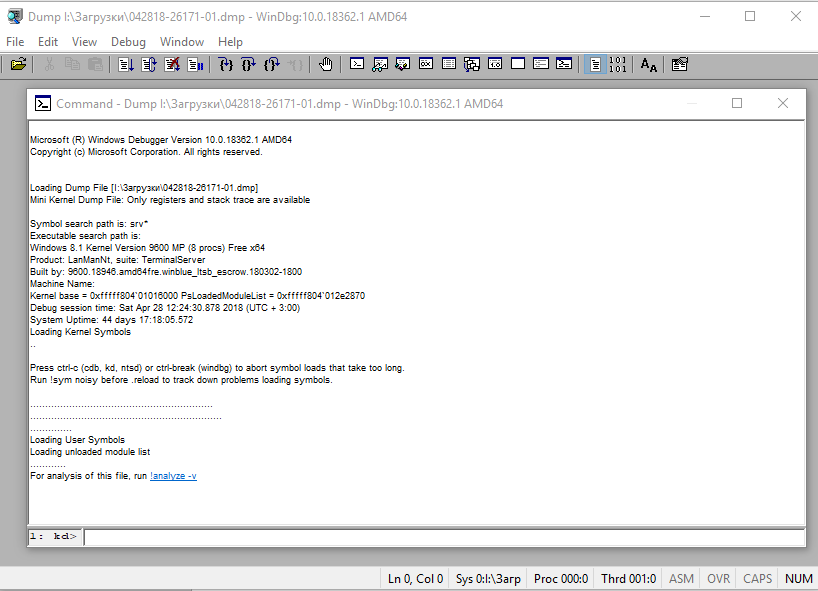
Самое главное, на что нужно обратить внимание – это код ошибки, который всегда указывается в шестнадцатеричном значении и имеет вид 0xXXXXXXXX (указываются в одном из вариантов — STOP: 0x0000007B, 02.07.2019 0008F, 0x8F). В нашем примере код ошибки 0х139.
Полный справочник ошибок можно посмотреть здесь.
Отладчик предлагает выполнить команду !analyze -v, достаточно навести указатель мыши на ссылку и кликнуть. Для чего нужна эта команда?
- Она выполняет предварительный анализ дампа памяти и предоставляет подробную информацию для начала анализа.
- Эта команда отобразит STOP-код и символическое имя ошибки.
- Она показывает стек вызовов команд, которые привели к аварийному завершению.
- Кроме того, здесь отображаются неисправности IP-адреса, процессов и регистров.
- Команда может предоставить готовые рекомендации по решению проблемы.
Основные моменты, на которые вы должны обратить внимание при анализе после выполнения команды !analyze –v (листинг неполный).
1: kd>
!analyze -v
*****************************************************************************
* *
* Bugcheck Analysis *
* *
*****************************************************************************
Символическое имя STOP-ошибки (BugCheck)
KERNEL_SECURITY_CHECK_FAILURE (139)
Описание ошибки (Компонент ядра повредил критическую структуру данных. Это повреждение потенциально может позволить злоумышленнику получить контроль над этой машиной):
A kernel component has corrupted a critical data structure. The corruption could potentially allow a malicious user to gain control of this machine.
Аргументы ошибки:
Arguments:
Arg1: 0000000000000003, A LIST_ENTRY has been corrupted (i.e. double remove).
Arg2: ffffd0003a20d5d0, Address of the trap frame for the exception that caused the bugcheck
Arg3: ffffd0003a20d528, Address of the exception record for the exception that caused the bugcheck
Arg4: 0000000000000000, Reserved
Debugging Details:
------------------
Счетчик показывает сколько раз система упала с аналогичной ошибкой:
CUSTOMER_CRASH_COUNT: 1
Основная категория текущего сбоя:
DEFAULT_BUCKET_ID: FAIL_FAST_CORRUPT_LIST_ENTRY
Код STOP-ошибки в сокращенном формате:
BUGCHECK_STR: 0x139
Процесс, во время исполнения которого произошел сбой (не обязательно причина ошибки, просто в момент сбоя в памяти выполнялся этот процесс):
PROCESS_NAME: sqlservr.exe
CURRENT_IRQL: 2
Расшифровка кода ошибки: В этом приложении система обнаружила переполнение буфера стека, что может позволить злоумышленнику получить контроль над этим приложением.
ERROR_CODE: (NTSTATUS) 0xc0000409 - The system detected an overrun of a stack-based buffer in this application. This overrun could potentially allow a malicious user to gain control of this application.
EXCEPTION_CODE: (NTSTATUS) 0xc0000409 - The system detected an overrun of a stack-based buffer in this application. This overrun could potentially allow a malicious user to gain control of this application.
Последний вызов в стеке:
LAST_CONTROL_TRANSFER: from fffff8040117d6a9 to fffff8040116b0a0
Стек вызовов в момент сбоя:
STACK_TEXT:
ffffd000`3a20d2a8 fffff804`0117d6a9 : 00000000`00000139 00000000`00000003 ffffd000`3a20d5d0 ffffd000`3a20d528 : nt!KeBugCheckEx
ffffd000`3a20d2b0 fffff804`0117da50 : ffffe000`f3ab9080 ffffe000`fc37e001 ffffd000`3a20d5d0 fffff804`0116e2a2 : nt!KiBugCheckDispatch+0x69
ffffd000`3a20d3f0 fffff804`0117c150 : 00000000`00000000 00000000`00000000 00000000`00000000 00000000`00000000 : nt!KiFastFailDispatch+0xd0
ffffd000`3a20d5d0 fffff804`01199482 : ffffc000`701ba270 ffffc000`00000001 000000ea`73f68040 fffff804`000006f9 : nt!KiRaiseSecurityCheckFailure+0x3d0
ffffd000`3a20d760 fffff804`014a455d : 00000000`00000001 ffffd000`3a20d941 ffffe000`fcacb000 ffffd000`3a20d951 : nt! ?? ::FNODOBFM::`string'+0x17252
ffffd000`3a20d8c0 fffff804`013a34ac : 00000000`00000004 00000000`00000000 ffffd000`3a20d9d8 ffffe001`0a34c600 : nt!IopSynchronousServiceTail+0x379
ffffd000`3a20d990 fffff804`0117d313 : ffffffff`fffffffe 00000000`00000000 00000000`00000000 000000eb`a0cf1380 : nt!NtWriteFile+0x694
ffffd000`3a20da90 00007ffb`475307da : 00000000`00000000 00000000`00000000 00000000`00000000 00000000`00000000 : nt!KiSystemServiceCopyEnd+0x13
000000ee`f25ed2b8 00000000`00000000 : 00000000`00000000 00000000`00000000 00000000`00000000 00000000`00000000 : 0x00007ffb`475307da
Участок кода, где возникла ошибка:
FOLLOWUP_IP:
nt!KiFastFailDispatch+d0
fffff804`0117da50 c644242000 mov byte ptr [rsp+20h],0
FAULT_INSTR_CODE: 202444c6
SYMBOL_STACK_INDEX: 2
SYMBOL_NAME: nt!KiFastFailDispatch+d0
FOLLOWUP_NAME: MachineOwner
Имя модуля в таблице объектов ядра. Если анализатору удалось обнаружить проблемный драйвер, имя отображается в полях MODULE_NAME и IMAGE_NAME:
MODULE_NAME: nt
IMAGE_NAME: ntkrnlmp.exe
Если кликнете по ссылке модуля (nt), то увидите подробную информацию о пути и других свойствах модуля. Находите указанный файл, и изучаете его свойства.
1: kd>
lmvm nt
Browse full module list
Loaded symbol image file: ntkrnlmp.exe
Mapped memory image file: C:\ProgramData\dbg\sym\ntoskrnl.exe\5A9A2147787000\ntoskrnl.exe
Image path: ntkrnlmp.exe
Image name: ntkrnlmp.exe
InternalName: ntkrnlmp.exe
OriginalFilename: ntkrnlmp.exe
ProductVersion: 6.3.9600.18946
FileVersion: 6.3.9600.18946 (winblue_ltsb_escrow.180302-1800)
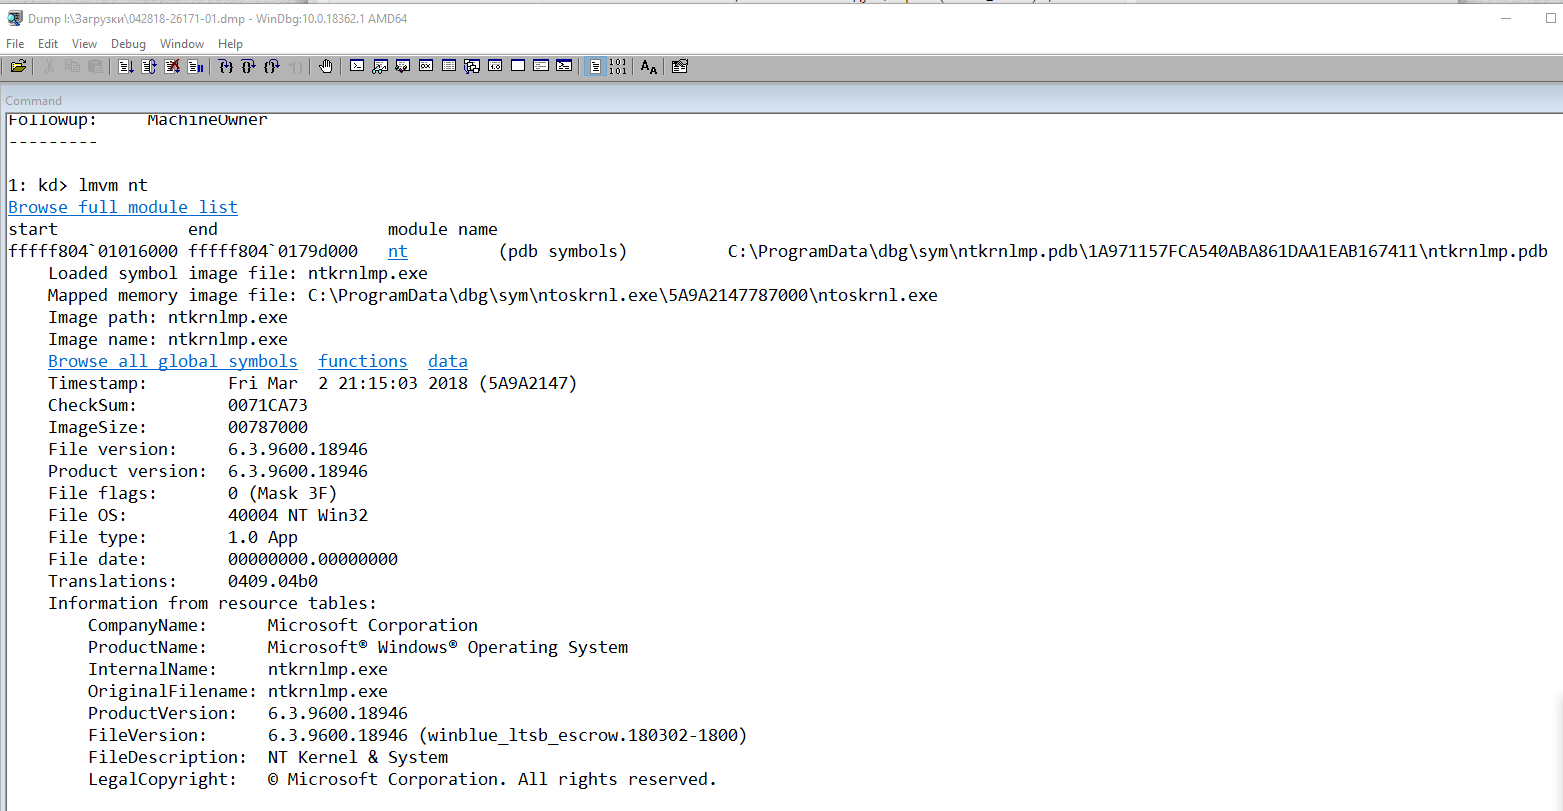
В приведенном примере анализ указал на файл ядра ntkrnlmp.exe. Когда анализ дампа памяти указывает на системный драйвер (например, win32k.sys) или файл ядра (как в нашем примере ntkrnlmp.exe), вероятнее всего данный файл не является причиной проблемы. Очень часто оказывается, что проблема кроется в драйвере устройства, настройках BIOS или в неисправности оборудования.
Если вы увидели, что BSOD возник из-за стороннего драйвера, его имя будет указано в значениях MODULE_NAME и IMAGE_NAME.
Например:
Image path: \SystemRoot\system32\drivers\cmudaxp.sys
Image name: cmudaxp.sys
Откройте свойсва файла драйвера и проверьте его версию. В большинстве случаев проблема с драйверами решается их обнвовлением.
Here is a list of the 9 best Debugging software that can help you find and fix the common PC errors, bugs, or defects.
Bugs or errors in a software code can abruptly crash the program. Hence, to prevent unexpected crashes or faulty operation of a software or system, debugging is used. Debugging is a process of identifying and resolving the errors, defects, or bugs in a software code. It helps you manage and deeply explore the overall operational setup of your system or the third-party software installed on your PC. When numerous modules or subsystems are firmly correlated, debugging becomes tougher as any alteration in one subsystem or module may lead to more bugs. Here comes debuggers or debugging software to help you out.
Utilizing the best debugging software, one can easily debug Windows applications (in user mode), complete operating system (in Kernel mode), and drivers.
Fortunately, there are various debugging software available for Windows PC. Keeping all the factors in mind, this comprehensive guide helps you choose the best debugging tool for your Windows PC.
A List of 9 Best Debugging Tools for Windows 10, 11 You Can Try in 2023
In this section, we have put together the 8 best debugging tools for Windows 10, 11 PC. Choose the best one for yourself!
1. Immunity Debugger

Lives up to its name, Immunity Debugger is a robust way to analyze malware and rebound engineer binary files. It possesses a super-easy user interface, designed with direct heap analysis methodologies and tools. This debugger utilizes an excellent scripting language in order to automate the complete intelligent debugging process. Furthermore, the debugger can cut exploit development time by up to 50%. Undoubtedly, it is one of the promising debugging tools for Windows PC that lets you run rapid debugging in order to stop corruption during complicated analysis. The icing on the cake is, you can download it for free.
Download Now
Also See: MSVCR100.dll Missing or Not Found on Windows PC [FIXED]
2. Syser Debugger

Another best debugging software for Windows PC is Syser Debugger, a 100% free debugging tool. This debugger is a 32-bit X86 kernel-level program. It has the potential to trace all Windows operating system instructions at any end in time. This debugging utility is compatible with C/C++ source code debugging (PDF format) and color disassembly. Furthermore, Syser also works as a driver developer for Windows. It is enough capable of running multiple virtual engines like VMWare and more without any hindrances.
Download Now
3. Zend Studio Debugger

Next on our list of best debugging tools in 2023, Zen Studio Debugger. It is an intelligent tool that helps you to thoroughly analyze codes and offers numerous features that help developers code hassle-free. Its advanced editing saves enough time through its impressive code assist. This debugger for Windows is prepared with highly advanced functionalities that allow the PHP applications deployment on any server. Using this debugger, you can also enjoy utilities like GitFlow, Docker, and Eclipse plugins.
Download Now
4. Visual Studio Debugger

It is another powerful software that provides a set of project design and debugging tools in order to make your bugs recognize and resolve related issues, easily & quickly. This debugger utility is the best way to find bugs or errors in your software code with the help of its deep code analysis, unit tests, and distinct design output processes. Furthermore, Visual Studio lets the developer write code in multiple languages. Also, based on your personal preference, you can alter the interface.
5. WinDbg

WinDbg, a complete free debugging tool for Windows PC. It is a multipurpose utility tool that is designed with all the tools needed for debugging the drivers, overall operating system, and user-mode apps. WinDbg is developed and designed by Microsoft, which needs two interconnected PCs to function at its full capacity. Using this debugging software, one can easily & quickly find and resolve any sort of bugs, defects, or errors.
Also See: How to Fix the ‘A JavaScript Error Occurred in the Main Process
6. OllyDbg

It is a lightweight debugging tool that makes the entire process of debugging a software code much easier & quicker by automating every function. Based on reverse engineering techniques this software cracks entire systems and third-party installed applications on PCs. OllyDbg is a well-known software for DLLs debugging, file scanning, software, cracking, code analysis, malware & virus analysis, and many more. It is completely free software that automatically indicates the content of registers, recognizes procedures, tables, constants, API calls, tracks routines from object libraries & files, and strings.
Download Now
7. IDA Pro

IDA Pro is an exceptional multi-processor debugger utility tool available for Windows, Linux, and Mac operating systems. This debugging program helps the developers to detect and correct the general errors or bugs in any program. It has the ability to debug a comprehensive array of particular platforms incorporating iOS and Android. One of the best things about utilizing the IDA Pro debugger is its capacity to carry out both remote and local operations.
Download Now
8. GNU Debugger

Last but not least, GNU Debugger is a globally recognized utility tool that allows you to discover what’s exactly going on within the programs at the time of execution. GNU Project Debugger provides useful tools to detect what happened inside the program that made it unexpectedly crash. The most exciting feature is, it’s a portable debugging software that can be run smoothly on various Unix-like systems. In addition to this, it also works fine with all major famous programming languages including Free Pascal, Fortran, Go C, C++, and many more. It is undoubtedly the best portable debugging tool that you can consider.
Download Now
9. ReSharper

Last but not least, ReShaper is a popular debugging tool and is also used as an extension to VS (Visual Studio). Individual .NET developers and teams both can rely on ReShaper in order to write and manage code. It also comes with a robust unit test runner and provides full support for distinct code templates. Apart from that, ReShaper also provides hundreds of simple and quick fixes to eradicate errors automatically and improve the code. More than 60 refactorings and 450+ context help securely organize code and move it around the solution. In sum, this debugging tool has everything you need to create a code, so you can give it a try.
Download Now
Also See: How to Fix Critical Structure Corruption Error in Windows 10
Which is the Best Debugging Tool for Windows PC?
So, these were a few of the best debugging software available for Windows PC. The aforementioned tools make your remote and local debugging experience absolutely hassle-free.
In our opinion, you should try Immunity Debugger for a way better debugging experience. Do you have any better suggestions or an alternative? Then, let us know through the comments section below.
Lastly, do subscribe to our Newsletter for more tech-related articles or updates. In addition to this, follow us on Facebook, Twitter, Instagram, and Pinterest.
Best Debugging Software or Debuggers are dedicated programs that help developers to identify & resolve common PC errors (bugs or defects). It can be a software-specific issue which is affecting a particular program, or it can hamper the entire operating system’s performance.
Using a dedicated debugging tool, you can deeply explore the operational setup of a system or a third-party utility installed on PC. With a standard debugger software, you can easily debug drivers and other Windows Apps (In User Mode) or the entire Operating System (In Kernel Mode).
Keeping all the aspects in mind, thankfully, there are a few excellent debugging tools for Windows 10 that are easy to use and proffers all the needed tools and options required for professional debugging.
Best Bunch of Debugging Tools For Windows 10
Hope you find our list of Debugging Program Software useful in the perennial quest to seek bugs in programs, codes, and third-party apps.
1. WinDbg
Price = Free Debugging Tool
Windows Debugger or WinDbg is a multipurpose solution, equipped with all the tools required for debugging user-mode applications, drivers, and the entire operating system (in Kernel Mode). Designed & developed by Microsoft, WinDbg requires two interlinked computers to function at maximum capacity. Using this debugging tool for Windows, you can easily fix almost any type of bug attack, analyze crash dumps & examine processor registers.


2. OllyDbg
Price = Free Debugger Tool
OllyDbg is a lightweight developer tool that automatically predicts the contents of registers, identifies procedures, API calls, tables, constants, strings, switches and locates routines from object files & libraries. The software is based on a reverse engineering technique to crack systems and installed apps on computer systems. The debugger software is best known for malware analysis, DLLs debugging, file scanning, software cracking, code analysis, and more.

3. IDA Pro
Price= Starts at 589 USD
IDA Pro is an ultimate multi-processor disassembler & debugger software available for Windows, Mac, and Linux operating systems. This debugging software helps in the detection and correction of common errors in programs. It holds strong potential to debug a wide array of specific platforms, including Android and iOS. The best thing about using IDA Pro is its ability to be carried out both locally and remotely.

4. Visual Studio Debugger
Price = Best Free Debugging Tool
Visual Studio is a powerful debugging software that proffers a complete set of project build and debugging tools to make your bugs identification & fixing problem hassle-free. The debugger utility works best to find defects in your code using code analysis, unit tests, and other build output processes. Additionally, Visual Studio provides the ability to write in more than one programming language. You can also modify the interface based on personal preference.

5. Syser Debugger
Price = Free Debugging Tool For Windows
Next on our list of Best Debugging Software for Windows is Syser. It is a 32Bit X86 kernel-level debugging utility, capable of tracing all Windows OS instructions at any point in time. The debugger software supports color disassembly and (C/C++) source code debugging (VC PDF format). Additionally, Syser serves as a driver developer for Windows PCs as well. Syser Debugger holds strong potential to run virtual engines such as VMWare without many hassles.

6. GNU Debugger
Price = Not Mentioned On The Site
It is one of the most popular GNU Project Debugger that lets users explore what’s precisely going inside the programs while it executes. It offers all the essential tools to identify what was happening in the program while it crashed suddenly. It’s a portable debugging tool that runs smoothly on several Unix-like systems and works brilliantly with popular programming languages such as C, C++, Free Pascal, Fortran, Go, and more.

7. Immunity Debugger
Price = Free To Download Debugging Software
Next on our list is Immunity Debugger, an excellent debugging tool to write exploits, explore malware, and reverse engineer binary files. It proffers an excellent user interface, built with leading heap analysis techniques & tools. Immunity Debugger uses a powerful scripting language for automating the intelligent debugging process. It has the potential to cut exploit development time by almost 50%. It is undoubtedly one of the best debugging tools for Windows 10 that performs fast debugging to prevent corruption during complex analysis.

8. Zend Studio Debugger
Price = $89/Year
Last but not least in consideration, Zend Studio Debugger proves to an intelligent debugging tool that helps to analyze codes and provides features that help developers code without any hassles. Its intelligent code editing saves a lot of time with its intuitive code assist. The debugging software for Windows is equipped with advanced capabilities that permit the deployment of PHP apps on any server. Additionally, you can enjoy tools like Docker, GitFlow, and Eclipse plugins with the Zend Studio Debugger tool.

Hopefully, our list of Best Debugging Software for Windows makes your local & remote debugging experience completely hassle-free. If you have any suggestions or a better alternative that can be added to this Top 8 Debuggers, then do let us know in the comments section below!
by Radu Tyrsina
Radu Tyrsina has been a Windows fan ever since he got his first PC, a Pentium III (a monster at that time). For most of the kids of… read more
Updated on

XINSTALL BY CLICKING THE DOWNLOAD
FILE
The Debugging Tools are essential for Windows 10 and Windows 8.1 developers that are looking to create apps and submit them to the Windows Store, free of serious bugs and glitches. Here’s more about it and where to download.

Debugging in Windows 10 / 8.1, just like with any other operating system, means to find and reduce the number of bugs and defects, to make the app behave as expected. For that, developers have at their disposal the Debugging Tools set.
With the launch of the Windows 8.1 SDK, the Debugging Tools has been made part of it, as this was one of the new features and updates brought by Microsoft.
However, if you’re interested only in the Debugging Tools for Windows 8.1, when installing the Windows 8.1 SDK, you can select only the box for Debugging Tools, leaving others unchecked. As far as we know, this is the single way to install the standalone Debugging Tools for Windows 8.1 component, as there are currently no individual download links for that.
What you can download, though, as a standalone file is the Windows Remote Debugging Client for Windows 8.1. You can use it to work remotely with developers from Microsoft by using the Kernel Debugger (KD).
Follow the links from below to download the Windows 8.1 SDK where you’ll need to check only the Debugging Tools for Windows 8.1, if you need that, and the Windows Remote Debugging Client for Windows 8.1.
- Download Debugging Tools for Windows 8.1 included in Windows 8.1 SDK
- Download Windows Remote Debugging Client for Windows 8.1
Debugging tools for Windows 10 (WindDbg)
Analyzing crash dumps, examining the CPU registers as code executes, debugging kernel and user mode code, all have been made possible with the Windows Debugger (WinDbg) for Windows 10 developers.
A new version of WinDbg was released in 2017 for Windows 10 developers and came with more modern visuals, faster windows, a full-fledged scripting experience, built with the extensible debugger data model front and center.
Read more about WinDbg Preview and find out the new features and updates.
- Download WinDbg Preview from Microsoft Store
- Get Debugging Tools for Windows 10 (from SDK)
![]()