In this tutorial, you configure Visual Studio Code to use the Microsoft Visual C++ compiler and debugger on Windows.
After configuring VS Code, you will compile and debug a simple Hello World program in VS Code. This tutorial does not teach you details about the Microsoft C++ toolset or the C++ language. For those subjects, there are many good resources available on the Web.
If you have any problems, feel free to file an issue for this tutorial in the VS Code documentation repository.
Prerequisites
To successfully complete this tutorial, you must do the following:
-
Install Visual Studio Code.
-
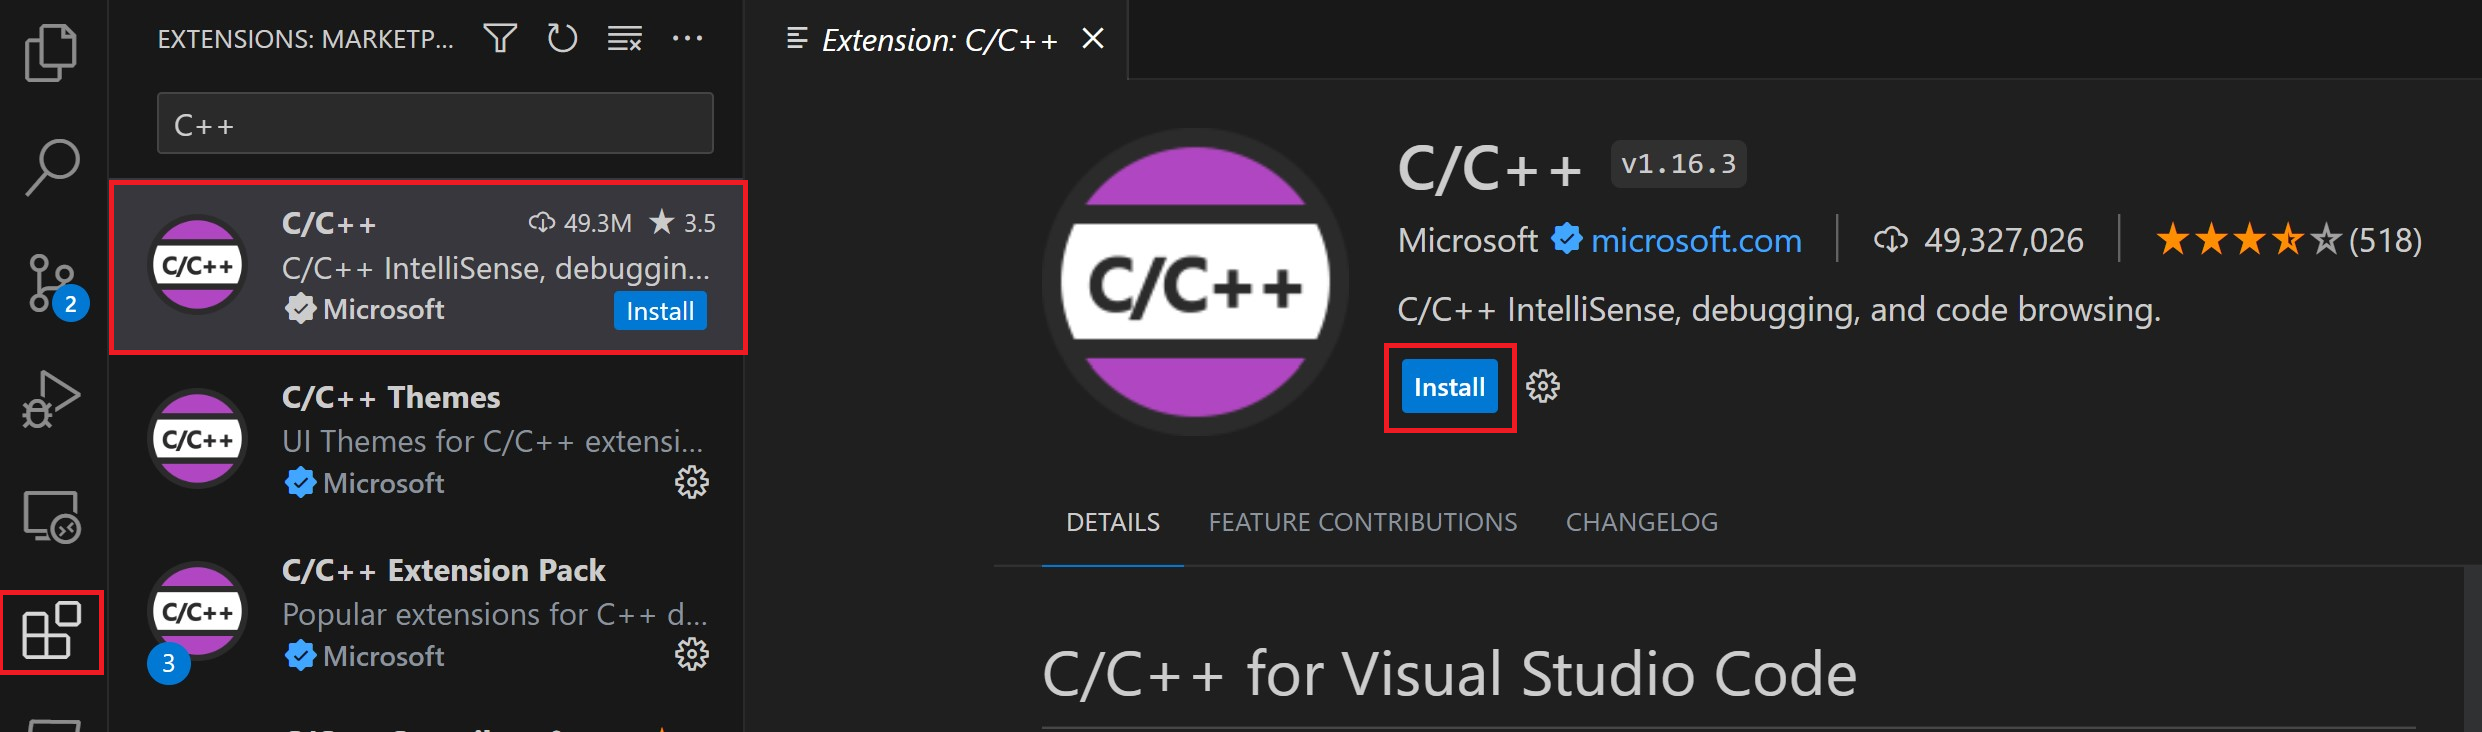
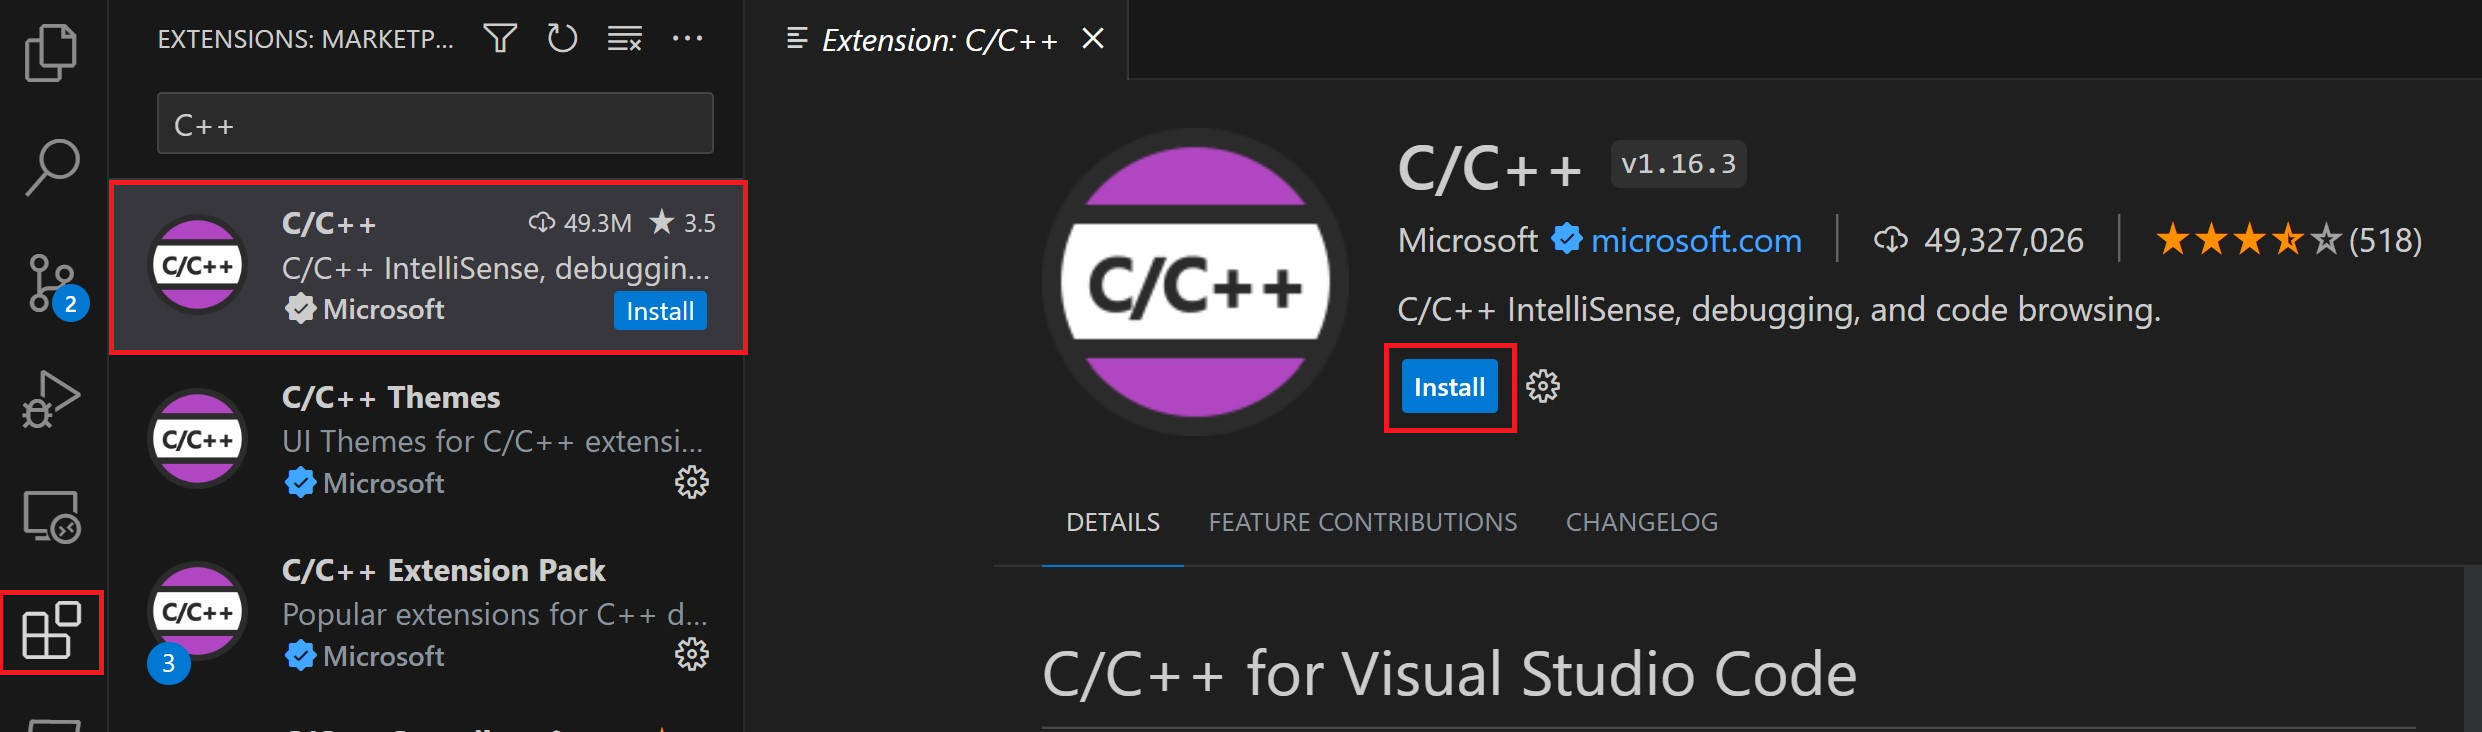
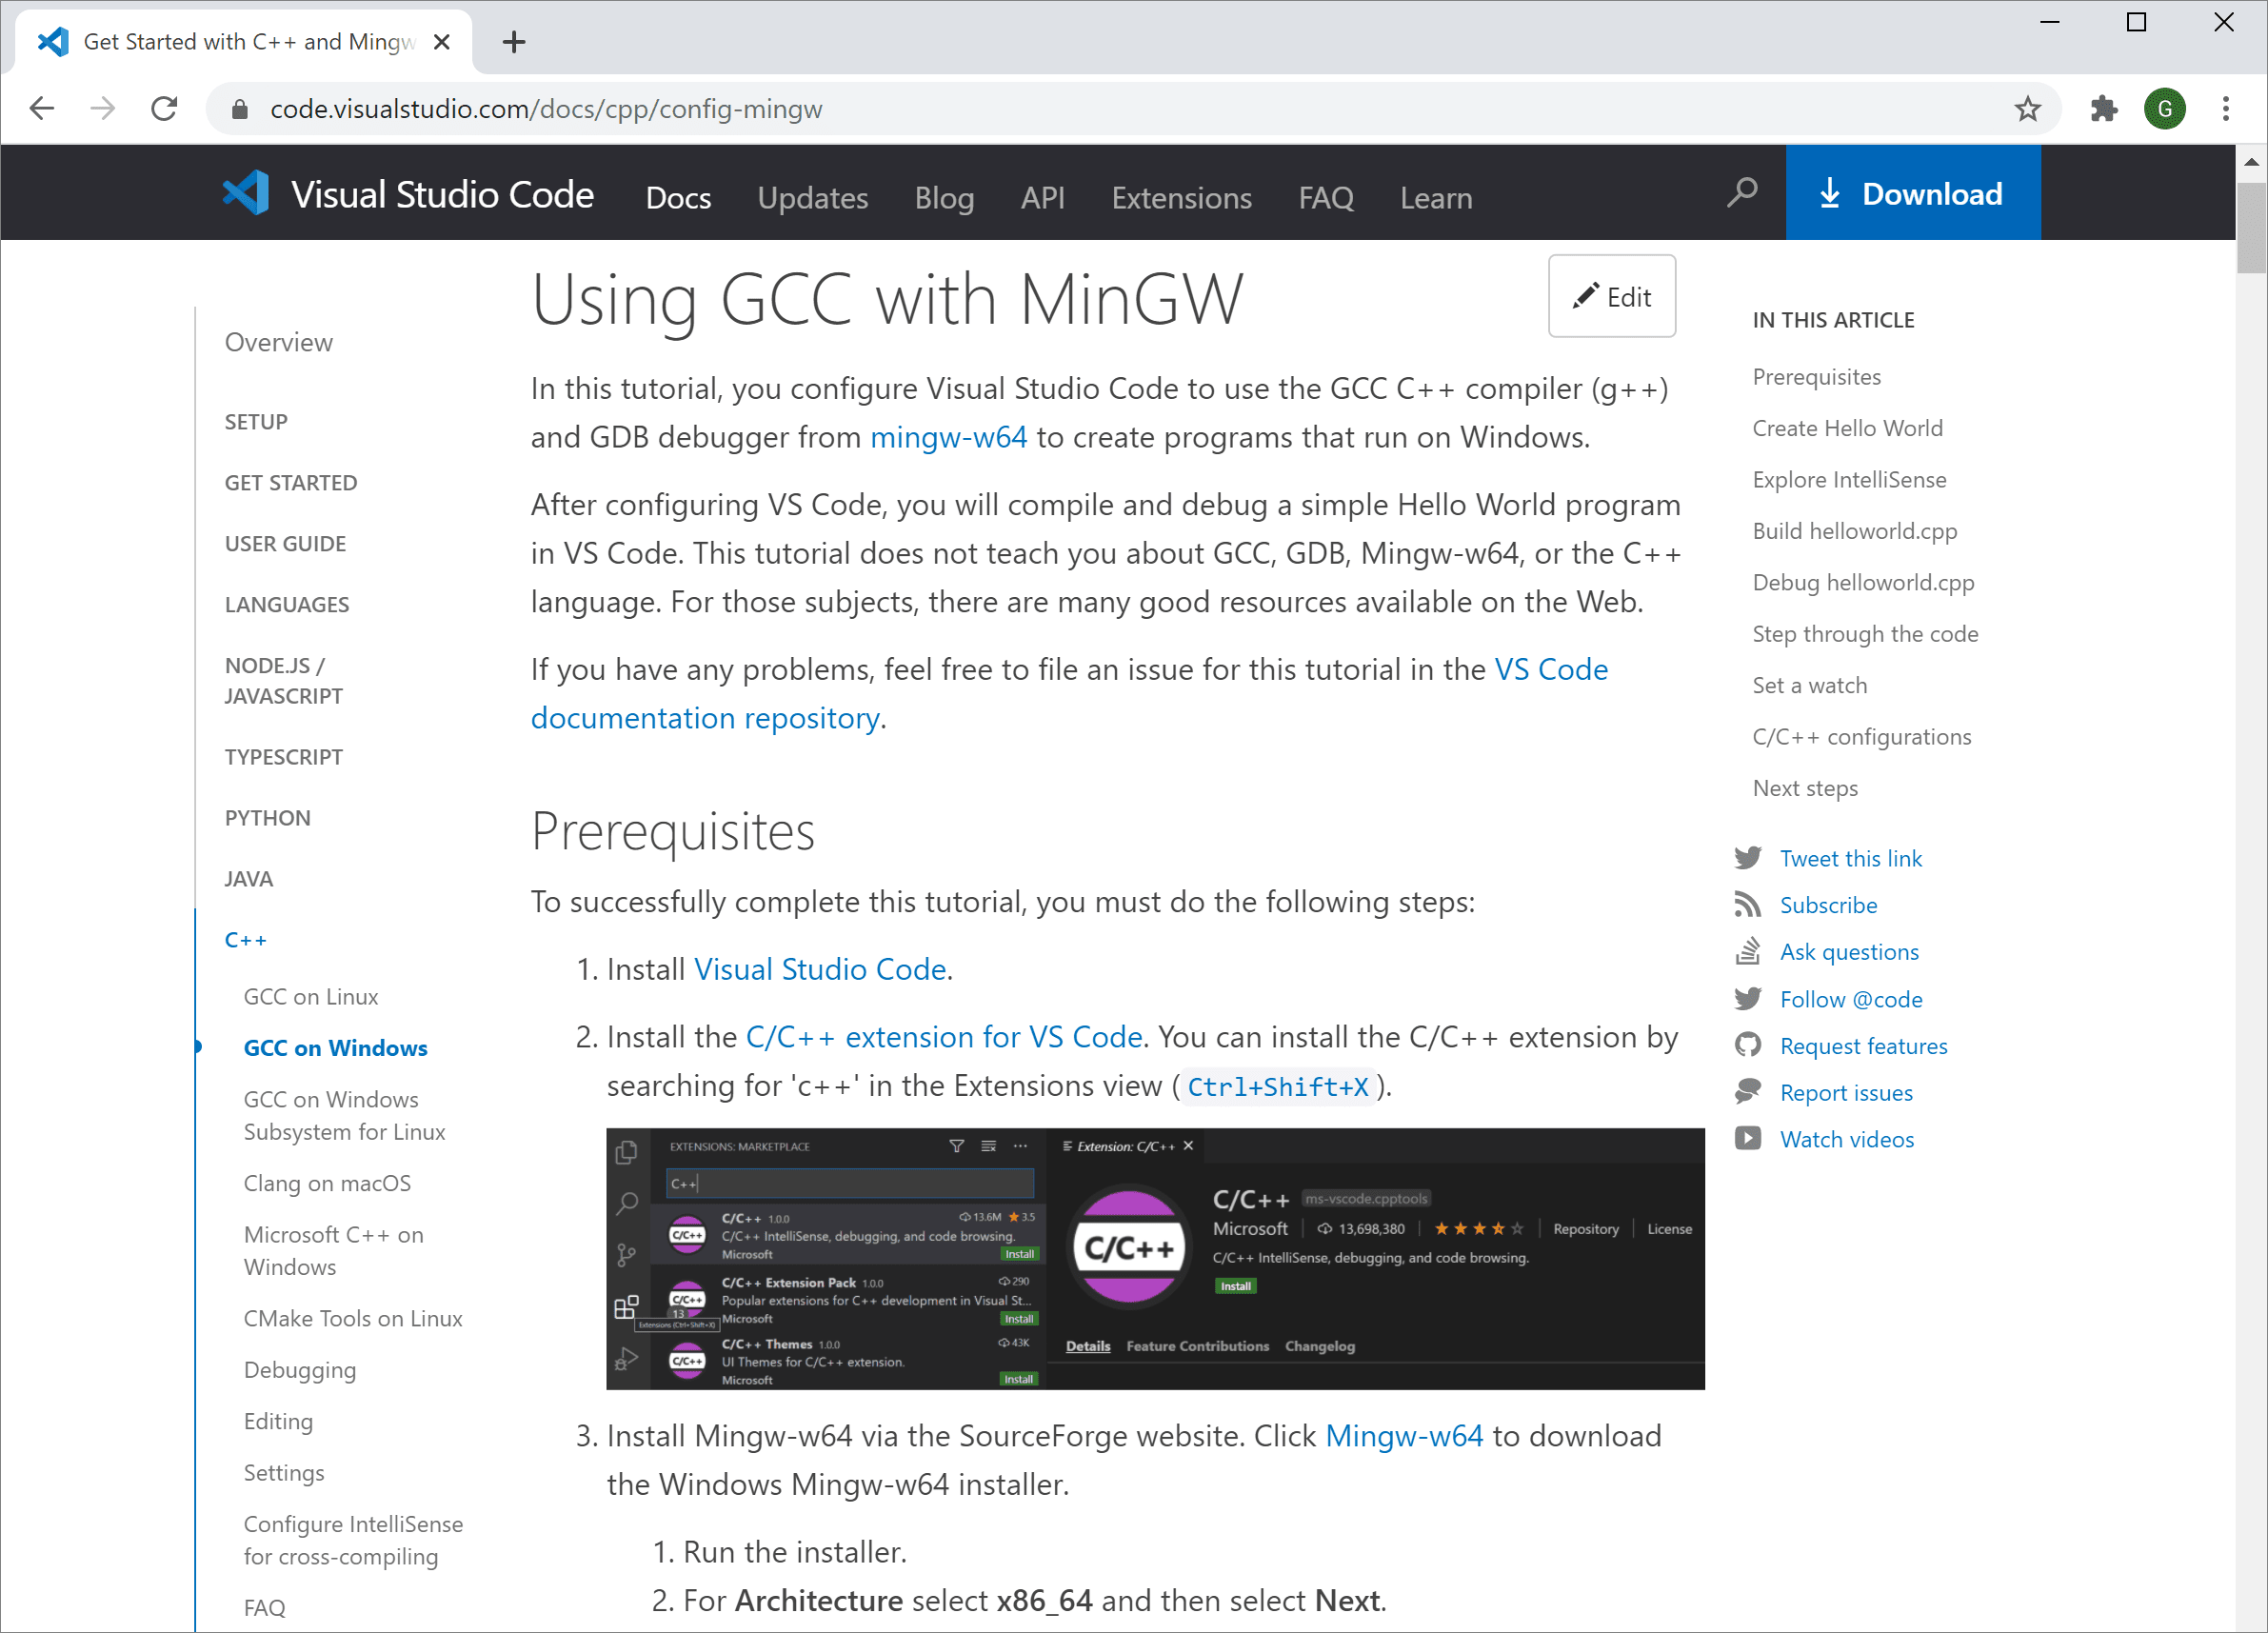
Install the C/C++ extension for VS Code. You can install the C/C++ extension by searching for ‘c++’ in the Extensions view (⇧⌘X (Windows, Linux Ctrl+Shift+X)).

-
Install the Microsoft Visual C++ (MSVC) compiler toolset.
If you have a recent version of Visual Studio, open the Visual Studio Installer from the Windows Start menu and verify that the C++ workload is checked. If it’s not installed, then check the box and select the Modify button in the installer.
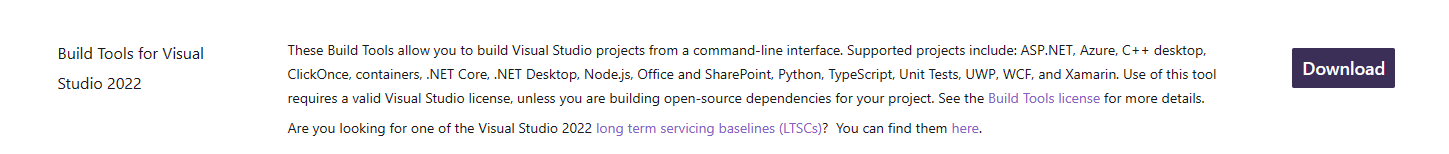
You can also install the Desktop development with C++ workload without a full Visual Studio IDE installation. From the Visual Studio Downloads page, scroll down until you see Tools for Visual Studio under the All Downloads section and select the download for Build Tools for Visual Studio 2022.
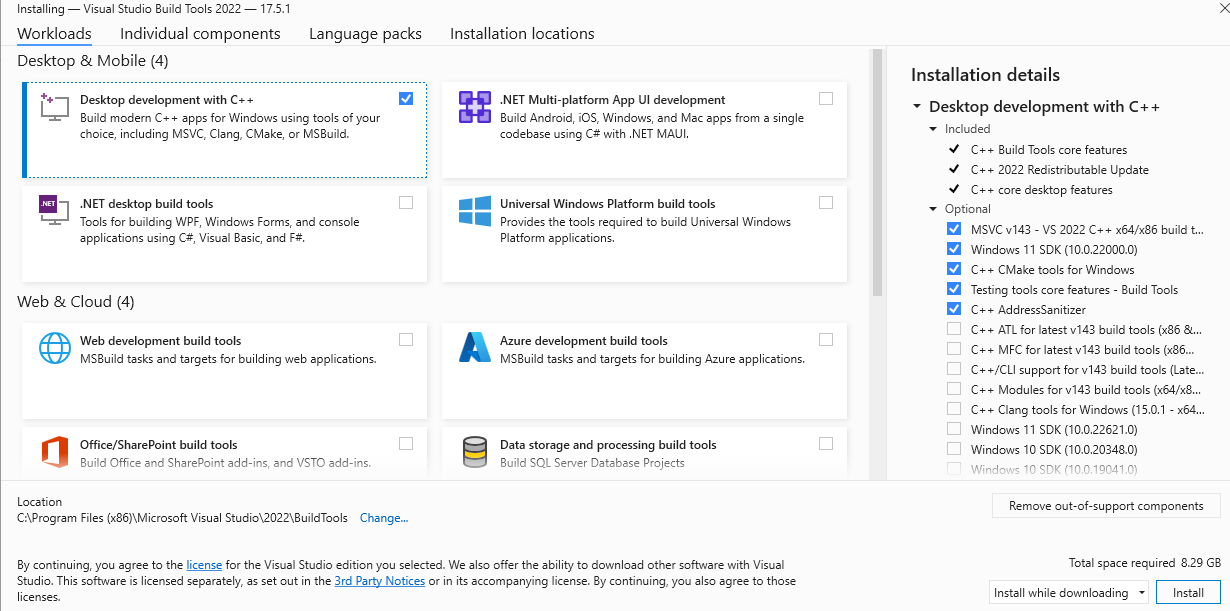
This will launch the Visual Studio Installer, which will bring up a dialog showing the available Visual Studio Build Tools workloads. Check the Desktop development with C++ workload and select Install.
Note: You can use the C++ toolset from Visual Studio Build Tools along with Visual Studio Code to compile, build, and verify any C++ codebase as long as you also have a valid Visual Studio license (either Community, Pro, or Enterprise) that you are actively using to develop that C++ codebase.
Check your Microsoft Visual C++ installation
To use MSVC from a command line or VS Code, you must run from a Developer Command Prompt for Visual Studio. An ordinary shell such as PowerShell, Bash, or the Windows command prompt does not have the necessary path environment variables set.
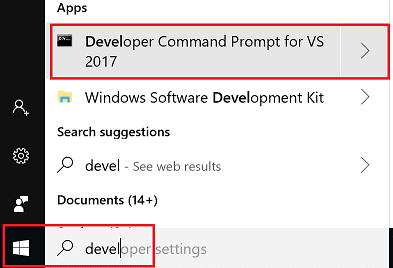
To open the Developer Command Prompt for VS, start typing ‘developer’ in the Windows Start menu, and you should see it appear in the list of suggestions. The exact name depends on which version of Visual Studio or the Visual Studio Build Tools you have installed. Select the item to open the prompt.
You can test that you have the C++ compiler, cl.exe, installed correctly by typing ‘cl’ and you should see a copyright message with the version and basic usage description.
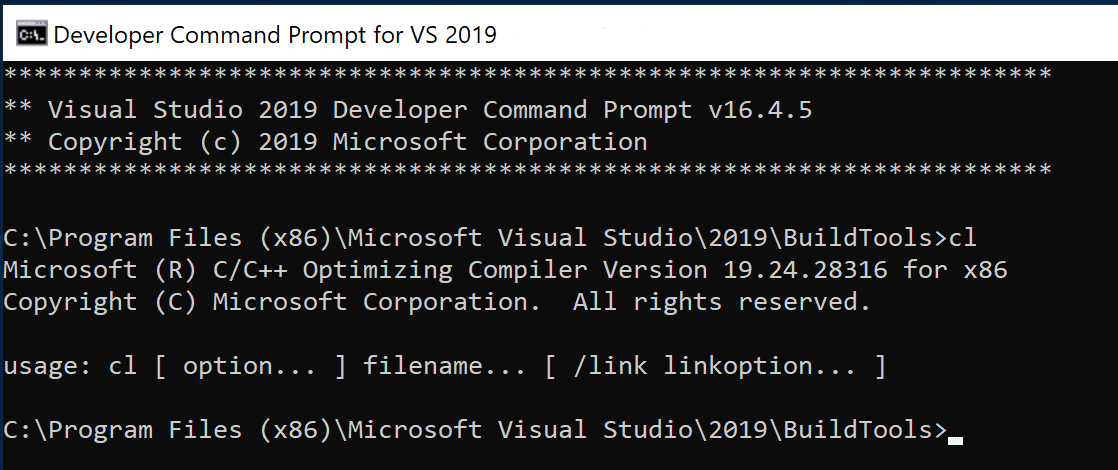
If the Developer Command Prompt is using the BuildTools location as the starting directory (you wouldn’t want to put projects there), navigate to your user folder (C:\users\{your username}\) before you start creating new projects.
Note: If for some reason you can’t run VS Code from a Developer Command Prompt, you can find a workaround for building C++ projects with VS Code in Run VS Code outside a Developer Command Prompt.
Create Hello World
From the Developer Command Prompt, create an empty folder called «projects» where you can store all your VS Code projects, then create a subfolder called «helloworld», navigate into it, and open VS Code (code) in that folder (.) by entering the following commands:
mkdir projects
cd projects
mkdir helloworld
cd helloworld
code .
The «code .» command opens VS Code in the current working folder, which becomes your «workspace». As you go through the tutorial, you will see three files created in a .vscode folder in the workspace:
tasks.json(build instructions)launch.json(debugger settings)c_cpp_properties.json(compiler path and IntelliSense settings)
Add a source code file
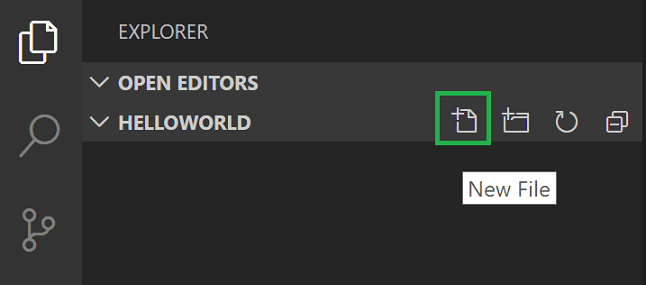
In the File Explorer title bar, select the New File button and name the file helloworld.cpp.
Add hello world source code
Now paste in this source code:
#include <iostream>
#include <vector>
#include <string>

using namespace std;

int main()
{
    vector<string> msg {"Hello", "C++", "World", "from", "VS Code", "and the C++ extension!"};

    for (const string& word : msg)
    {
        cout << word << " ";
    }
    cout << endl;
}
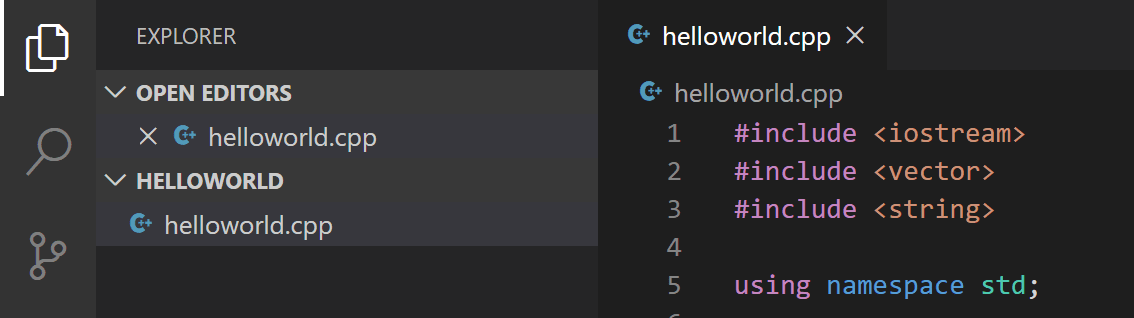
Now press ⌘S (Windows, Linux Ctrl+S) to save the file. Notice how the file you just added appears in the File Explorer view (⇧⌘E (Windows, Linux Ctrl+Shift+E)) in the side bar of VS Code:
You can also enable Auto Save to automatically save your file changes, by checking Auto Save in the main File menu.
The Activity Bar on the far left lets you open different views such as Search, Source Control, and Run. You’ll look at the Run view later in this tutorial. You can find out more about the other views in the VS Code User Interface documentation.
Note: When you save or open a C++ file, you may see a notification from the C/C++ extension about the availability of an Insiders version, which lets you test new features and fixes. You can ignore this notification by selecting the
X(Clear Notification).
Explore IntelliSense
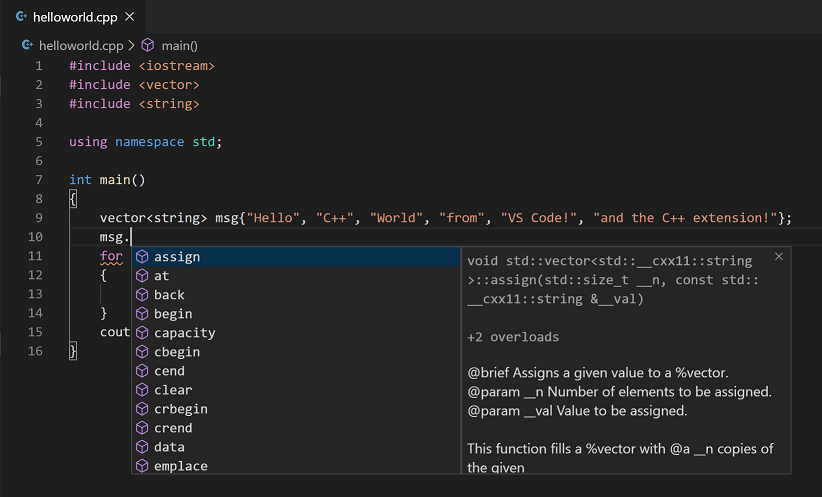
In your new helloworld.cpp file, hover over vector or string to see type information. After the declaration of the msg variable, start typing msg. as you would when calling a member function. You should immediately see a completion list that shows all the member functions, and a window that shows the type information for the msg object:
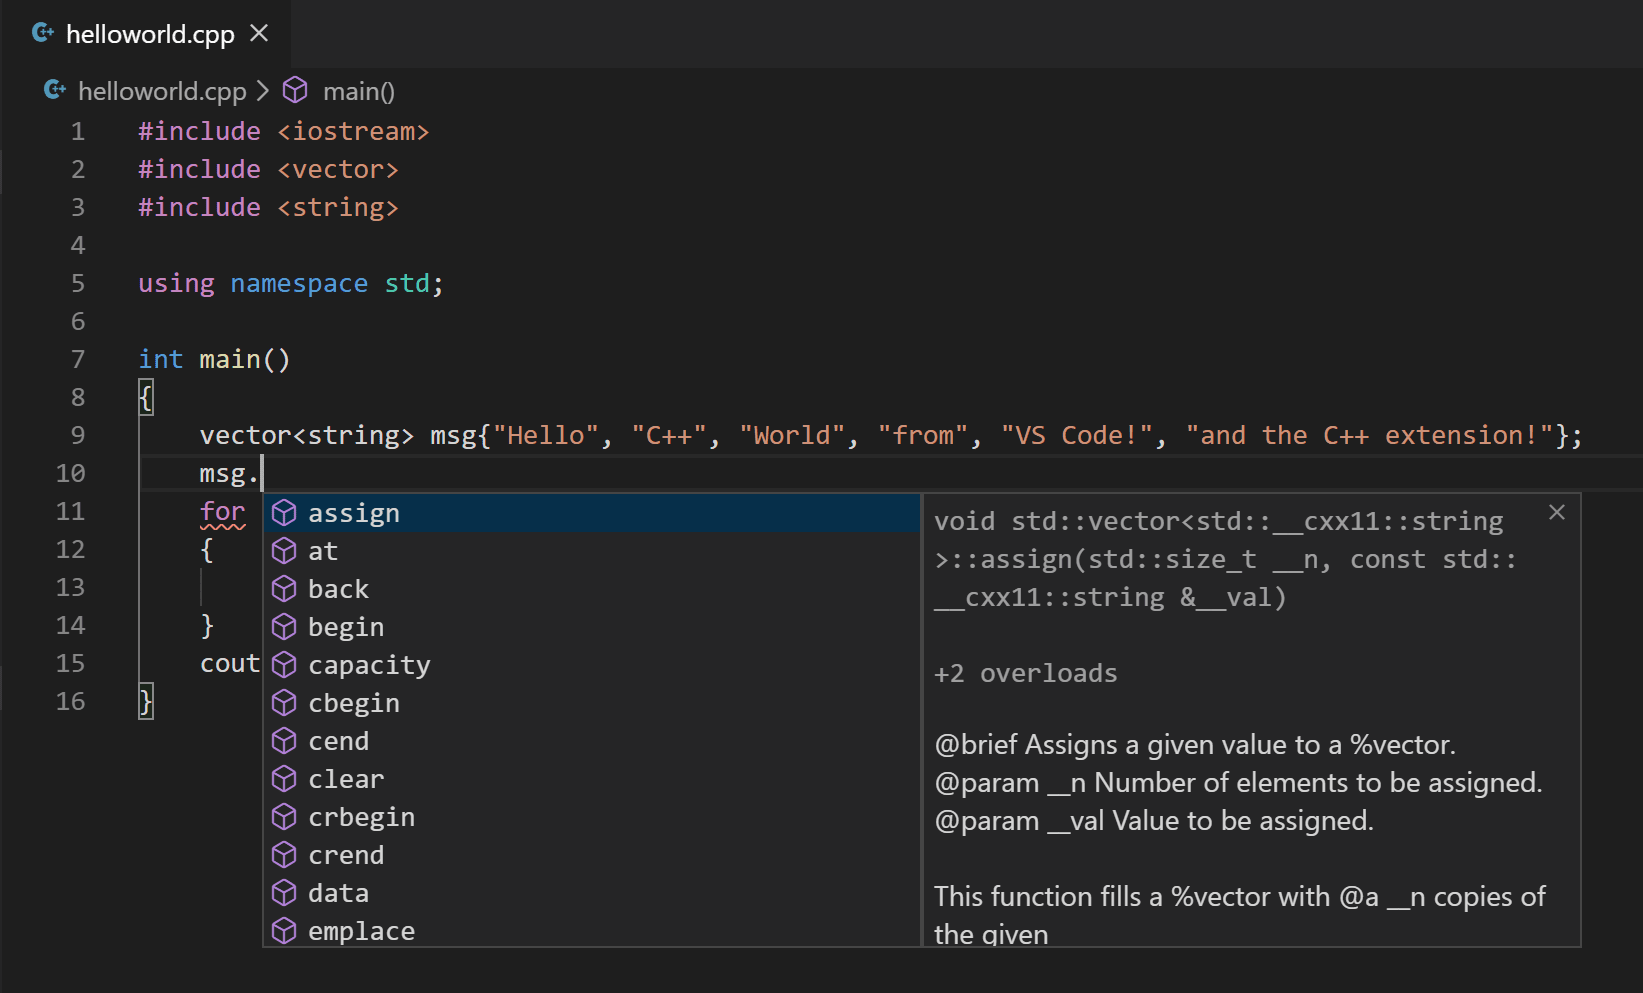
You can press the Tab key to insert the selected member; then, when you add the opening parenthesis, you will see information about any arguments that the function requires.
Run helloworld.cpp
Remember, the C++ extension uses the C++ compiler you have installed on your machine to build your program. Make sure you have a C++ compiler installed before attempting to run and debug helloworld.cpp in VS Code.
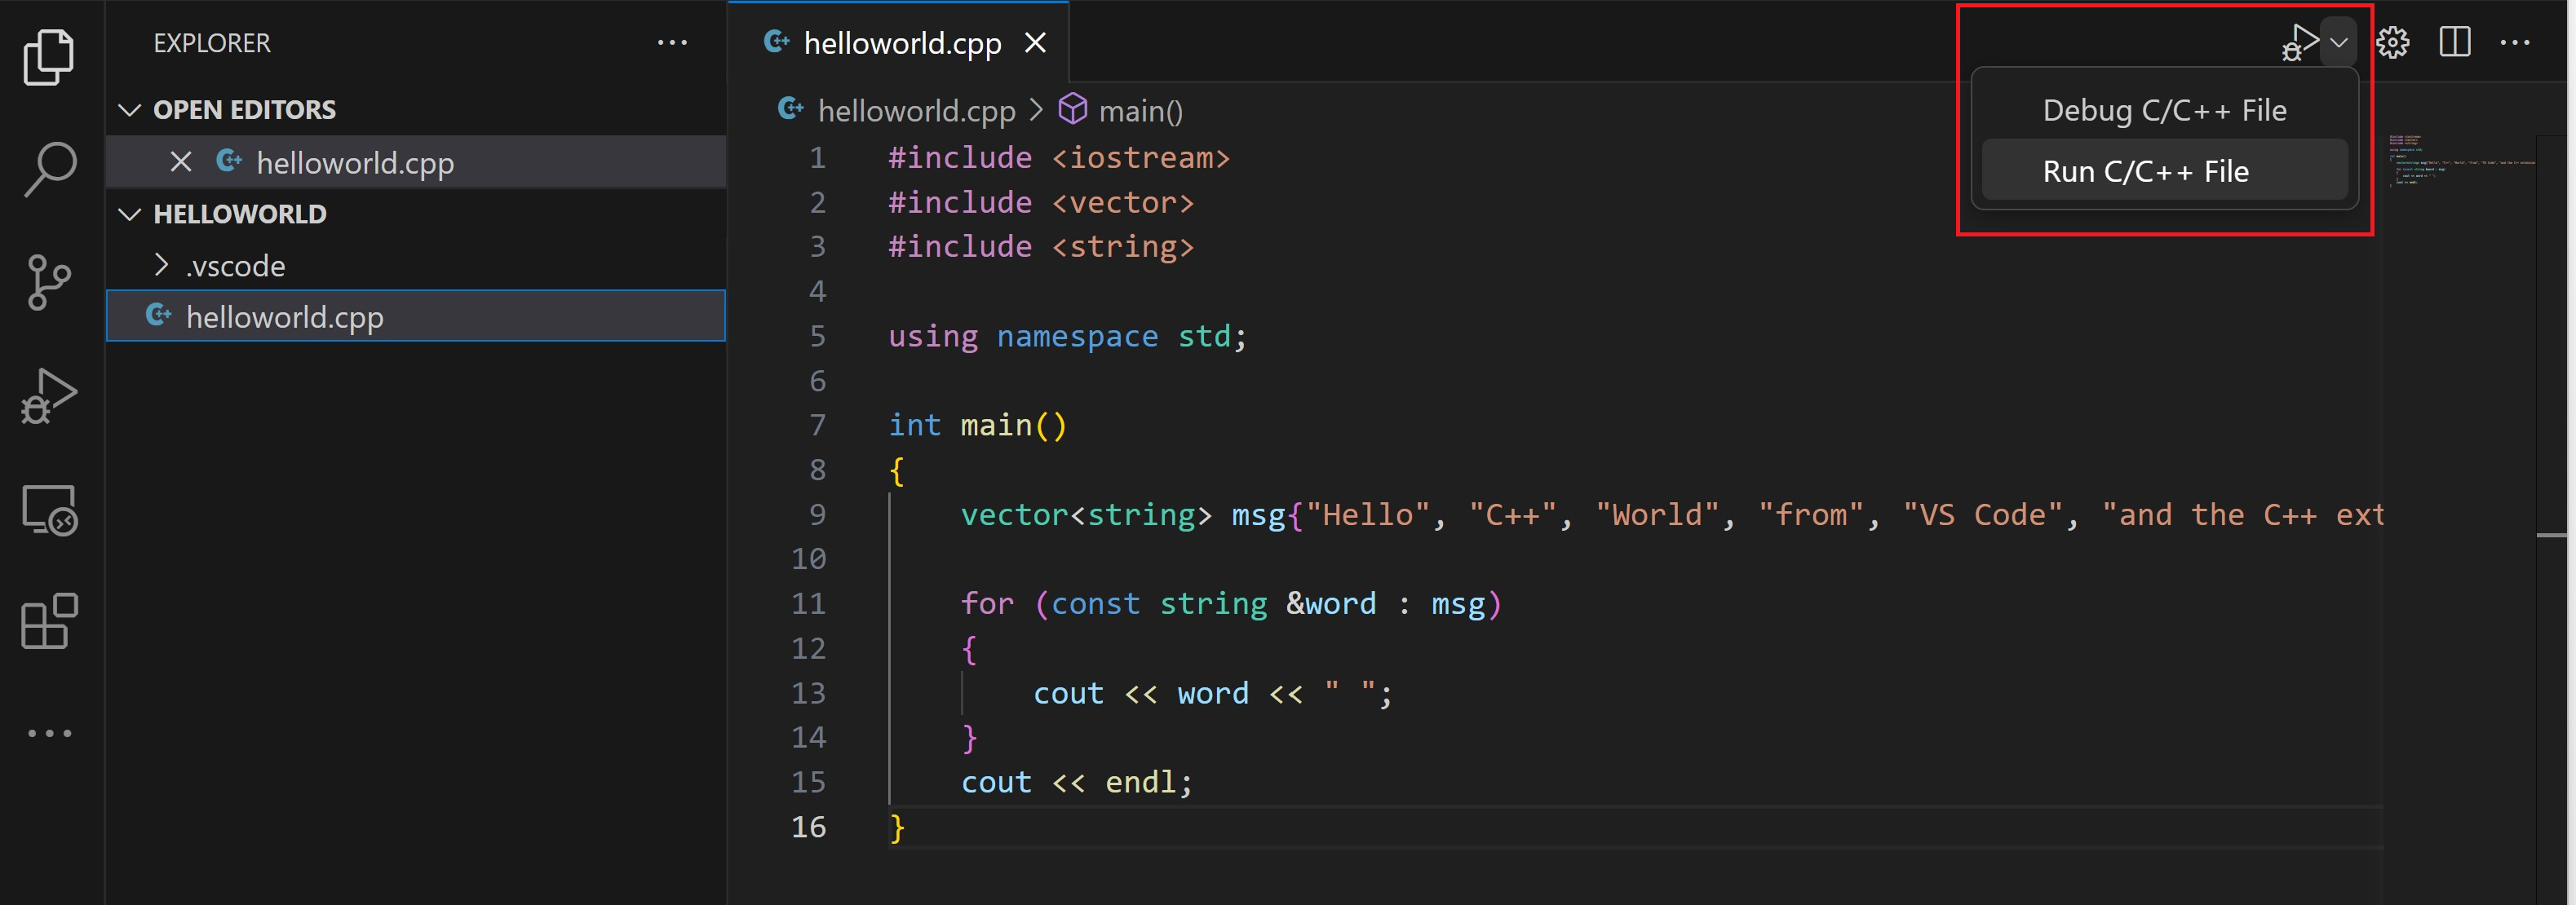
-
Open
helloworld.cppso that it is the active file. -
Press the play button in the top right corner of the editor.
-
Choose C/C++: cl.exe build and debug active file from the list of detected compilers on your system.
You’ll only be asked to choose a compiler the first time you run helloworld.cpp. This compiler will be set as the «default» compiler in tasks.json file.
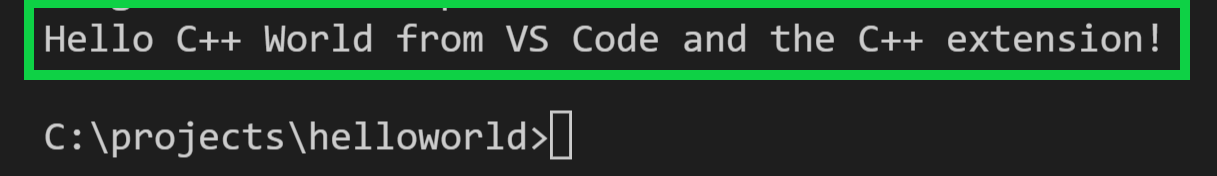
-
After the build succeeds, your program’s output will appear in the integrated Terminal.
If you get an error trying to build and debug with cl.exe, make sure you have started VS Code from the Developer Command Prompt for Visual Studio using the code . shortcut.

The first time you run your program, the C++ extension creates tasks.json, which you’ll find in your project’s .vscode folder. tasks.json stores build configurations.
Your new tasks.json file should look similar to the JSON below:
{
  "version": "2.0.0",
  "tasks": [
    {
      "type": "shell",
      "label": "C/C++: cl.exe build active file",
      "command": "cl.exe",
      "args": [
        "/Zi",
        "/EHsc",
        "/Fe:",
        "${fileDirname}\\${fileBasenameNoExtension}.exe",
        "${file}"
      ],
      "problemMatcher": ["$msCompile"],
      "group": {
        "kind": "build",
        "isDefault": true
      },
      "detail": "Task generated by Debugger."
    }
  ]
}
Note: You can learn more about
tasks.jsonvariables in the variables reference.
The command setting specifies the program to run; in this case that is «cl.exe». The args array specifies the command-line arguments that will be passed to cl.exe. These arguments must be specified in the order expected by the compiler.
This task tells the C++ compiler to take the active file (${file}), compile it, and create an executable file (/Fe: switch) in the current directory (${fileDirname}) with the same name as the active file but with the .exe extension (${fileBasenameNoExtension}.exe), resulting in helloworld.exe for our example.
The label value is what you will see in the tasks list; you can name this whatever you like.
The detail value is what you will as the description of the task in the tasks list. It’s highly recommended to rename this value to differentiate it from similar tasks.
The problemMatcher value selects the output parser to use for finding errors and warnings in the compiler output. For cl.exe, you’ll get the best results if you use the $msCompile problem matcher.
From now on, the play button will read from tasks.json to figure out how to build and run your program. You can define multiple build tasks in tasks.json, and whichever task is marked as the default will be used by the play button. In case you need to change the default compiler, you can run Tasks: Configure default build task. Alternatively you can modify the tasks.json file and remove the default by replacing this segment:
    "group": {
        "kind": "build",
        "isDefault": true
    },
with this:
"group": "build",
Modifying tasks.json
You can modify your tasks.json to build multiple C++ files by using an argument like "${workspaceFolder}/*.cpp" instead of ${file}.This will build all .cpp files in your current folder. You can also modify the output filename by replacing "${fileDirname}\\${fileBasenameNoExtension}.exe" with a hard-coded filename (for example "${workspaceFolder}\\myProgram.exe").
Debug helloworld.cpp
To debug your code,
- Go back to
helloworld.cppso that it is the active file. - Set a breakpoint by clicking on the editor margin or using F9 on the current line.
- From the drop-down next to the play button, select Debug C/C++ File.
- Choose C/C++: cl.exe build and debug active file from the list of detected compilers on your system (you’ll only be asked to choose a compiler the first time you run or debug
helloworld.cpp).
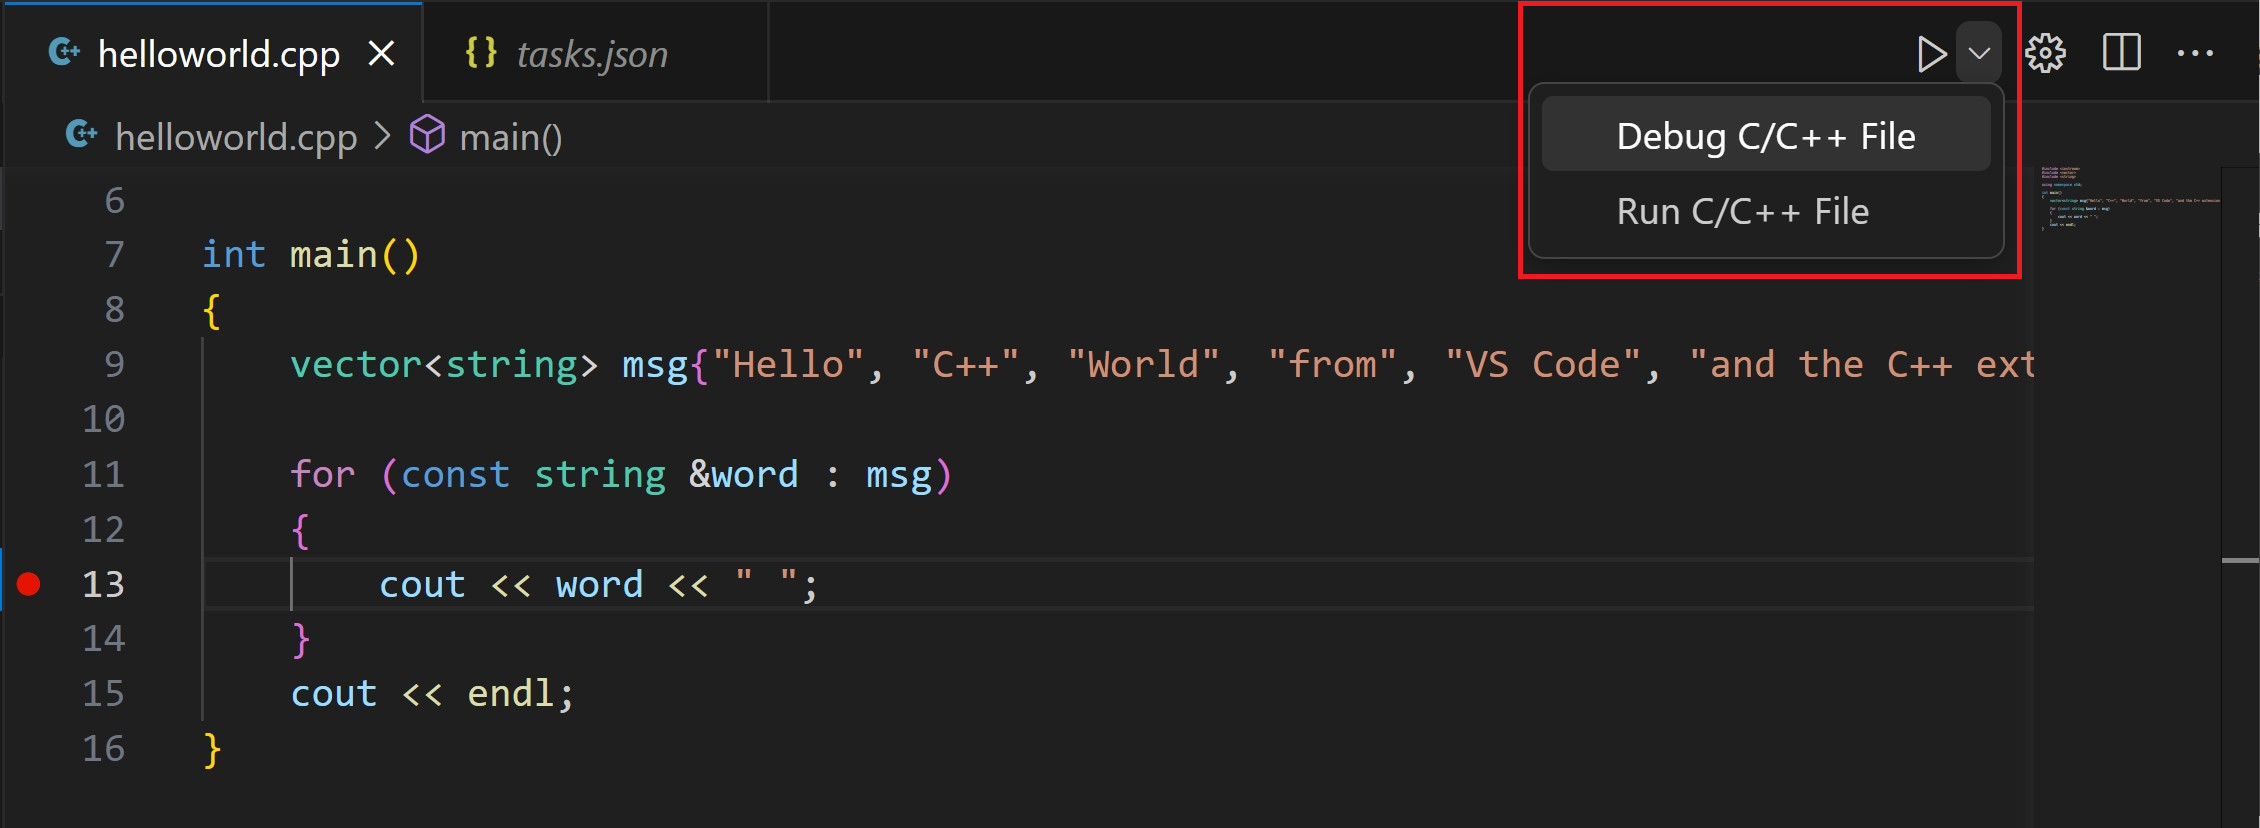
The play button has two modes: Run C/C++ File and Debug C/C++ File. It will default to the last-used mode. If you see the debug icon in the play button, you can select the play button to debug, instead of selecting the drop-down menu item.
If you get an error trying to build and debug with cl.exe, make sure you have started VS Code from the Developer Command Prompt for Visual Studio using the code . shortcut.
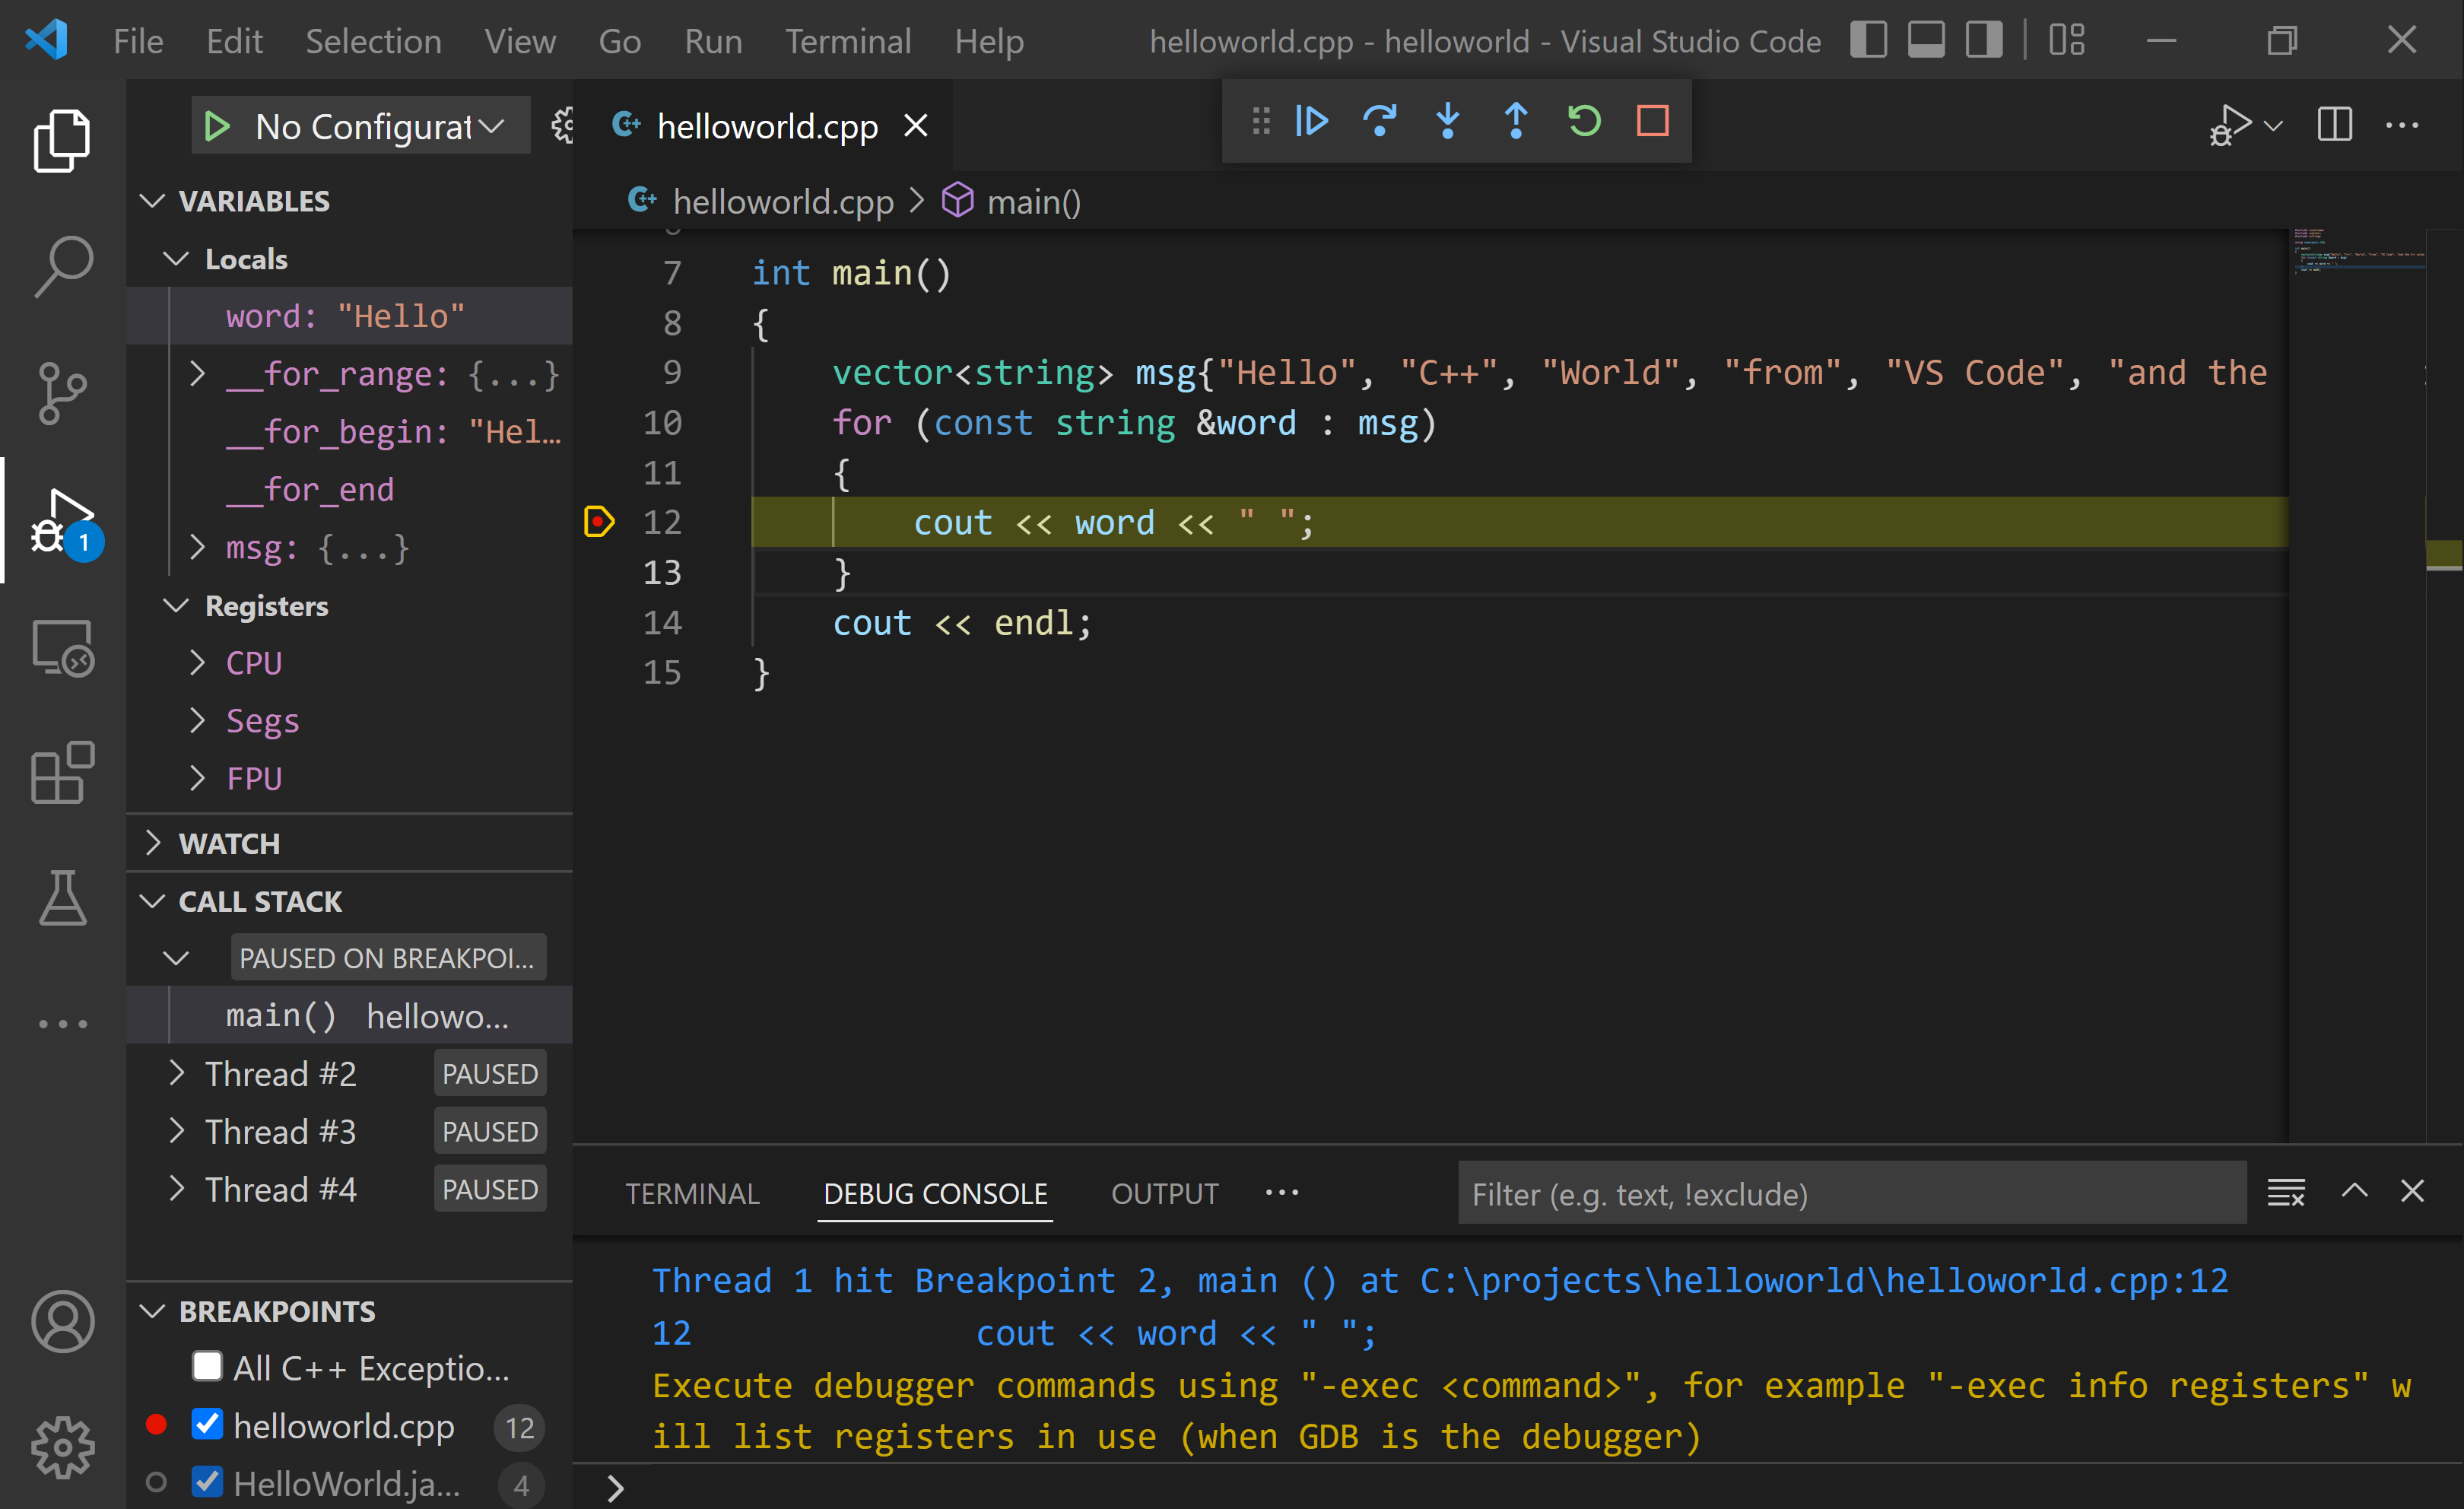
Explore the debugger
Before you start stepping through the code, let’s take a moment to notice several changes in the user interface:
-
The Integrated Terminal appears at the bottom of the source code editor. In the Debug Output tab, you see output that indicates the debugger is up and running.
-
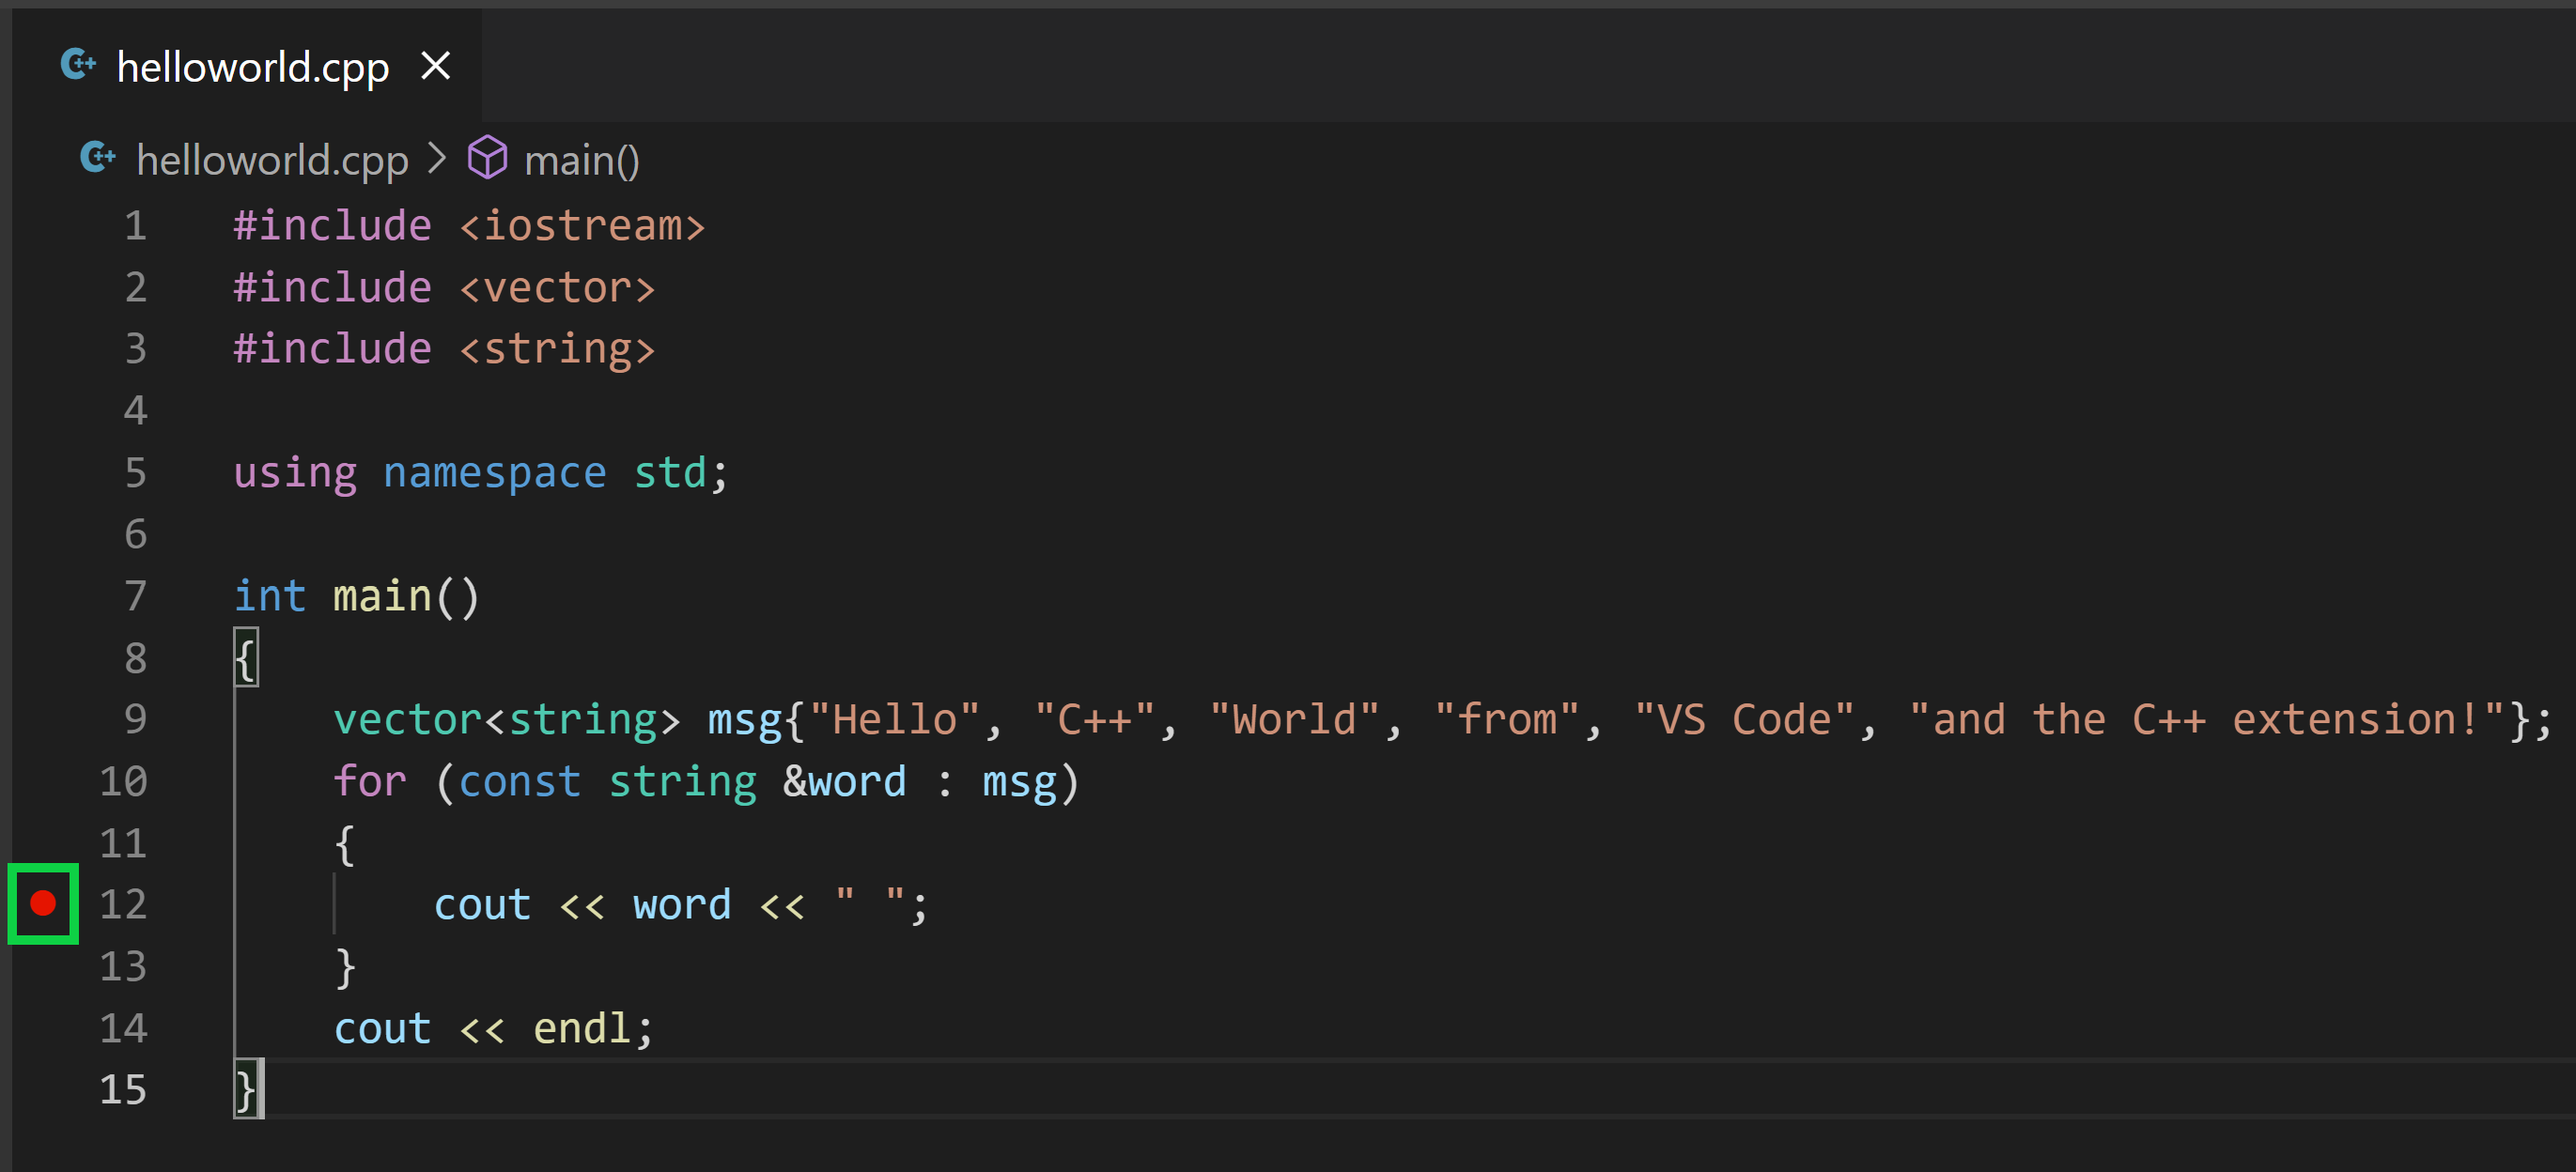
The editor highlights the line where you set a breakpoint before starting the debugger:
-
The Run and Debug view on the left shows debugging information. You’ll see an example later in the tutorial.
-
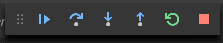
At the top of the code editor, a debugging control panel appears. You can move this around the screen by grabbing the dots on the left side.
Step through the code
Now you’re ready to start stepping through the code.
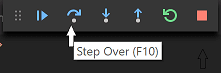
-
Click or press the Step over icon in the debugging control panel.
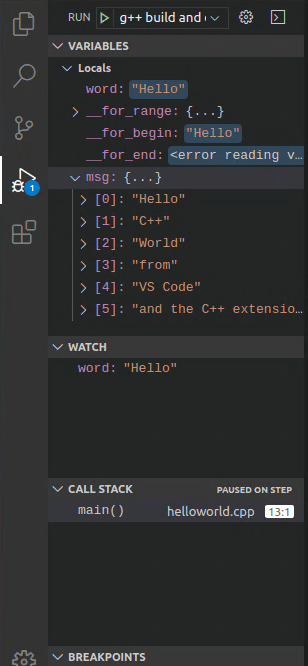
This will advance program execution to the first line of the for loop, and skip over all the internal function calls within the
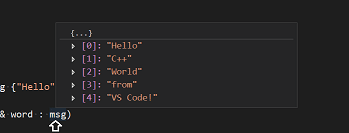
vectorandstringclasses that are invoked when themsgvariable is created and initialized. Notice the change in the Variables window on the left.In this case, the errors are expected because, although the variable names for the loop are now visible to the debugger, the statement has not executed yet, so there is nothing to read at this point. The contents of
msgare visible, however, because that statement has completed. -
Press Step over again to advance to the next statement in this program (skipping over all the internal code that is executed to initialize the loop). Now, the Variables window shows information about the loop variables.
-
Press Step over again to execute the
coutstatement. (Note that as of the March 2019 release, the C++ extension does not print any output to the Debug Console until the loop exits.) -
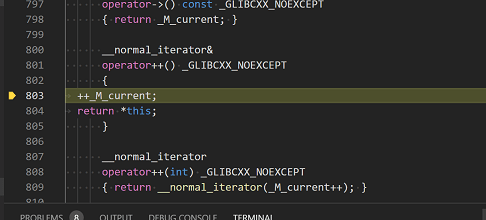
If you like, you can keep pressing Step over until all the words in the vector have been printed to the console. But if you are curious, try pressing the Step Into button to step through source code in the C++ standard library!
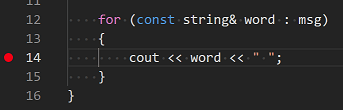
To return to your own code, one way is to keep pressing Step over. Another way is to set a breakpoint in your code by switching to the
helloworld.cpptab in the code editor, putting the insertion point somewhere on thecoutstatement inside the loop, and pressing F9. A red dot appears in the gutter on the left to indicate that a breakpoint has been set on this line.Then press F5 to start execution from the current line in the standard library header. Execution will break on
cout. If you like, you can press F9 again to toggle off the breakpoint.
Set a watch
Sometimes you might want to keep track of the value of a variable as your program executes. You can do this by setting a watch on the variable.
-
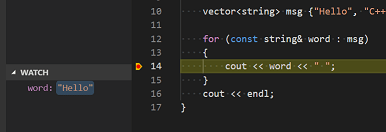
Place the insertion point inside the loop. In the Watch window, select the plus sign and in the text box, type
word, which is the name of the loop variable. Now view the Watch window as you step through the loop. -
Add another watch by adding this statement before the loop:
int i = 0;. Then, inside the loop, add this statement:++i;. Now add a watch forias you did in the previous step. -
To quickly view the value of any variable while execution is paused on a breakpoint, you can hover over it with the mouse pointer.
Customize debugging with launch.json
When you debug with the play button or F5, the C++ extension creates a dynamic debug configuration on the fly.
There are cases where you’d want to customize your debug configuration, such as specifying arguments to pass to the program at runtime. You can define custom debug configurations in a launch.json file.
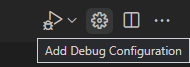
To create launch.json, choose Add Debug Configuration from the play button drop-down menu.
You’ll then see a dropdown for various predefined debugging configurations. Choose C/C++: cl.exe build and debug active file.

VS Code creates a launch.json file, which looks something like this:
{
  "version": "0.2.0",
  "configurations": [
    {
      "name": "C/C++: cl.exe build and debug active file",
      "type": "cppvsdbg",
      "request": "launch",
      "program": "${fileDirname}\\${fileBasenameNoExtension}.exe",
      "args": [],
      "stopAtEntry": false,
      "cwd": "${workspaceFolder}",
      "environment": [],
      "externalConsole": false,
      "preLaunchTask": "C/C++: cl.exe build active file"
    }
  ]
}
In the JSON above, program specifies the program you want to debug. Here it is set to the active file folder (${fileDirname}) and active filename with the .exe extension (${fileBasenameNoExtension}.exe), which if helloworld.cpp is the active file will be helloworld.exe. The args property is an array of arguments to pass to the program at runtime.
By default, the C++ extension won’t add any breakpoints to your source code and the stopAtEntry value is set to false.
Change the stopAtEntry value to true to cause the debugger to stop on the main method when you start debugging.
From now on, the play button and F5 will read from your
launch.jsonfile when launching your program for debugging.
C/C++ configurations
If you want more control over the C/C++ extension, you can create a c_cpp_properties.json file, which will allow you to change settings such as the path to the compiler, include paths, C++ standard (default is C++17), and more.
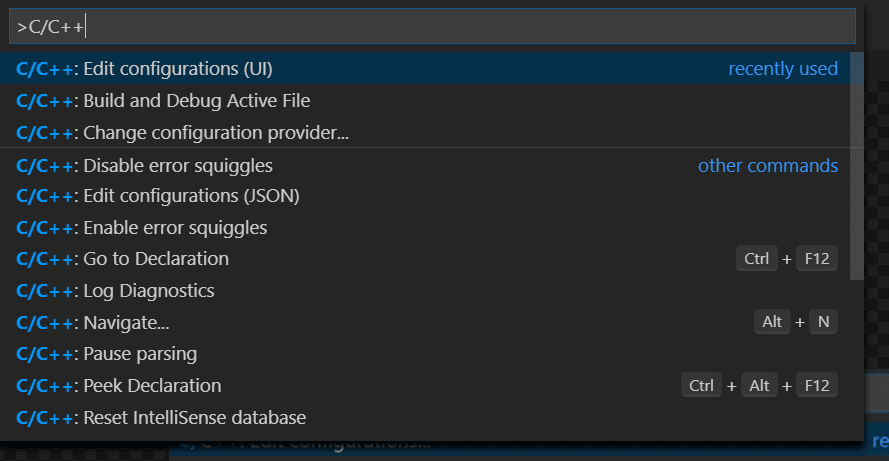
You can view the C/C++ configuration UI by running the command C/C++: Edit Configurations (UI) from the Command Palette (⇧⌘P (Windows, Linux Ctrl+Shift+P)).
This opens the C/C++ Configurations page. When you make changes here, VS Code writes them to a file called c_cpp_properties.json in the .vscode folder.
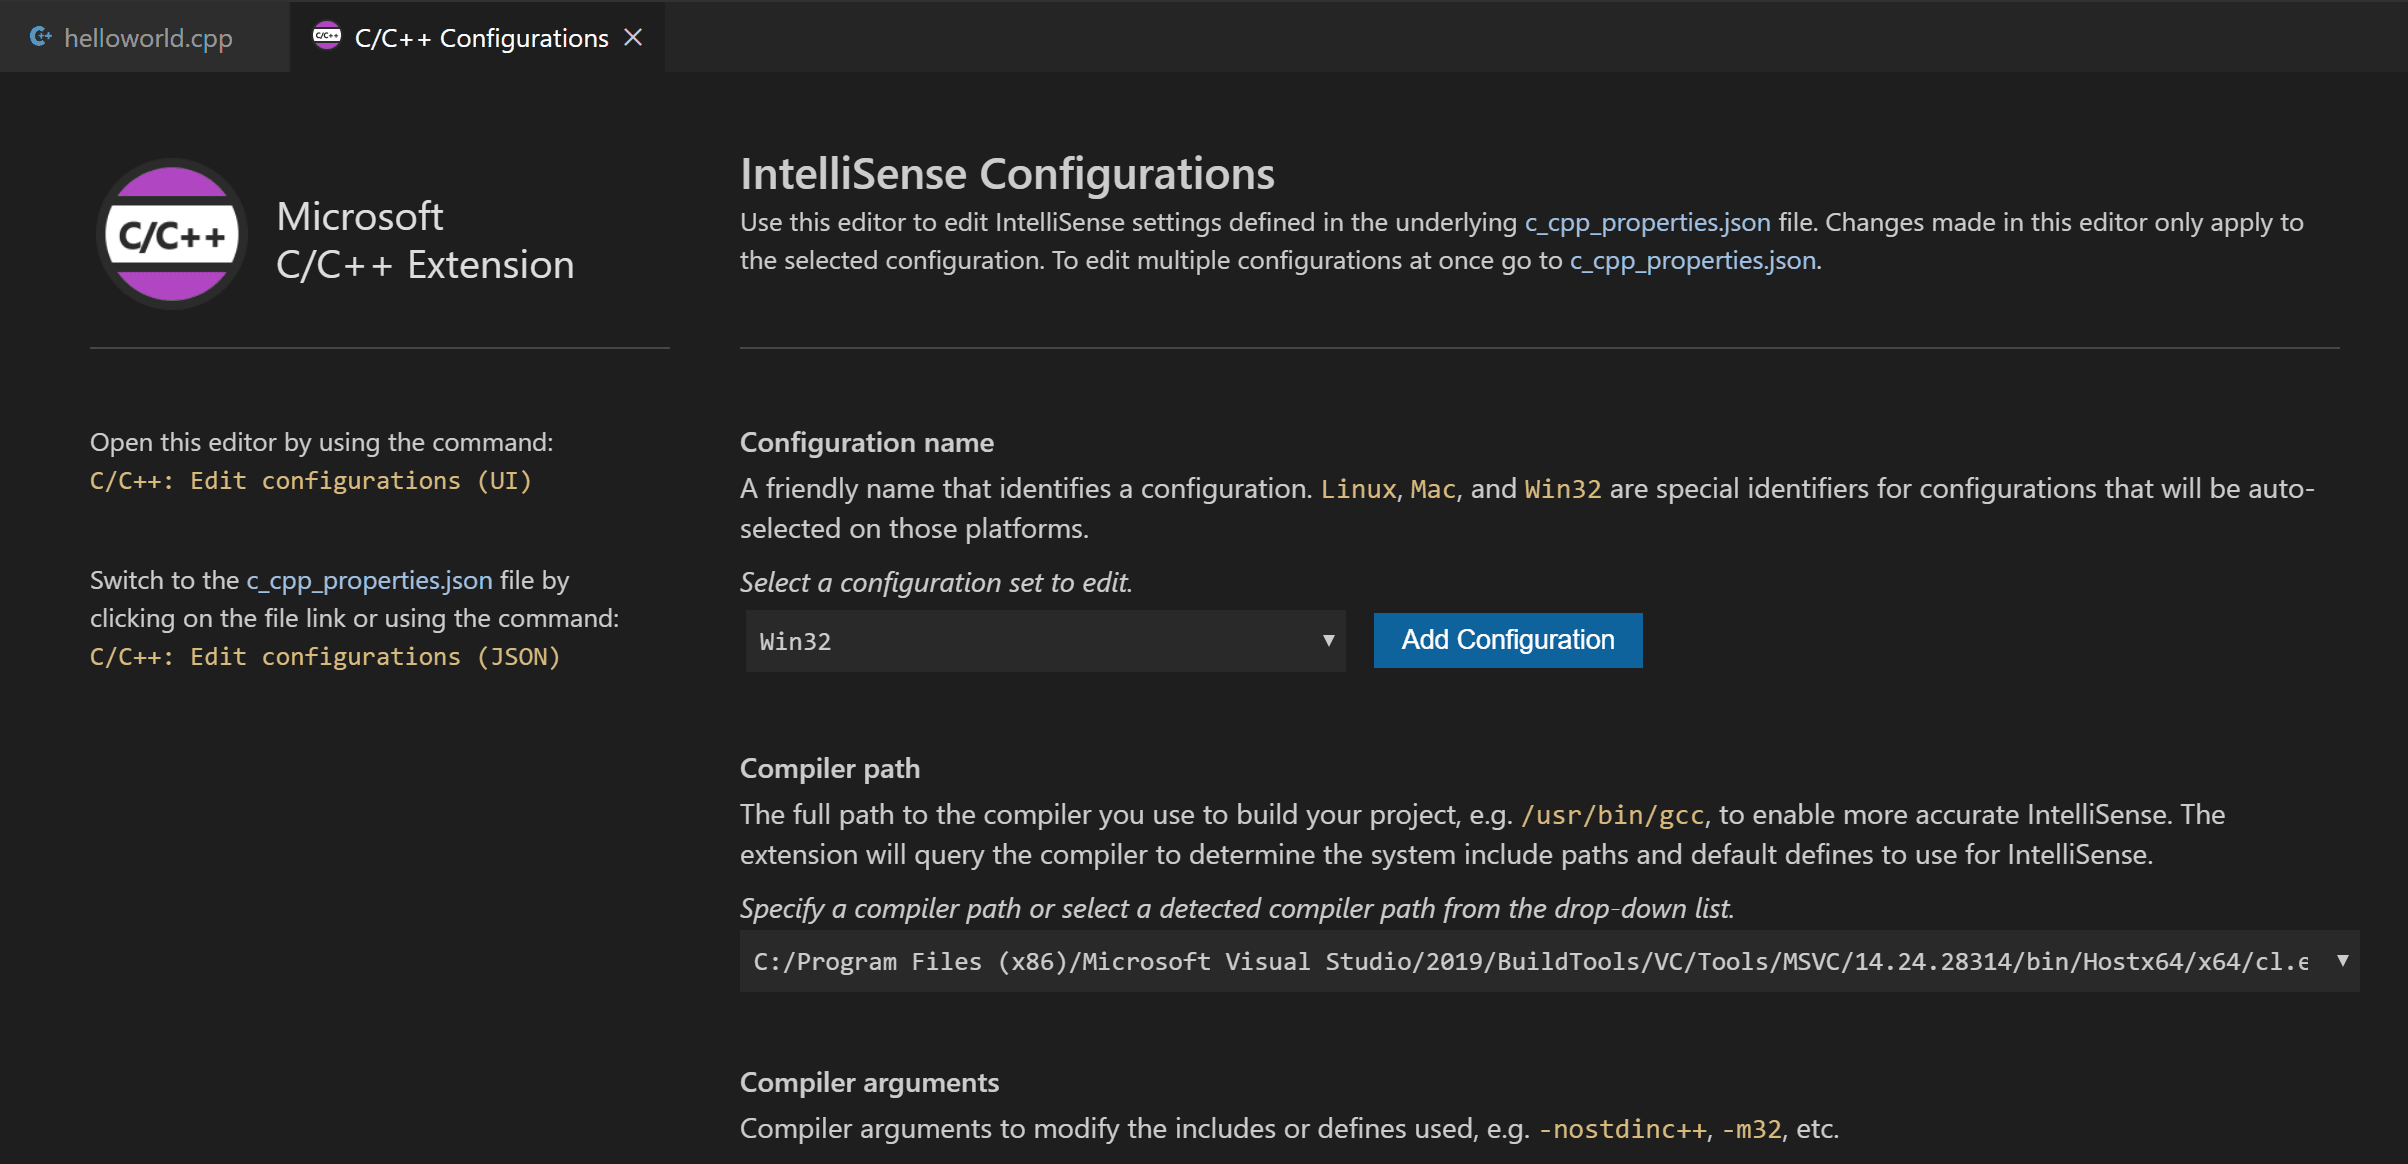
Visual Studio Code places these settings in .vscode\c_cpp_properties.json. If you open that file directly, it should look something like this:
{
  "configurations": [
    {
      "name": "Win32",
      "includePath": ["${workspaceFolder}/**"],
      "defines": ["_DEBUG", "UNICODE", "_UNICODE"],
      "windowsSdkVersion": "10.0.18362.0",
      "compilerPath": "C:/Program Files (x86)/Microsoft Visual Studio/2019/BuildTools/VC/Tools/MSVC/14.24.28314/bin/Hostx64/x64/cl.exe",
      "cStandard": "c11",
      "cppStandard": "c++17",
      "intelliSenseMode": "msvc-x64"
    }
  ],
  "version": 4
}
You only need to add to the Include path array setting if your program includes header files that are not in your workspace or in the standard library path.
Compiler path
The compilerPath setting is an important setting in your configuration. The extension uses it to infer the path to the C++ standard library header files. When the extension knows where to find those files, it can provide useful features like smart completions and Go to Definition navigation.
The C/C++ extension attempts to populate compilerPath with the default compiler location based on what it finds on your system. The extension looks in several common compiler locations.
The compilerPath search order is:
- First check for the Microsoft Visual C++ compilerOpe
- Then look for g++ on Windows Subsystem for Linux (WSL)
- Then g++ for Mingw-w64.
If you have g++ or WSL installed, you might need to change compilerPath to match the preferred compiler for your project. For Microsoft C++, the path should look something like this, depending on which specific version you have installed: «C:/Program Files (x86)/Microsoft Visual Studio/2017/BuildTools/VC/Tools/MSVC/14.16.27023/bin/Hostx64/x64/cl.exe».
Reusing your C++ configuration
VS Code is now configured to use the Microsoft C++ compiler. The configuration applies to the current workspace. To reuse the configuration, just copy the JSON files to a .vscode folder in a new project folder (workspace) and change the names of the source file(s) and executable as needed.
Run VS Code outside the Developer Command Prompt
In certain circumstances, it isn’t possible to run VS Code from Developer Command Prompt for Visual Studio (for example, in Remote Development through SSH scenarios). In that case, you can automate initialization of Developer Command Prompt for Visual Studio during the build using the following tasks.json configuration:
{
  "version": "2.0.0",
  "windows": {
    "options": {
      "shell": {
        "executable": "cmd.exe",
        "args": [
          "/C",
          // The path to VsDevCmd.bat depends on the version of Visual Studio you have installed.
          "\"C:/Program Files (x86)/Microsoft Visual Studio/2019/Community/Common7/Tools/VsDevCmd.bat\"",
          "&&"
        ]
      }
    }
  },
  "tasks": [
    {
      "type": "shell",
      "label": "cl.exe build active file",
      "command": "cl.exe",
      "args": [
        "/Zi",
        "/EHsc",
        "/Fe:",
        "${fileDirname}\\${fileBasenameNoExtension}.exe",
        "${file}"
      ],
      "problemMatcher": ["$msCompile"],
      "group": {
        "kind": "build",
        "isDefault": true
      }
    }
  ]
}
Note: The path to
VsDevCmd.batmight be different depending on the Visual Studio version or installation path. You can find the path toVsDevCmd.batby opening a Command Prompt and runningdir "\VsDevCmd*" /s.
Troubleshooting
The term ‘cl.exe’ is not recognized
If you see the error «The term ‘cl.exe’ is not recognized as the name of a cmdlet, function, script file, or operable program.», this usually means you are running VS Code outside of a Developer Command Prompt for Visual Studio and VS Code doesn’t know the path to the cl.exe compiler.
VS Code must either be started from the Developer Command Prompt for Visual Studio, or the task must be configured to run outside a Developer Command Prompt.
You can always check that you are running VS Code in the context of the Developer Command Prompt by opening a new Terminal (⌃⇧` (Windows, Linux Ctrl+Shift+`)) and typing ‘cl’ to verify cl.exe is available to VS Code.
fatal error C1034: assert.h: no include path set
In this case, cl.exe is available to VS Code through the PATH environment variable, but VS Code still needs to either be started from the Developer Command Prompt for Visual Studio, or be configured to run outside the Developer Command Prompt. Otherwise, cl.exe does not have access to important environment variables such as INCLUDE.
Next steps
- Explore the VS Code User Guide.
- Review the Overview of the C++ extension.
- Create a new workspace, copy your
.vscodeJSON files to it, adjust the necessary settings for the new workspace path, program name, and so on, and start coding!
3/7/2023
C/C++ support for Visual Studio Code is provided by a Microsoft C/C++ extension to enable cross-platform C and C++ development on Windows, Linux, and macOS. When you create a *.cpp file, the extension adds features such as syntax highlighting (colorization), smart completions and hovers (IntelliSense), and error checking.
Install the extension
- Open VS Code.
- Select the Extensions view icon on the Activity bar or use the keyboard shortcut (⇧⌘X (Windows, Linux Ctrl+Shift+X)).
- Search for
'C++'. - Select Install.
Set up your C++ Environment
C++ is a compiled language meaning your program’s source code must be translated (compiled) before it can be run on your computer. The C/C++ extension doesn’t include a C++ compiler or debugger, since VS Code as an editor relies on command-line tools for the development workflow. You need to install these tools or use the tools already installed on your computer.
Check if you have a compiler installed
Note: There may already be a C++ compiler and debugger provided by your academic or work development environment. Check with your instructors or colleagues for guidance on installing the recommended C++ toolset (compiler, debugger, project system, linter).
Common compilers that already come preinstalled on some platforms are the GNU Compiler Collection (GCC) on Linux and the Clang tools with Xcode on macOS.
To check if you already have them installed:
-
Open a new VS Code terminal window using (⌃⇧` (Windows, Linux Ctrl+Shift+`))
-
Use the following command to check for the GCC compiler
g++:g++ --versionOr this command for the Clang compiler
clang:clang --version
The output should show you the compiler version and details. If neither are found, make sure your compiler executable is in your platform path (%PATH on Windows, $PATH on Linux and macOS) so that the C/C++ extension can find it. Otherwise, use the instructions in the section below to install a compiler.
Install a compiler
If you don’t have a compiler installed, you can follow one of our installation tutorials:
Windows:
Go to the MSVC tutorial
Go to the MinGW tutorial
Linux:
Go to the GCC tutorial
macOS:
Go to the Clang tutorial
Note: If you would prefer a full Integrated Development Environment (IDE), with built-in compilation, debugging, and project templates (File > New Project), there are many options available, such as the Visual Studio Community edition.
Example: Install MinGW-x64 on Windows
To understand the process, let’s install Mingw-w64 via MSYS2. Mingw-w64 is a popular, free toolset on Windows. It provides up-to-date native builds of GCC, Mingw-w64, and other helpful C++ tools and libraries.
-
Download using this direct link to the MinGW installer.
-
Run the installer and follow the steps of the installation wizard. Note, MSYS2 requires 64 bit Windows 8.1 or newer.
-
In the wizard, choose your desired Installation Folder. Record this directory for later. In most cases, the recommended directory is acceptable. The same applies when you get to setting the start menu shortcuts step. When complete, ensure the Run MSYS2 now box is checked and select Finish. A MSYS2 terminal window will then automatically open.
-
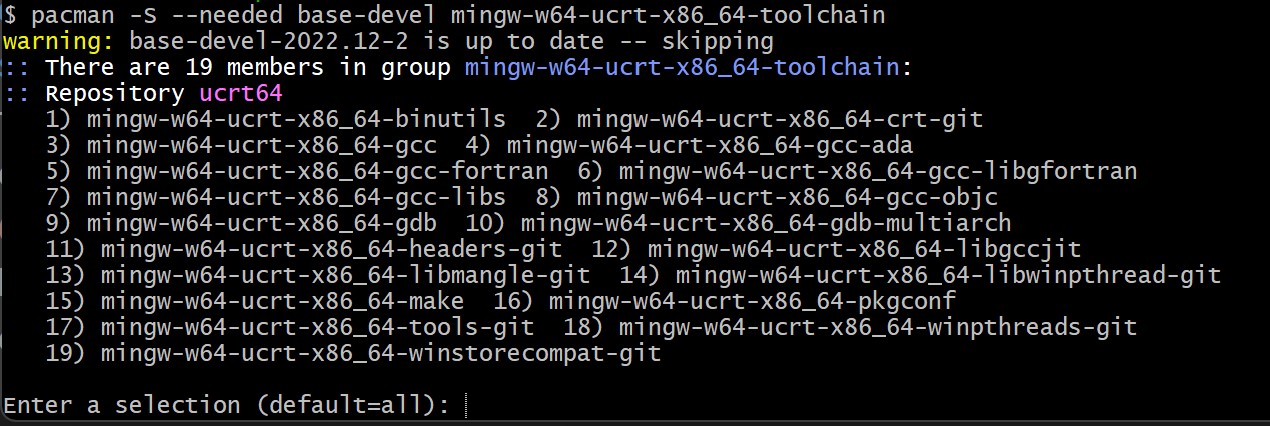
In this terminal, install the MinGW-w64 toolchain by running the following command:
pacman -S --needed base-devel mingw-w64-ucrt-x86_64-toolchain -
Accept the default number of packages in the
toolchaingroup by pressing Enter. -
Enter
Ywhen prompted whether to proceed with the installation. -
Add the path to your MinGW-w64
binfolder to the WindowsPATHenvironment variable by using the following steps:- In the Windows search bar, type Settings to open your Windows Settings.
- Search for Edit environment variables for your account.
- In your User variables, select the
Pathvariable and then select Edit. - Select New and add the MinGW-w64 destination folder you recorded during the installation process to the list. If you selected the default installation steps, the path is:
C:\msys64\ucrt64\bin. - Select OK to save the updated PATH. For the new
PATHto be available, reopen your console windows.
-
Check that your MinGW-w64 tools are correctly installed and available, open a new Command Prompt and type:
gcc --version
g++ --version
gdb --version
You should see output that states which versions of GCC, g++ and GDB you have installed. If this is not the case, make sure your PATH entry matches the Mingw-w64 binary location where the compiler tools are located or reference the troubleshooting section.
Create a Hello World App
To make sure the compiler is installed and configured correctly, lets create a Hello World C++ program.
Create a C++ file
- On Windows, launch a Windows command prompt (Enter Windows command prompt in the Windows search bar). On macOS and Linux, you can enter these commands in the terminal.
- Run the following commands. They are creating an empty folder called
projectswhere you can place all your VS Code projects. The next commands create and navigate you to a subfolder calledhelloworld. From there, you are openinghelloworlddirectly in VS Code using thecodecommand.
mkdir projects
cd projects
mkdir helloworld
cd helloworld
code .
The «code .» command opens VS Code in the current working folder, which becomes your «workspace». Accept the Workspace Trust dialog by selecting Yes, I trust the authors since this is a folder you created.
Now create a new file called helloworld.cpp with the New File button in the File Explorer or File > New File command.
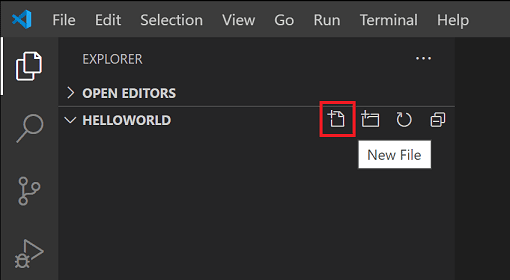
Add Hello World source code
Paste in the following source code:
#include <iostream>

int main()
{
    std::cout << "Hello World" << std::endl;
}
Now press ⌘S (Windows, Linux Ctrl+S) to save the file. You can also enable AutoSave to automatically save your file changes, by checking Auto Save in the main File menu.
Run helloworld.cpp
-
Make sure you have
helloworld.cppopen so it is the active file in your editor. -
Press the play button in the top right corner of the editor.
-
Choose C/C++: g++.exe build and debug active file from the list of detected compilers on your system.

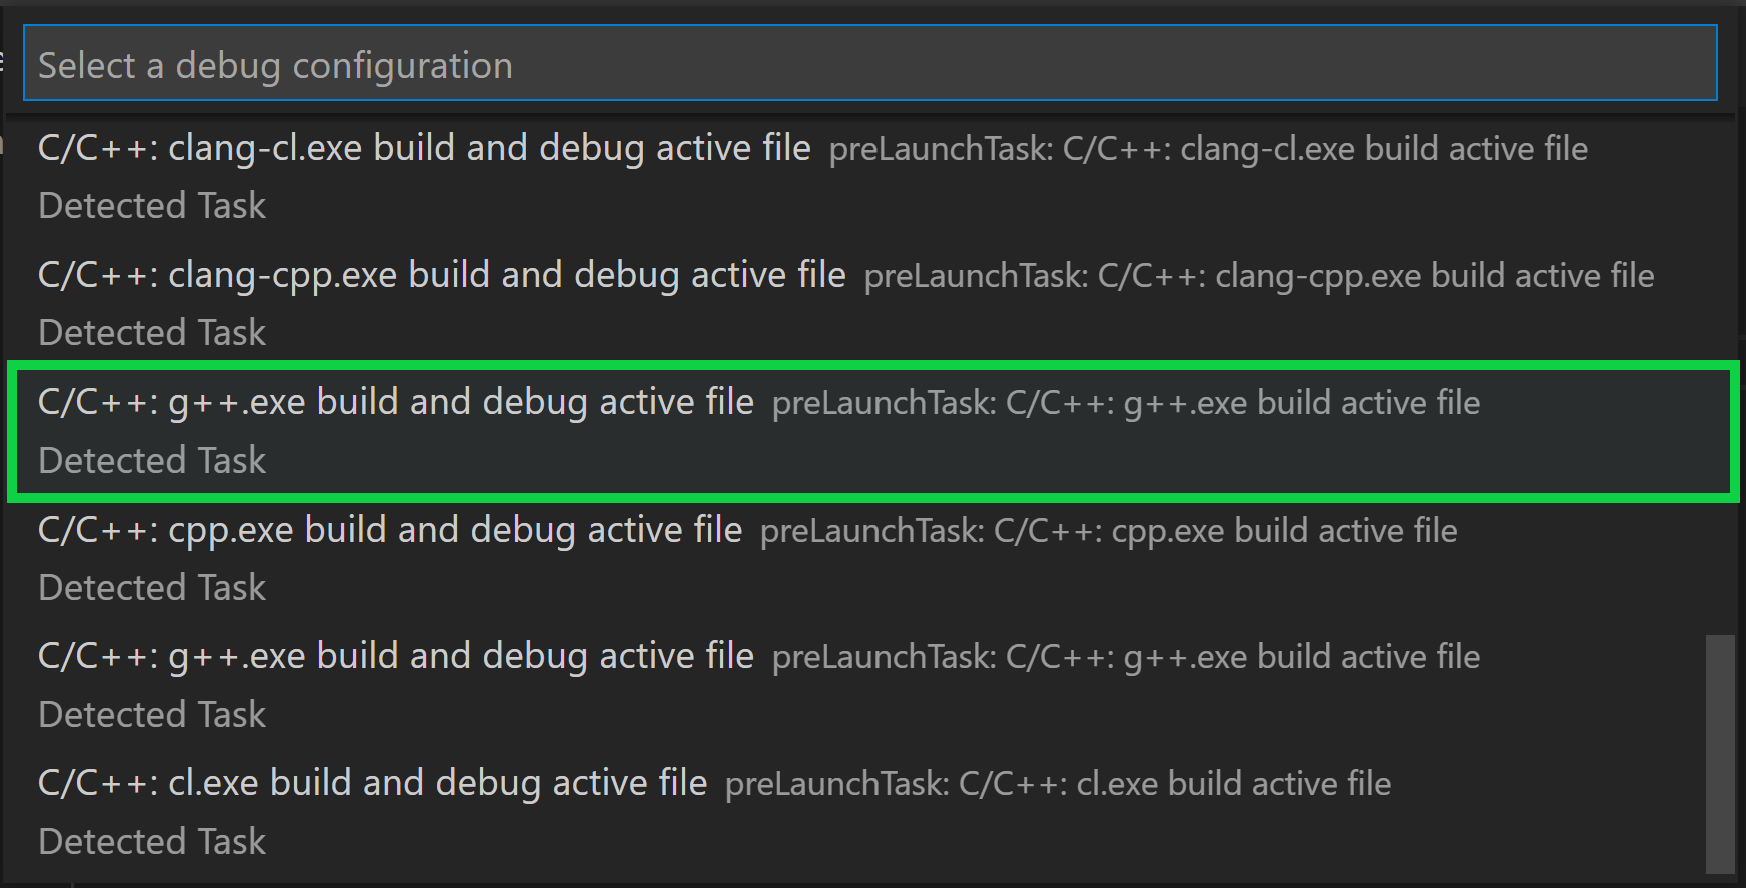
You are only prompted to choose a compiler the first time you run helloworld.cpp. This compiler becomes «default» compiler set in your tasks.json file.
-
After the build succeeds, you should see «Hello World» appear in the integrated Terminal.

Congratulations! You’ve just run your first C++ program in VS Code! The next step is to learn more about the Microsoft C/C++ extension’s language features such as IntelliSense, code navigation, build configuration, and debugging using one of the Tutorials in the next section.
Tutorials
Get started with C++ and VS Code with tutorials for your environment:
- GCC on Windows via MinGW
- Microsoft C++ on Windows
- GCC on Linux
- GCC on Windows Subsystem For Linux
- Clang/LLVM on macOS
- CMake Tools on Linux
Documentation
You can find more documentation on using the Microsoft C/C++ extension under the C++ section of the VS Code website, where you can find articles on:
- Debugging
- Editing
- Settings
- FAQ
Remote Development
VS Code and the C++ extension support Remote Development allowing you to work over SSH on a remote machine or VM, inside a Docker container, or in the Windows Subsystem for Linux (WSL).
To install support for Remote Development:
- Install the VS Code Remote Development Extension Pack.
- If the remote source files are hosted in WSL, use the WSL extension.
- If you are connecting to a remote machine with SSH, use the Remote — SSH extension.
- If the remote source files are hosted in a container (for example, Docker), use the Dev Containers extension.
Enhance completions with AI
GitHub Copilot is an AI-powered code completion tool that helps you write code faster and smarter. You can use the GitHub Copilot extension in VS Code to generate code, or to learn from the code it generates.

GitHub Copilot provides suggestions for numerous languages and a wide variety of frameworks, and it works especially well for Python, JavaScript, TypeScript, Ruby, Go, C# and C++.
You can learn more about how to get started with Copilot in the Copilot documentation.
Feedback
If you run into any issues or have suggestions for the Microsoft C/C++ extension, please file issues and suggestions on GitHub. If you haven’t already provided feedback, you can take this quick survey.
7/24/2023
Visual Studio Code (or VS Code for short) is a very common and widely used text editor and IDE (Integrated Development Environment). You can make VS Code very powerful like an IDE using a lot of extensions.
Before approaching the process of running your first C or C++ code on Visual Studio Code, let me guide you through the process and get it all set up based on the operating system you are using on your computer.
C and C++ compilers
For running C or C++ code, you just need to have a valid C/C++ compiler installed on your computer. If you are using a Linux operating system, then there is a high chance that it is already installed on your system. But we need to make sure that it is correctly installed.
For checking whether or not you have the compiler (GCC/G++/MinGW) installed on your system or not, you have to check the compiler version first.
Simply open your terminal and use gcc --version and g++ --version. If you get the version number, then the compiler is already installed on your system.
You can check the version using the same commands on any operating system, whether that is a Windows, Linux, or macOS-based operating system.
If you get feedback on your terminal that it does not know anything about GCC or G++, then you have to install the compiler correctly.
If you are using the most used Windows operating system, then I already have written an in-depth article showing you all the processes step-by-step on freeCodeCamp. Make sure to read the entire article first, as it also contains a complete video to provide you with complete support.
How to Install C and C++ Compilers on Windows
If you want to run C or C++ programs in your Windows operating system, then youneed to have the right compilers. The MinGW compiler is a well known and widely used software for installing GCCand G++ compilers for the C and C++ programming languages. But many devs face difficulties when install…
![]() Md. Fahim Bin AminfreeCodeCamp.org
Md. Fahim Bin AminfreeCodeCamp.org
If you are using another operating system, and you don’t have the compilers installed, then make sure to install them before proceeding.
How to Install VS Code or VS Code Insiders
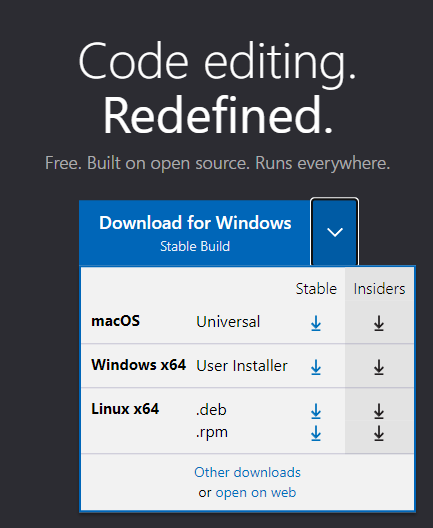
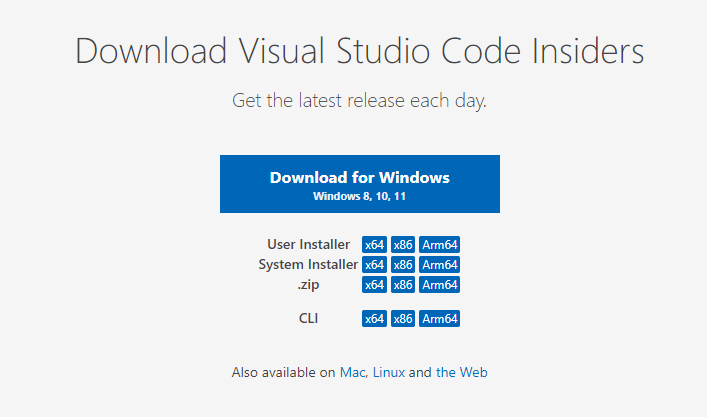
You have to download Visual Studio Code directly from the official website: https://code.visualstudio.com/.
If you want, you can also install VS Code Insiders, and the same process is applicable for that as well.
Visual Studio Code Insiders is actually the «Insiders» build of Visual Studio Code, which contains all the latest features that are shipped daily. You can think of VS Code as the stable release and the VS Code Insiders as the Insiders release of that.
If you want to experience the latest updates instantly, then you might also try Visual Studio Code Insiders (I use it myself). For downloading VS Code Insiders, you can visit the official website for VS Code Insiders here: https://code.visualstudio.com/insiders/
Make sure to download the exact file for your operating system.
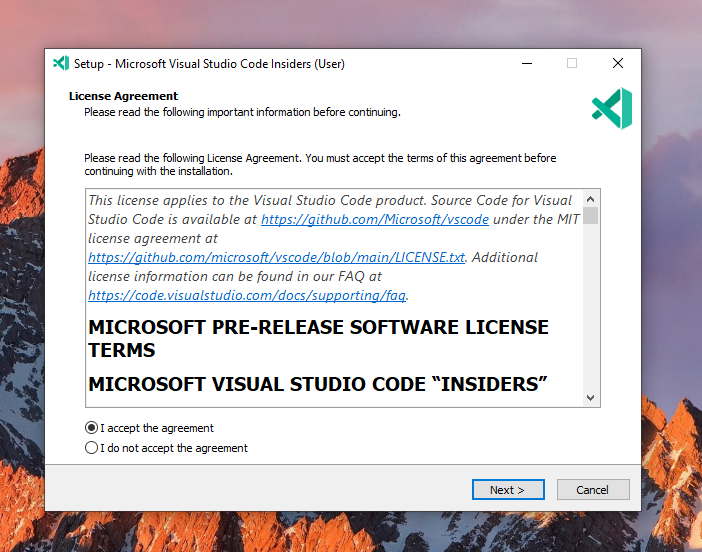
The installation process is pretty basic. But I am going to show you all the steps sequentially. For now, I am going to show you the installation process using VS Code Insiders, but everything you will see here is going to be exactly the same for VS Code as well.
Make sure to click the box on the «I accept the agreement » box and click on Next.
Keep everything as it is. Do not change anything from here.
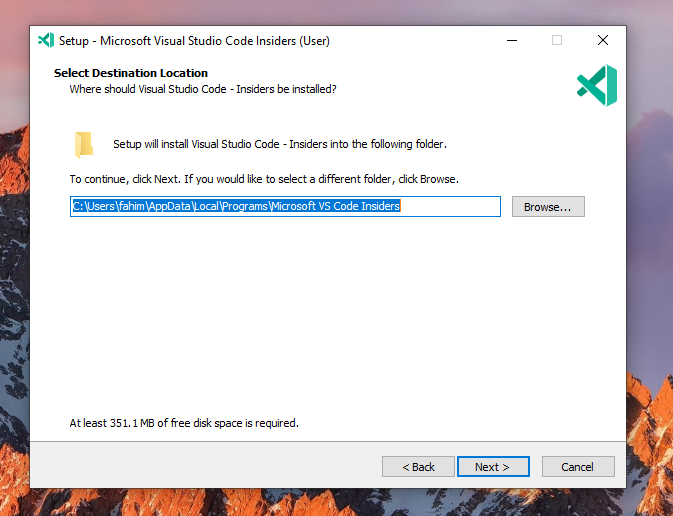
Click Next. Again, simply click Next.
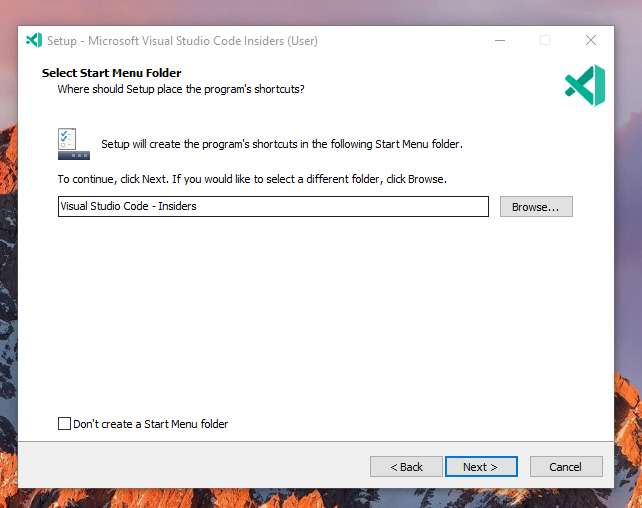
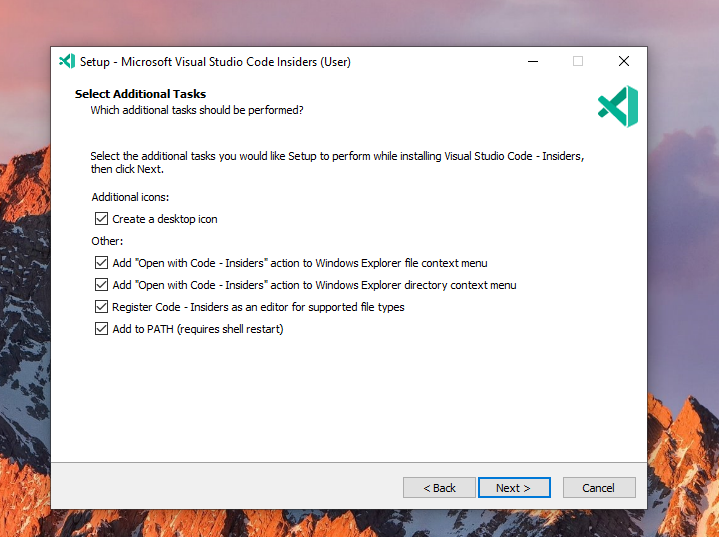
Make sure to add the checkmark (✔) on all of the boxes. Then click on Next.
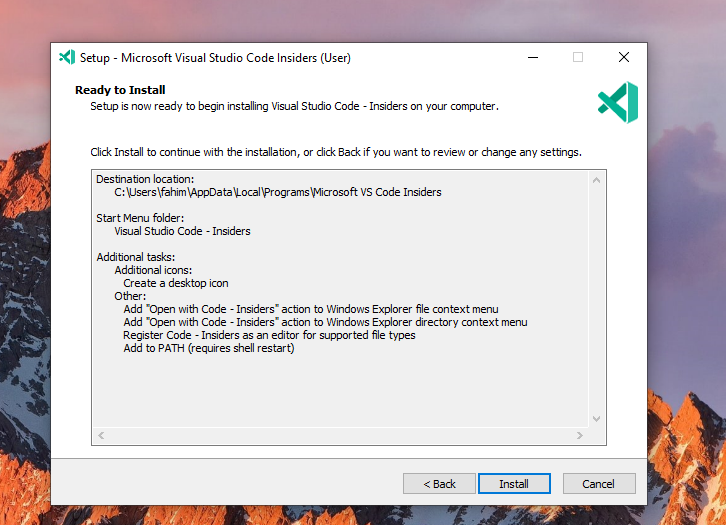
Click on Install.
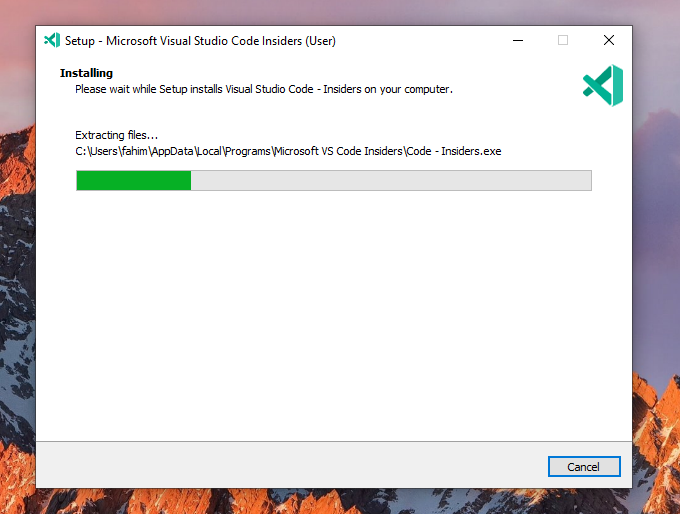
It might take a little time to finish the installation.
Click on Finish.
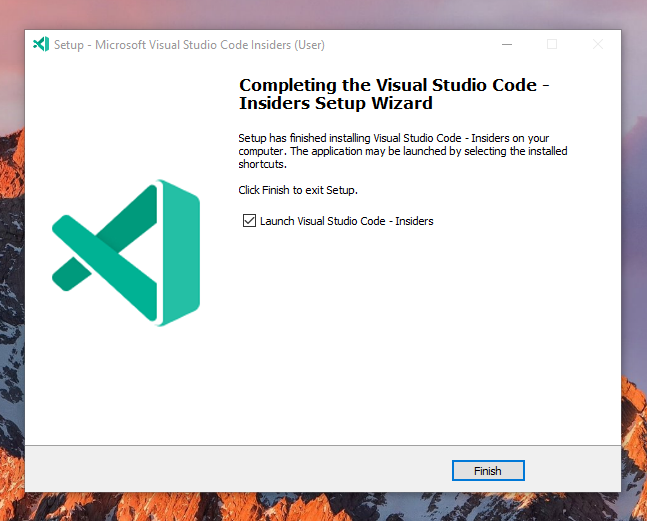
Congrats — you’ve successfully installed VS Code/VS Code Insiders on your system. Now, cheers! 🥂
How to Prepare VS Code/VS Code Insiders For C and C++ Code
First, open VS Code or VS Code Insiders.
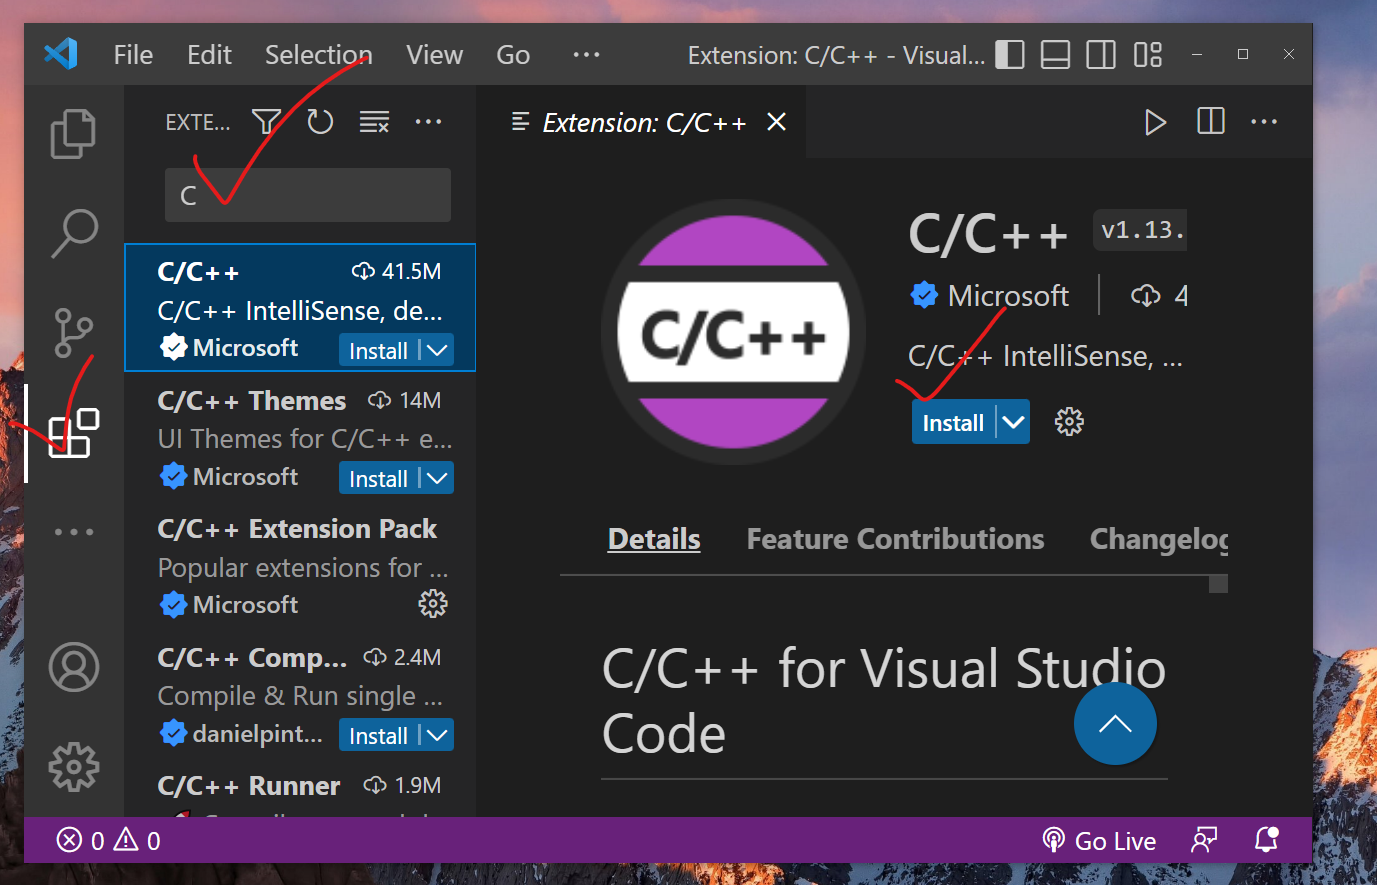
Go to the Extension tab. Search for «C» or «C++» and install the first one that is already verified by Microsoft itself.
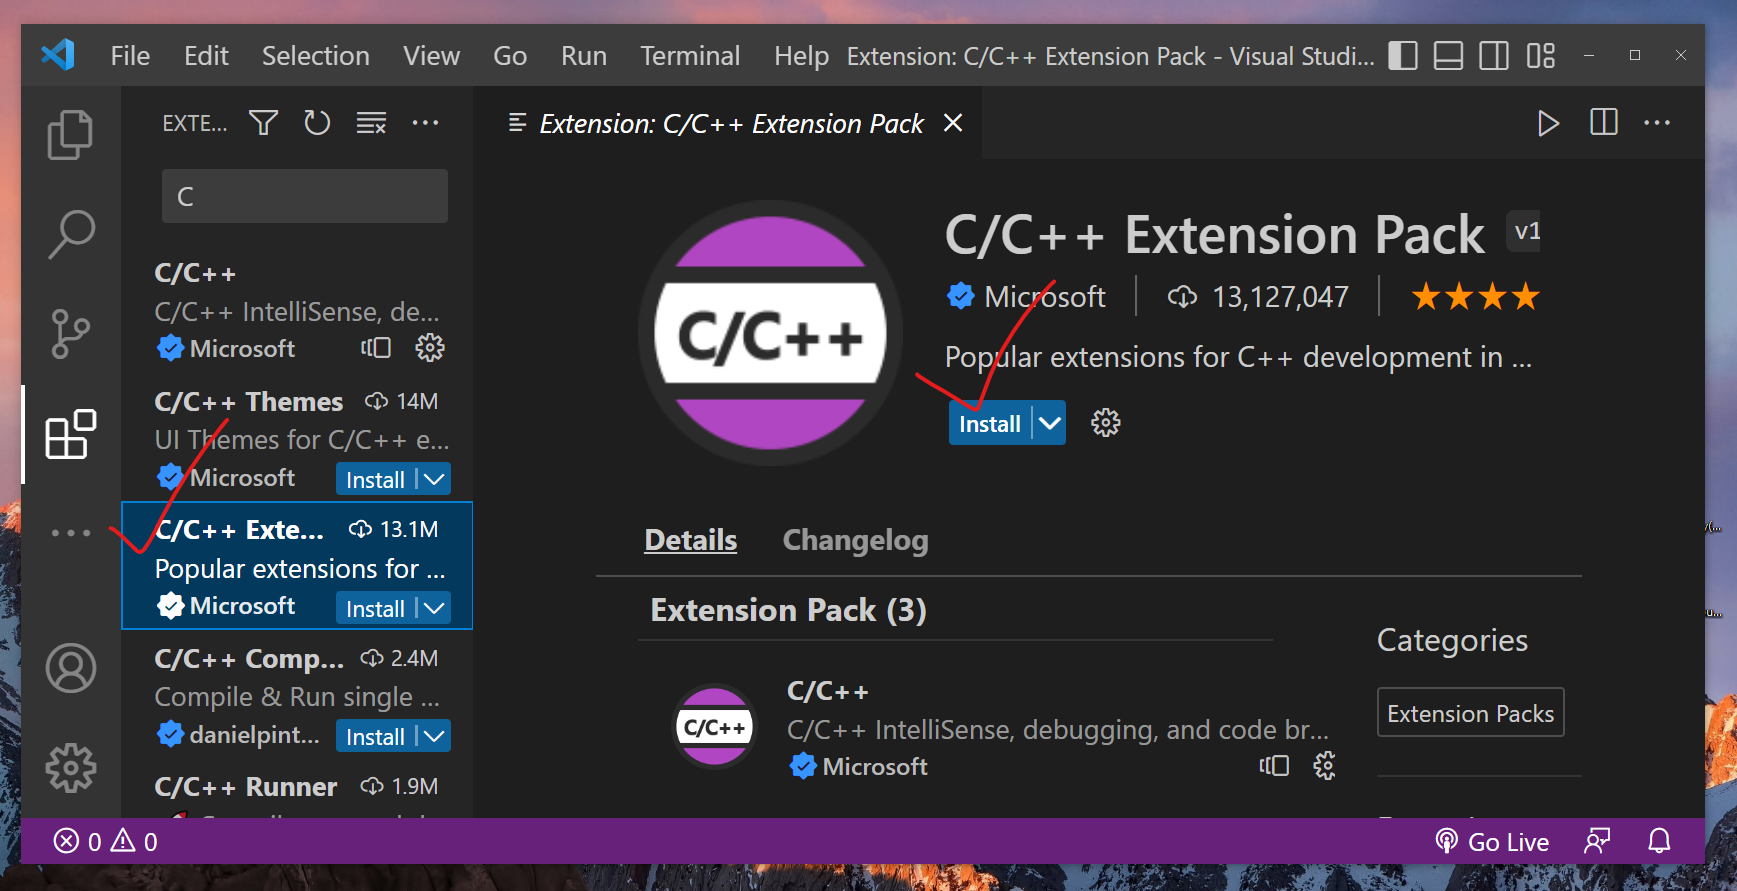
Also, install C/C++ Extension Pack. It should also be verified by Microsoft.
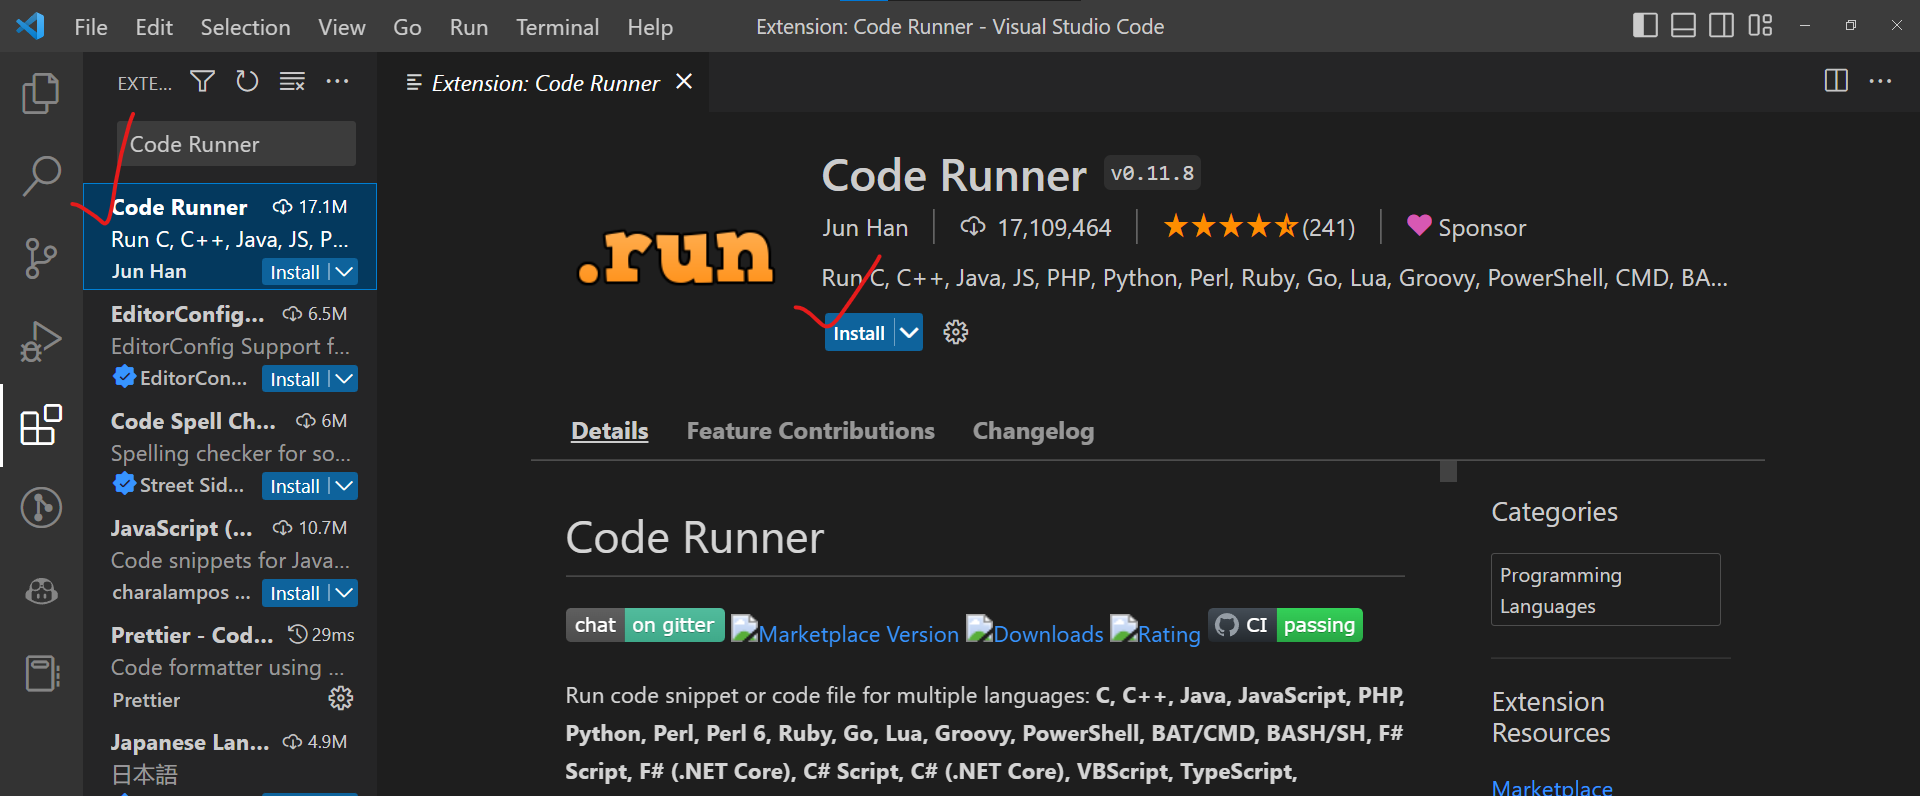
Then you have to search for Code Runner and install the extension as well.
Now, we need to change some settings.
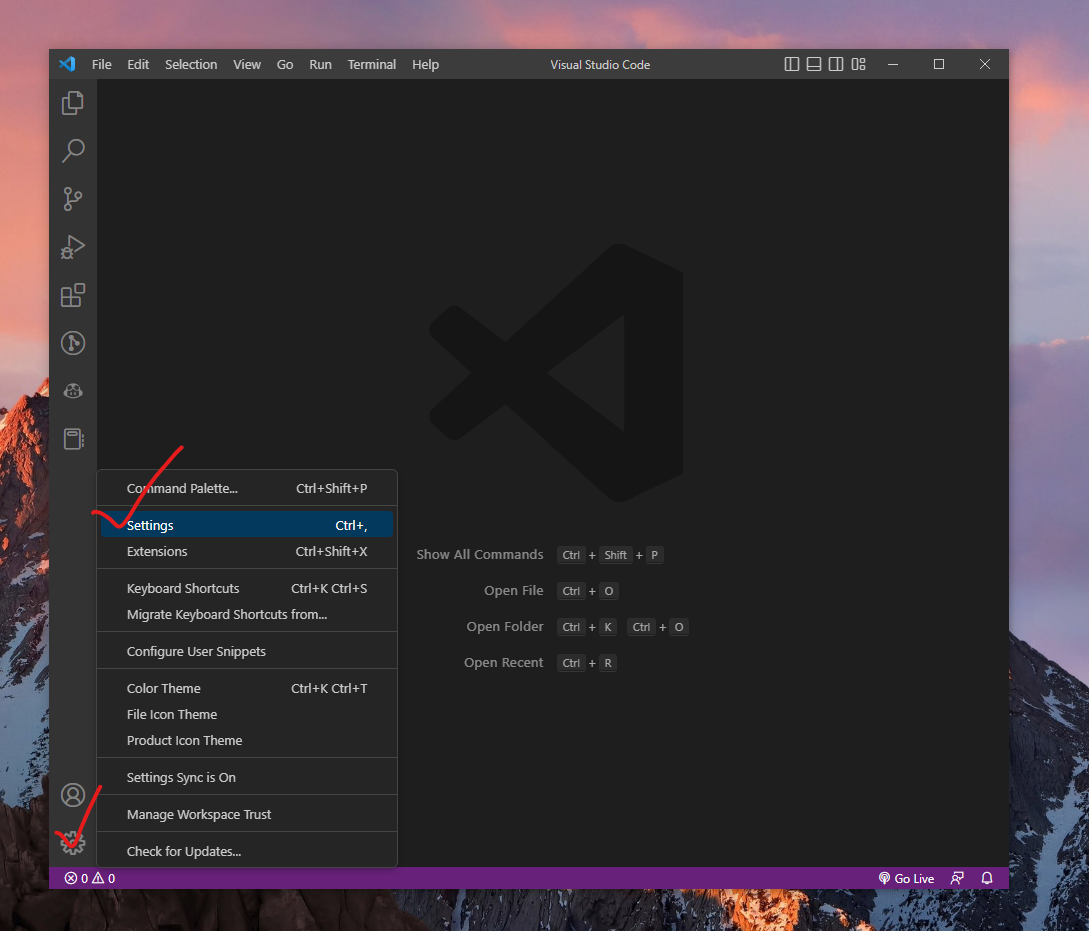
Click the gear box (It is called the Manage section), and then click Settings. Alternatively, you can also use the shortcut keys Ctrl + ,. You need to replace the Ctrl key with the Command key for Mac.
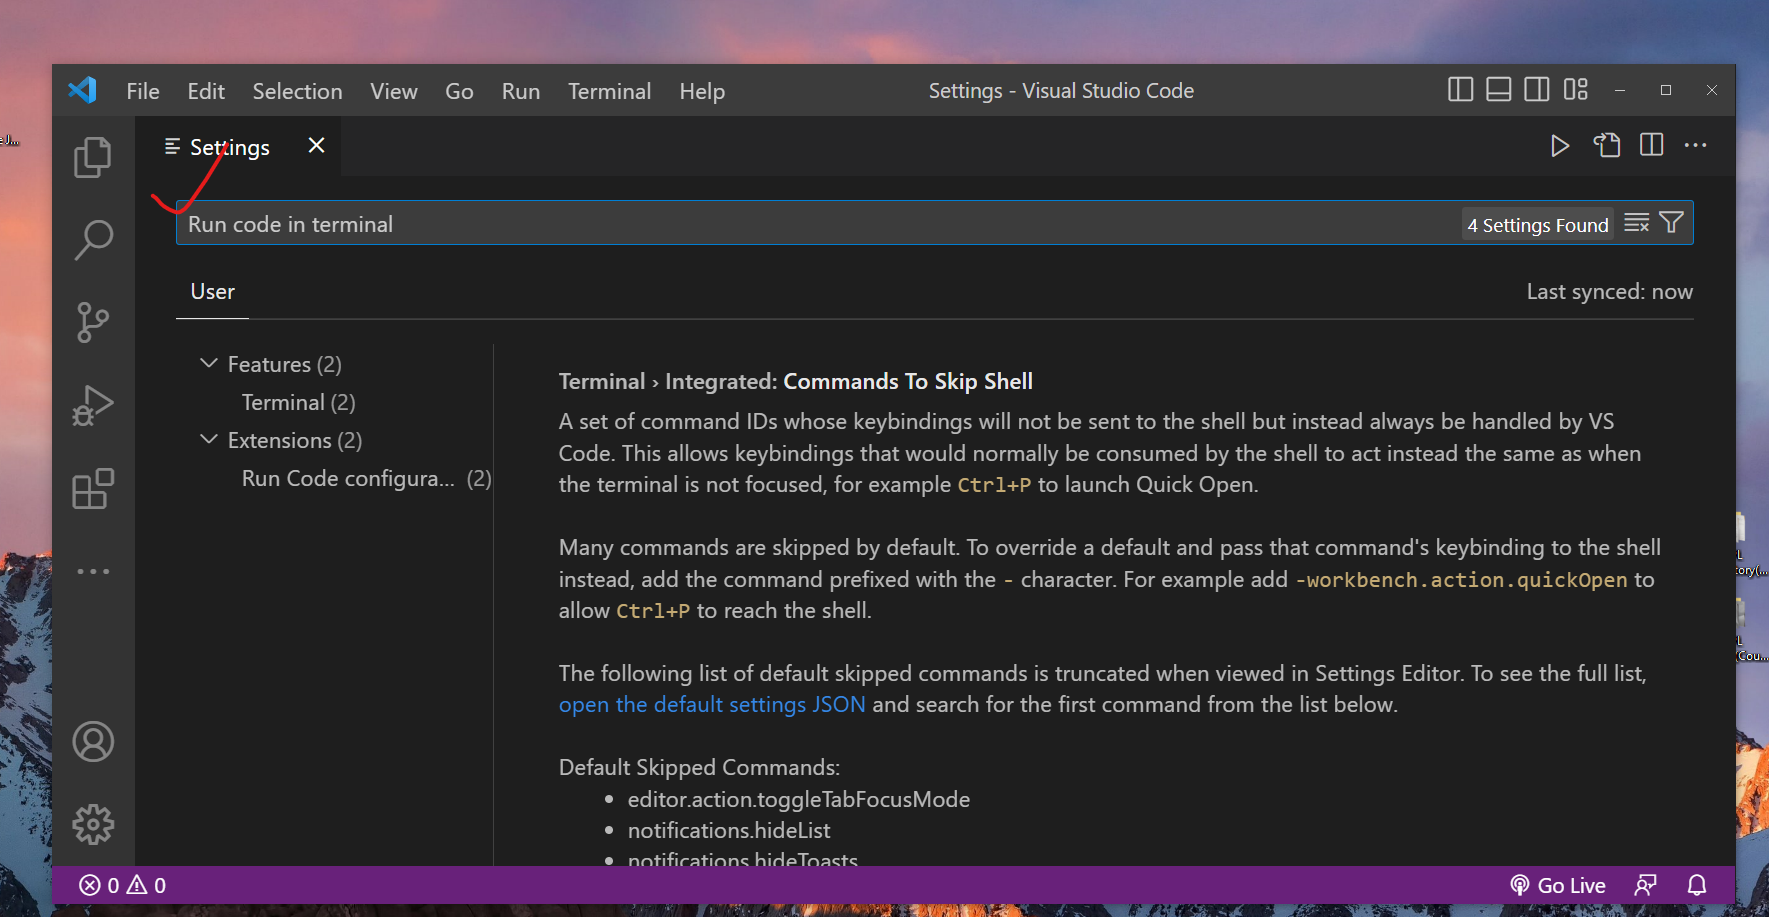
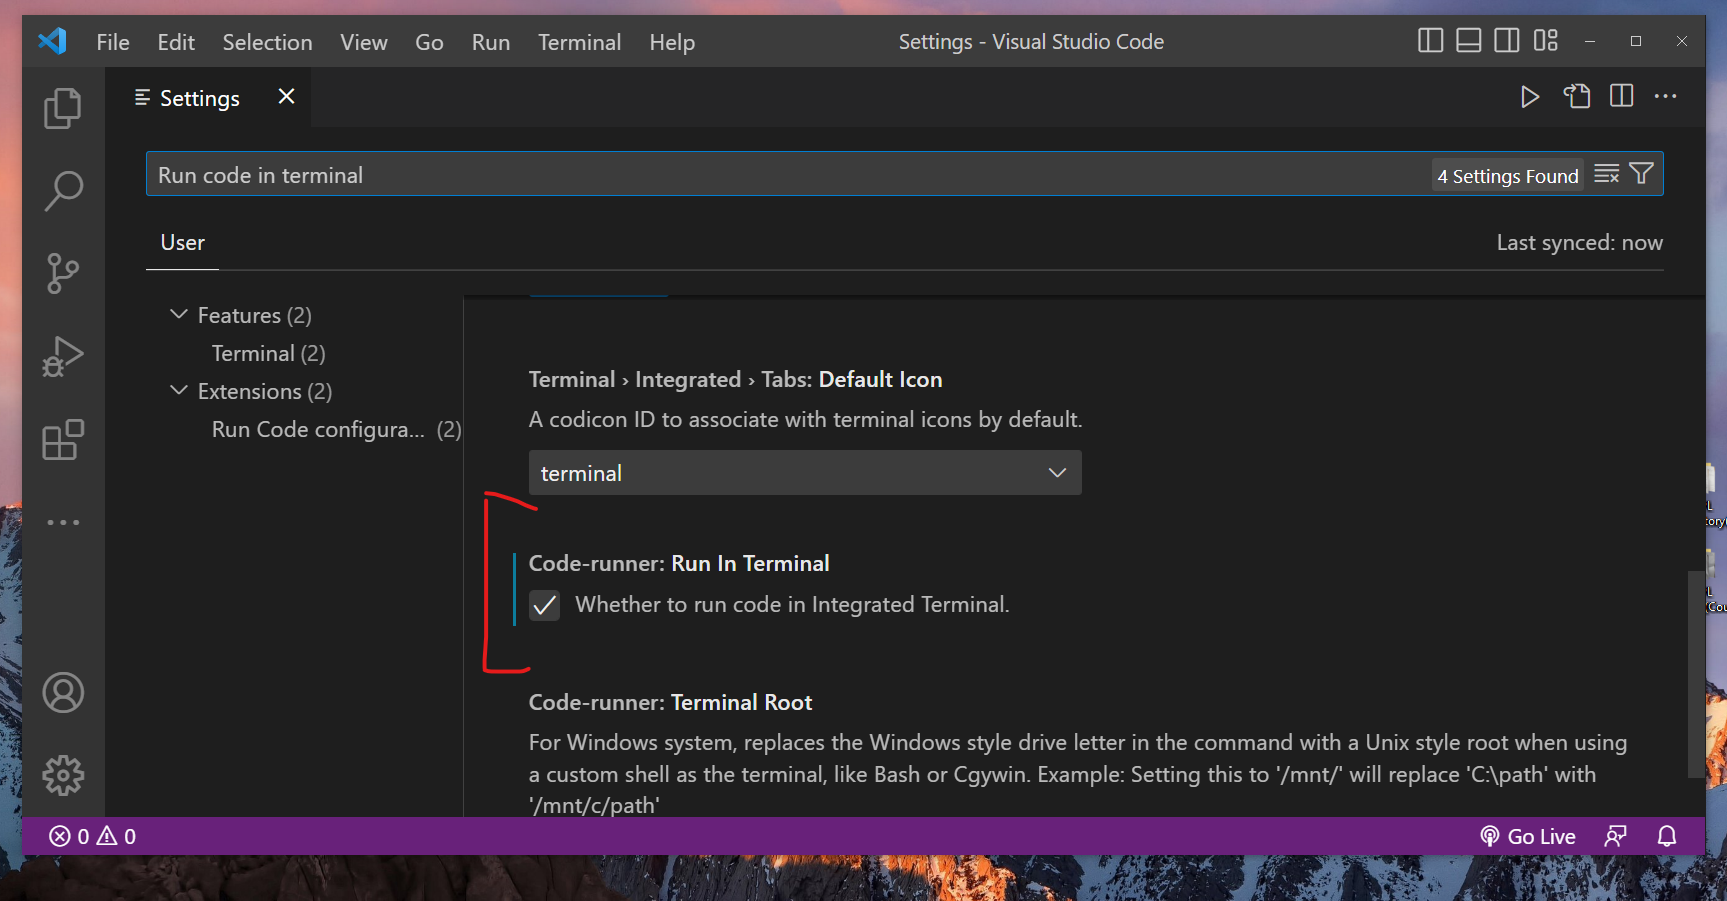
In the search bar, type «Run code in terminal» and press the Enter key.
Scroll down a little bit until you find Code-runner: Run In Terminal. Make sure that the box is checked (✔).
Now you need to restart your VS Code/VS Code Insiders. Simply close and reopen the program.
How to Test Your Code
Simply open VS Code/VS Code Insiders, open any folder, and create any file with the extension .c for the C file and .cpp for the C++ file.
After writing your code, you can run the code directly using the play button you’ll find in the upper right corner.
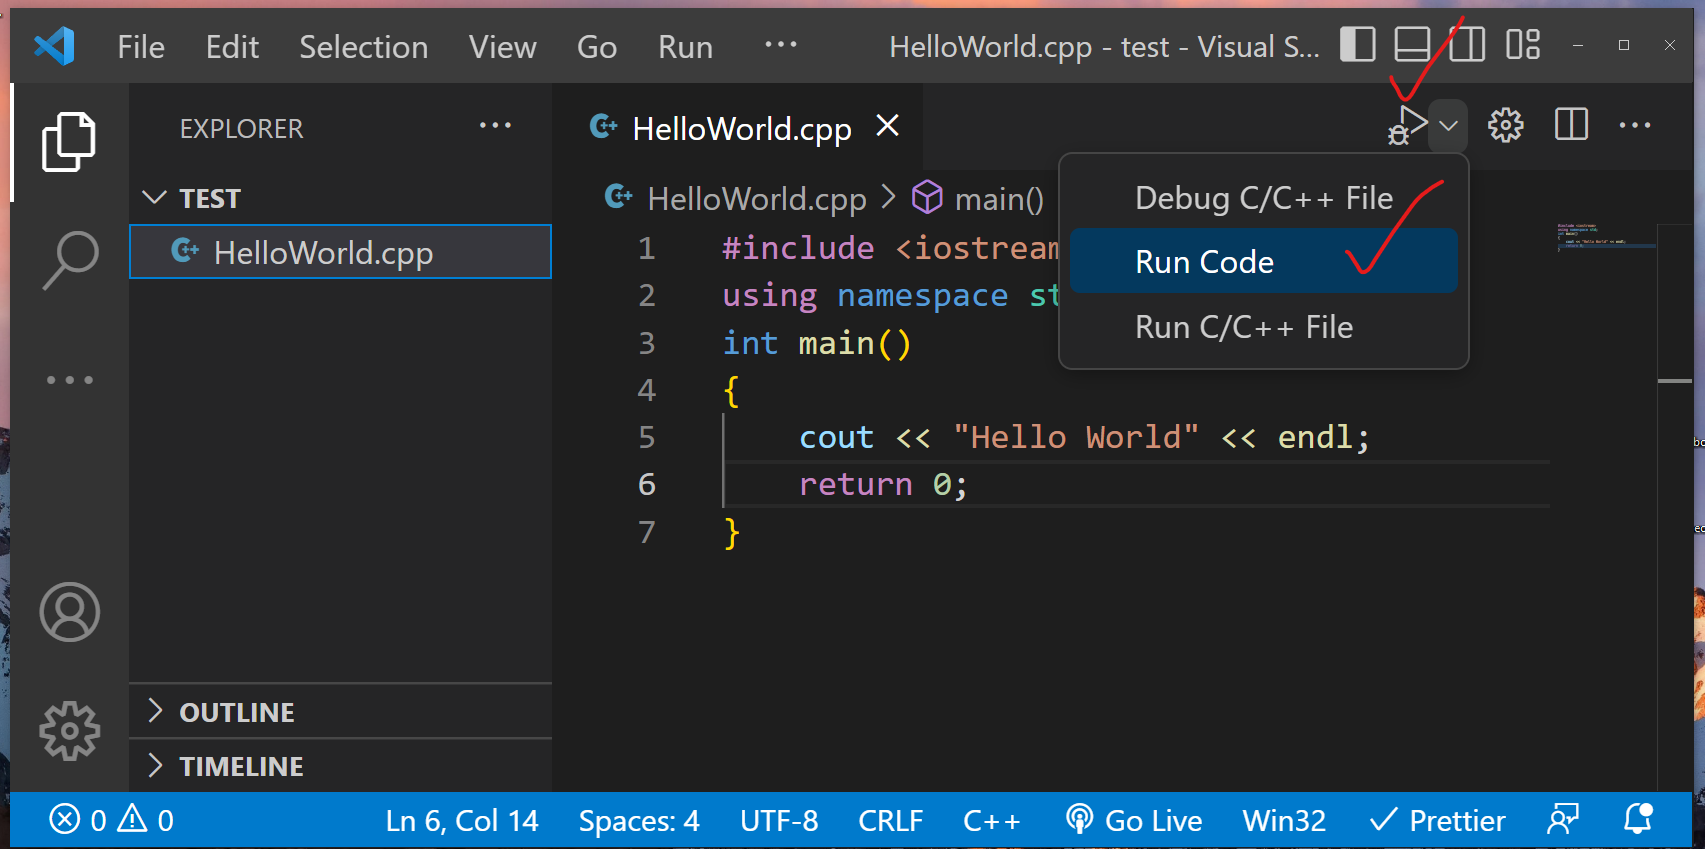
It will compile and then run the code directly. After running a code, the code runner button would be set default to run directly. So, your computer is 100% ready for compiling and running any C/C++ programming code. 😀
Conclusion
Thanks for reading the entire article. If it helps you then you can also check out other articles of mine at freeCodeCamp.
If you want to get in touch with me, then you can do so using Twitter, LinkedIn, and GitHub.
You can also SUBSCRIBE to my YouTube channel (Code With FahimFBA) if you want to learn various kinds of programming languages with a lot of practical examples regularly.
If you want to check out my highlights, then you can do so at my Polywork timeline.
You can also visit my website to learn more about me and what I’m working on.
Thanks a bunch!
Learn to code for free. freeCodeCamp’s open source curriculum has helped more than 40,000 people get jobs as developers. Get started
Прежде чем
двигаться дальше, нам нужно настроить рабочее место для написания программ на
Си. А, именно, установить (если его еще нет) компилятор и интегрированную среду
разработки для написания, компиляции и отладки программ. Начнем с выбора и
установки компилятора. На сегодняшний день одним из самых популярных является
компилятор gcc. Это сокращение
от:
GNU Compiler Collection
Если вы
работаете под ОС Linux, то, этот компилятор должен быть уже
установлен в системе. Если же вы работаете под ОС Windows, то компилятор
нужно устанавливать самим. Давайте это сделаем.
Так как я
работаю под ОС Windows, то буду показывать порядок установки
всех средств именно на этой ОС. Итак, первым делом нужно перейти на официальный
сайт компилятора gcc, предназначенных для ОС Windows:
https://gcc.gnu.org
Далее, переходим
в раздел Download/Binaries (бинарники) и
видим несколько вариантов способов установки gcc на систему. Наиболее
удобный, на мой взгляд, является использование, так называемого, порта MinGW с установкой
только необходимых (минимального набора) компонент компилятора gcc.
Здесь есть два
варианта MinGW: старый
32-битный и новый – 64-битный. Я рекомендую воспользоваться старым вариантом,
т.к. он хорошо себя зарекомендовал и, что называется, проверен временем. С
новым могут возникать проблемы, да и для языка Си стандарта C99 он явно
избыточен.
Нажимаем на
ссылку MinGW и нас
перенаправляют на страницу:
https://osdn.net/projects/mingw/
и здесь нам
нужно скачать установщик mingw-get-setup.exe.
Запускаем эту
программу. Появится следующее диалоговое окно:
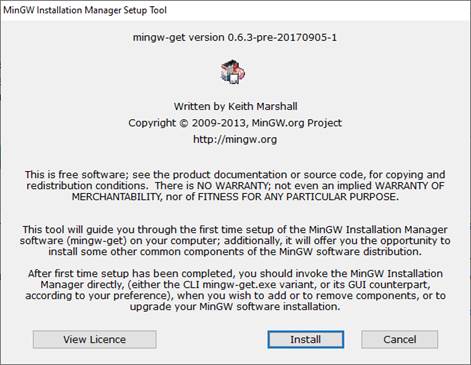
Нажимаем здесь
кнопку «Install». В следующем
окне соглашаемся со всеми настройками по умолчанию, в том числе и с маршрутом
распаковки «C:\MinGW» (если вас он
не устраивает, то можете изменить на свой) и нажимаем на кнопку «Continue». Начнется
скачивание и установка. После установки этот инсталлятор автоматически
запустится:
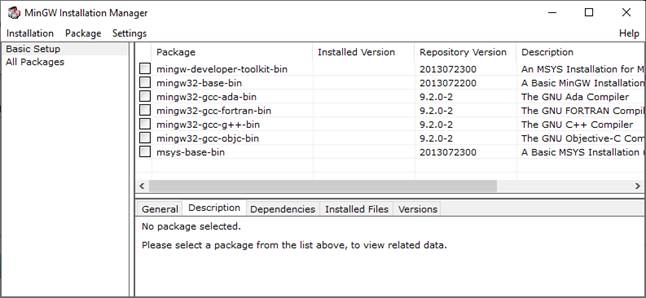
В диалоговом
окне нам нужно выбрать все необходимые компоненты для установки компилятора gcc для языка Си. Они
следующие:
- mingw32-gcc-bin (после отметки
также дополнительно отмечаются другие компоненты, с которыми mingw32-gcc-bin работает
совместно); - mingw32-gcc-g++-bin (для установки
линкера для компилятора Си); - mingw32-make-bin;
- mingw32-gdb-bin (дебаггер, для
отладки кода).
После этого в
меню «Installation» выбираем пункт
«Apply Changes» и в окне
нажимаем кнопку «Apply»:

Начнется
установка выбранных компонент для компилятора gcc в указанный
каталог.
Далее, нужно
прописать в системе путь к каталогу компилятора gcc. Для этого
нажимаем правую кнопку мыши на кнопке «Пуск» и выбираем «система». В
появившемся диалоговом окне щелкаем на «Дополнительные параметры системы», и
затем «Переменные среды…». Появится еще одно диалоговое окно, в котором нас
будет интересовать системная переменная Path:
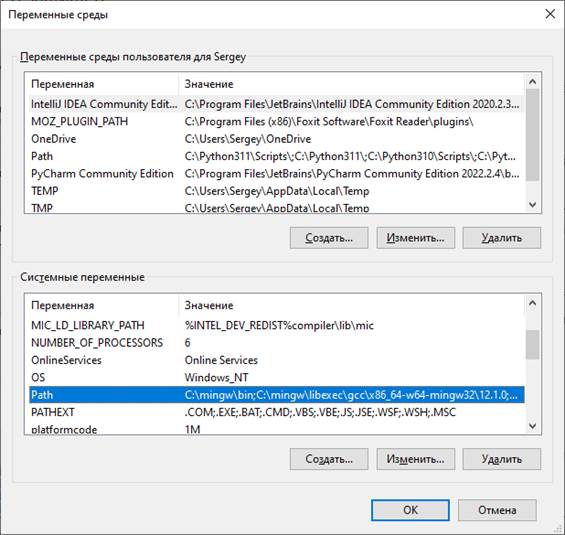
Два раза щелкаем
по строчке с переменной Path, появится следующее окно, в котором
следует добавить путь «C:\mingw\bin» в переменную Path.
Все, компилятор gcc установлен в ОС Windows и готов к
работе. Чтобы в этом убедиться, откроем командное окно (комбинация Win+R, набираем cmd и кнопка «OK»), набираем в
нем gcc и должны
увидеть следующие строчки:
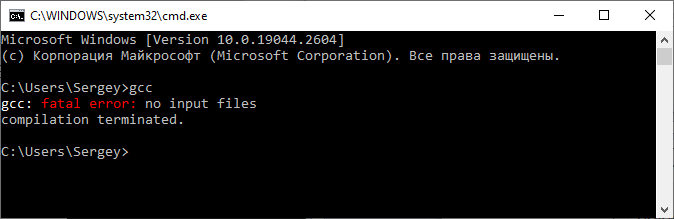
Если у вас все
отображается именно так, то компилятор был успешно установлен.
Установка и настройка Visual Studio Code
Следующим шагом
нам нужно установить интегрированную среду для написания, компиляции и отладки
наших программ написанных на языке Си. Для этого, на мой взгляд, удобно
воспользоваться программой Visual Studio Code, доступной на
странице официального сайта:
https://code.visualstudio.com
Именно в ней я
буду писать и показывать все тексты программ данного курса. При желании, вы,
конечно, можете использовать любую другую среду, главное, чтобы в ней было
удобно компилировать и отлаживать программы на Си.
Первым делом,
конечно же, нужно скачать дистрибутив программы Visual Studio Code и установить
себе на компьютер. Ничего сложно в этом нет. Далее, открываем эту программу.
Для начала работы нам нужно определиться, где будут располагаться файлы
текущего проекта. Делается это очень просто. На диске в любом желаемом месте
создается папка, которая, затем, выбирается в программе VS Code. В моем случае
– это путь:
D:\Visual
Studio\Code\course
У вас может быть
любой другой. Сейчас каталог пустой. Поэтому для начала работы в него нужно
поместить файл, в котором будем писать текст программы. Например, его можно
назвать так:
lessons.c
Обратите
внимание, файл с текстом программы на языке Си должен иметь расширение «c». Теперь здесь
можно написать простую программу. Пусть это будет классический «Hello, world!»:
#include <stdio.h>

int main(void)
{
    printf("Hello, world\n");
    return 0;
}
Не беспокойтесь
пока о том, что содержимое этой программы вам, возможно, непонятно. Ее мы
подробно еще будем разбирать. Пока, на этом этапе, нам нужно просто настроить
среду разработки для компиляции и запуска программ на Си.
По идее, мы уже
сейчас можем достаточно просто скомпилировать эту программу. Для этого нажимаем
Ctrl + ~, появится
окно powershell и в нем вручную
можно вызвать компилятор gcc следующим образом:
gcc lessons.c
Если мы все
сделали правильно, то в текущем каталоге появится исполняемый файл a.exe, который
выводит в консоль сообщение «Hello, world!»:
.\a
Конечно,
постоянно выполнять компиляцию через терминал очень неудобно, поэтому нам нужно
настроить редактор VS Code под компиляцию
Си-программ. Для этого необходимо установить некоторые полезные расширения (extensions). Щелкаем слева
на кнопку с квадратиками и в поиске набираем «c lange»:
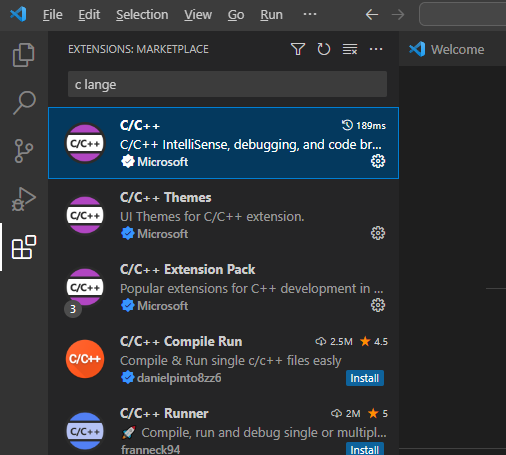
Выбираем первый
компонент C/C++ компании Microsoft, которая
позволяет выполнять разработку программ на языке Си.
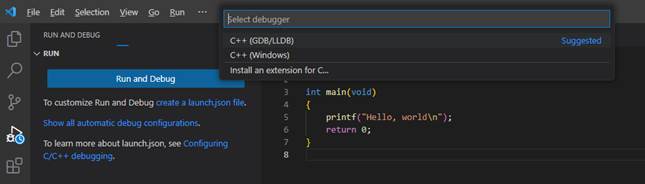
После этого,
слева щелкаем на кнопку с треугольником (Run and Debug) и нажимаем на
кнопку «Run and Debug». Сверху в
выпадающем списке следует выбрать «C++ (GDB/LLDB)» (это ранее
установленный компилятор gcc), затем, скомпилировать и выполнить
программу в режиме Debug (отладки):
Например, можно
поставить в любом месте программы точку останова, снова запустить, и программа
остановится на выбранной строке. Это, как раз и есть процесс отладки кода.
Далее установим
еще одно расширение, которое будет отвечать за простой процесс запуска кода без
режима отладки. Чтобы можно было быстро и просто запустить программу и
посмотреть, что получается. Для этого переходим на вкладку «extensions» и набираем:
code runner
Это расширение
позволяет с помощью комбинации клавиш Ctrl+Alt+N компилировать и запускать
код. Результат отображается во вкладке «OUTPUT».
Настройка компилятора на стандарт C99
Последнее, что
нам осталось – это настроить компилятор на стандарт C99. Формально,
это делается с помощью специального флага -std следующим
образом:
gcc
-std=c99 -o outputfile sourcefile.c
Такой флаг нам
нужно добавить в настройках компилятора. Первым делом откроем файл tasks.json в
текущем каталоге и пропишем для ключа «args» первым
элементом этот ключ:
«args»: [
«-std=c99»,
…
]
Этот флаг будет
срабатывать при перекомпиляции проекта – комбинация клавиш Ctrl+Shift+B.
Точно такой же
ключ нужно добавить для компилятора, используемого расширением «Code Runner». Для этого переходим в меню File->Preferences->Settings и в строке набираем «code
runner run in terminal». Ставим
галочку.
Затем, в этом же
окне настроек набираем в строке «Run Code Configuration». Находим в настройках
раздел «Code-runner: Executor Map» и нажимаем на редактирование. Для ключа «c» после «gcc» прописываем «-std=c99» и ключ «code-runner.runInTerminal» устанавливаем в
false. Все, теперь
компилятор будет ориентироваться на стандарт c99 при
компиляции наших программ.
Видео по теме
October 24th, 2016
Did you know that you can build and debug C++ projects in Visual Studio Code with your compiler and debugger of choice? Although VS Code is a light-weight editor, you can set it up to resemble a full IDE, customizing IntelliSense, build, and debug configurations for your environment.
There are two recommended approaches for building a C++ application in VS Code:
- Build with VS Code tasks
- Build with the CMake Tools extension
If your project uses CMake, we recommend the CMake Tools extension for viewing, building, and debugging CMake targets. If you aren’t using CMake, you can define VS Code build tasks in tasks.json, which invoke your compiler of choice.
Build with VS Code tasks
Watch this three-minute video tutorial to learn how to create a C++ build task in VS Code! This video shows how to invoke Clang on macOS, and the Hello World document tutorials below call out the specifics for other platforms.
Hello World tutorials
- GCC on Linux
- GCC on Windows Subsystem for Linux
- GCC on Windows
- Microsoft C++ on Windows
- Clang on macOS
Build with the CMake Tools extension
If you build your project with CMake, you should use the CMake Tools extension to seamlessly view, build, and debug CMake targets in VS Code. Check out this Hello World tutorial for building a CMake project with CMake Tools.
Remote building
If you’d like to build a C++ application remotely, VS Code provides a ton of options, including remote-SSH, containers, WSL, and Codespaces. Check out this overview of remote development in VS Code to learn more!
What do you think?
Download the C++ extension for Visual Studio Code today, give it a try, and let us know what you think. If you run into any issues, or have any suggestions, please report them in the Issues section of our GitHub repository. You can also join our Insiders program and get access to early builds of our release by going to File > Preferences > Settings and under Extensions > C/C++, change the “C_Cpp: Update Channel” to “Insiders”.
We can be reached via the comments below or in email at visualcpp@microsoft.com. You can also find our team on Twitter at @VisualC