After you have set up the basics of your debugging environment as specified in the configuration tutorials for each target compiler/platform, you can learn more details about debugging C/C++ in this section.
Visual Studio Code supports the following debuggers for C/C++ depending on the operating system you are using:
- Linux: GDB
- macOS: LLDB or GDB
- Windows: the Visual Studio Windows Debugger or GDB (using Cygwin or MinGW)
Windows debugging with GDB
You can debug Windows applications created using Cygwin or MinGW by using VS Code. To use Cygwin or MinGW debugging features, the debugger path must be set manually in the launch configuration (launch.json). To debug your Cygwin or MinGW application, add the miDebuggerPath property and set its value to the location of the corresponding gdb.exe for your Cygwin or MinGW environment.
For example:
"miDebuggerPath": "c:\\mingw\\bin\\gdb.exe"
Cygwin/MinGW debugging on Windows supports both attach and launch debugging scenarios.
To learn more, see Configure C/C++ debugging.
If you are debugging with GDB on Windows, see Windows Debugging with MinGW64.
Conditional breakpoints
Conditional breakpoints enable you to break execution on a particular line of code only when the value of the condition is true. To set a conditional breakpoint, right-click on an existing breakpoint and select Edit Breakpoint. This opens a small peek window where you can enter the condition that must evaluate to true in order for the breakpoint to be hit during debugging.
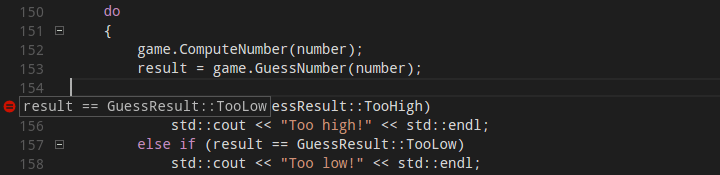
In the editor, conditional breakpoints are indicated by a breakpoint symbol that has a black equals sign inside of it. You can place the cursor over a conditional breakpoint to show its condition.
Function breakpoints
Function breakpoints enable you to break execution at the beginning of a function instead of on a particular line of code. To set a function breakpoint, on the Run view right-click inside the Breakpoints section, then choose Add Function Breakpoint and enter the name of the function on which you want to break execution.
Expression evaluation
VS Code supports expression evaluation in several contexts:
- You can type an expression into the Watch section of the Run view and it will be evaluated each time a breakpoint is hit.
- You can type an expression into the Debug Console and it will be evaluated only once.
- You can evaluate any expression that appears in your code while you’re stopped at a breakpoint.
Expressions in the Watch section take effect in the application being debugged; an expression that modifies the value of a variable will modify that variable for the duration of the program.
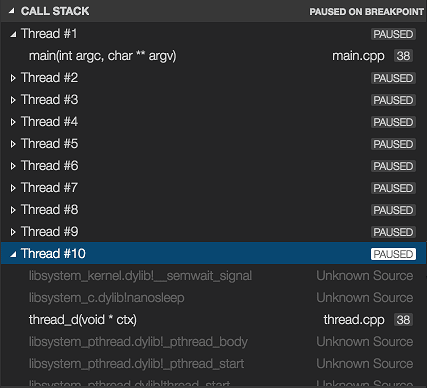
Multi-threaded debugging
The C/C++ extension for VS Code has the ability to debug multi-threaded programs. All threads and their call stacks appear in the Call Stack section:
Memory dump debugging
The C/C++ extension for VS Code also has the ability to debug memory dumps. To debug a memory dump, open your launch.json file and add the coreDumpPath (for GDB or LLDB) or dumpPath (for the Visual Studio Windows Debugger) property to the C++ Launch configuration, set its value to be a string containing the path to the memory dump. This will even work for x86 programs being debugged on an x64 machine.
Additional symbols
If there are additional directories where the debugger can find symbol files (for example, .pdb files for the Visual Studio Windows Debugger), they can be specified by adding the additionalSOLibSearchPath (for GDB or LLDB) or symbolSearchPath (for the Visual Studio Windows Debugger).
For example:
"additionalSOLibSearchPath": "/path/to/symbols;/another/path/to/symbols"
or
"symbolSearchPath": "C:\\path\\to\\symbols;C:\\another\\path\\to\\symbols"
Locate source files
The source file location can be changed if the source files are not located in the compilation location. This is done by simple replacement pairs added in the sourceFileMap section. The first match in this list will be used.
For example:
"sourceFileMap": {
    "/build/gcc-4.8-fNUjSI/gcc-4.8-4.8.4/build/i686-linux-gnu/libstdc++-v3/include/i686-linux-gnu": "/usr/include/i686-linux-gnu/c++/4.8",
    "/build/gcc-4.8-fNUjSI/gcc-4.8-4.8.4/build/i686-linux-gnu/libstdc++-v3/include": "/usr/include/c++/4.8"
}
GDB, LLDB, and LLDB-MI Commands (GDB/LLDB)
For the C++ (GDB/LLDB) debugging environment, you can execute GDB, LLDB and LLDB-MI commands directly through the debug console with the -exec command, but be careful, executing commands directly in the debug console is untested and might crash VS Code in some cases.
Other debugging features
- Unconditional breakpoints
- Watch window
- Call stack
- Stepping
For more information on debugging with VS Code, see this introduction to debugging in VS Code.
For additional ways to configure the launch.json file so that you can debug your C/C++ app, see Configure C/C++ debugging.
Natvis framework
You create custom views of C++ object in the debugger with the Natvis framework. You can read the Custom views for native objects topic for details on using Natvis with the C/C++ extension.
Debug remotely
For information about attaching to a remote process, such as debugging a process in a Docker container, see Pipe transport.
Debug the debugger
If you are experiencing a debugging problem with the extension that we can’t diagnose based on information in your issue report, we might ask you to enable logging and send us your logs. See Enable logging for the debug adapter to learn how to get C/C++ extension logs.
Known limitations
Symbols and code navigation
All platforms:
- Because the extension doesn’t parse function bodies, Peek Definition and Go to Definition don’t work for symbols defined inside the body of a function.
Debugging
Windows:
- GDB on Cygwin and MinGW cannot break a running process. To set a breakpoint when the application is running (not stopped under the debugger), or to pause the application being debugged, press Ctrl-C in the application’s terminal.
- GDB on Cygwin cannot open core dumps.
Linux:
- You may see an error saying:
ptrace: Operation not permitted. This is due to GDB needing elevated permissions in order to attach to a process. This can be solved using the solutions below:-
When using attach to process, you need to provide your password before the debugging session can begin.
-
To disable this error temporarily, use the following command:
echo 0 | sudo tee /proc/sys/kernel/yama/ptrace_scope -
To remove the error permanently, add a file called
10-ptrace.confto/etc/sysctl.d/and add the followingkernel.yama.ptrace_scope = 0.
-
macOS:
- LLDB:
- When debugging with LLDB, if the Terminal window is closed while in break mode, debugging does not stop. Debugging can be stopped by pressing the Stop button.
- When debugging is stopped the Terminal window is not closed.
- GDB:
- Additional manual install steps are required to use GDB on macOS. See Manual Installation of GDB for OS X in the README.
- When attaching to a process with GDB, the application being debugged cannot be interrupted. GDB will only bind breakpoints set while the application is not running (either before attaching to the application, or while the application is in a stopped state). This is due to a bug in GDB.
- Core dumps cannot be loaded when debugging with GDB because GDB does not support the core dump format used in macOS.
- When attached to a process with GDB, break-all will end the process.
Next steps
Read on to find out about:
- Configure VS Code for Windows Subsystem for Linux
- Configure VS Code for Mingw-w64 and GCC
- Configure VS Code for macOS
- Configure C/C++ debugging — Learn about additional debugger configuration options.
- Basic Editing — Learn about the powerful Visual Studio Code editor.
- Code Navigation — Move quickly through your source code.
- Tasks — use tasks to build your project and more.
- Debugging — find out about the Visual Studio Code debugger.
If you have any other questions or run into any issues, please file an issue on GitHub.
5/21/2020
You can debug C# applications in Visual Studio Code using the Microsoft C# extension.
Run and Debug
The C# extension along with C# Dev Kit provides multiple ways to run and debug your C# application.
To run and debug without C# Dev Kit, see Microsoft C# extension’s GitHub page for documentation.
Debug with F5
With the C# Dev Kit extension installed and no debug configurations available to select in the Debug view, you can start debugging your project by having a .cs file opened and then pressing F5. The debugger will automatically find your project and start debugging. If you have multiple projects, it will prompt for which project you would like to start debugging.
You can also start a debugging session from the Run and Debug view from the side bar of VS Code. See more at Debugging in VS Code.

Debug with Solution Explorer
With the C# Dev Kit extension installed, there is a Debug context menu when you right-click on your project in the Solution Explorer.
There are three options:
- Start New Instance — This starts your project with a debugger attached.
- Start without Debugging — This runs your project without a debugger attached.
- Step into New Instance — This starts your project with a debugger attached but stops at the entrypoint of your code.
Debug with Command Palette
With the C# Dev Kit extension installed, you can also start debugging from the Command Palette ⇧⌘P (Windows, Linux Ctrl+Shift+P) by using the Debug: Select and Start Debugging command.
Note: This adds a launch configuration entry to your debug dropdown list.
Debug with dynamic (in-memory) launch configurations
With the C# Dev Kit extension installed, you can create dynamic launch configurations. How you create them depends if your project has an existing launch.json file.
Existing launch.json
If you have an existing launch.json, you can go to the Debug view, select the dropdown, and select the C# option. This should give you a selection of launch targets that you can add to your dropdown list. After selecting, you can hit F5 or Start Debugging with the newly generated configuration.
No launch.json
If you do not have a launch.json in your project, you can add and access these dynamic configurations in the Show all automatic debug configurations in the Debug view.

Removing dynamic (in-memory) launch configurations
You can remove the generated configurations with Command Palette ⇧⌘P (Windows, Linux Ctrl+Shift+P) and using the command Debug: Select and Start Debugging.
In the dropdown, it lists all your existing debug configurations. If you hover over the dynamic configurations, a clickable trashcan icon appears on the right. You can select that icon to remove the dynamic configuration.

Debug with launch.json
If you are using the C# Dev Kit, we recommend not using this option. However, if you have the need to modify the debug configuration directly, see Configuring launch.json for C# debugging.
Attaching to a process
You can attach to a C# process using with the Command Palette ⇧⌘P (Windows, Linux Ctrl+Shift+P) and running the Debug: Attach to a .NET 5+ or .NET Core process command.

Configuration options
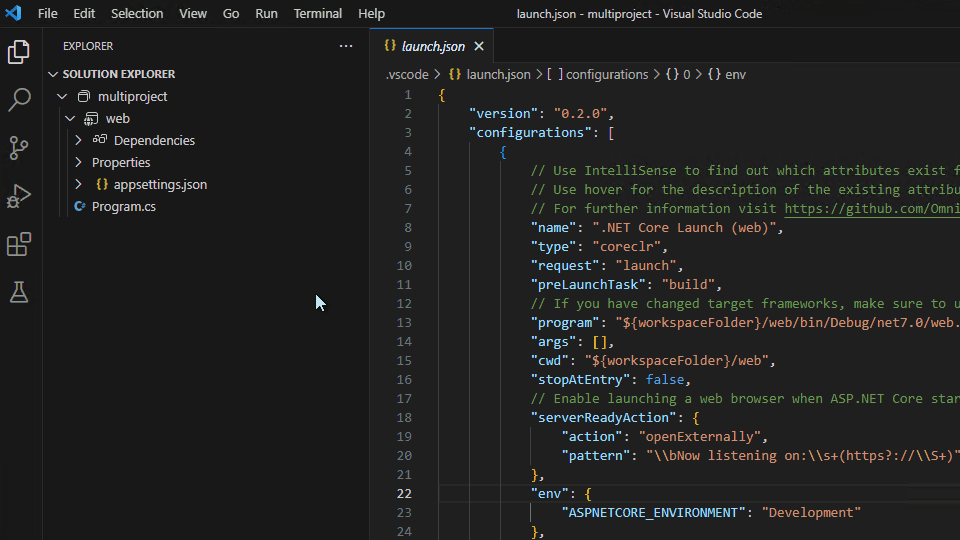
There are many options and settings available to configure the debugger. You can use launchSettings.json, VS Code User Settings to modify your debug options, or directly modify your launch.json.
launchSettings.json
If you have launchSettings.json from Visual Studio, you should see your profiles listed using Run from F5 or Run from Command Palette.
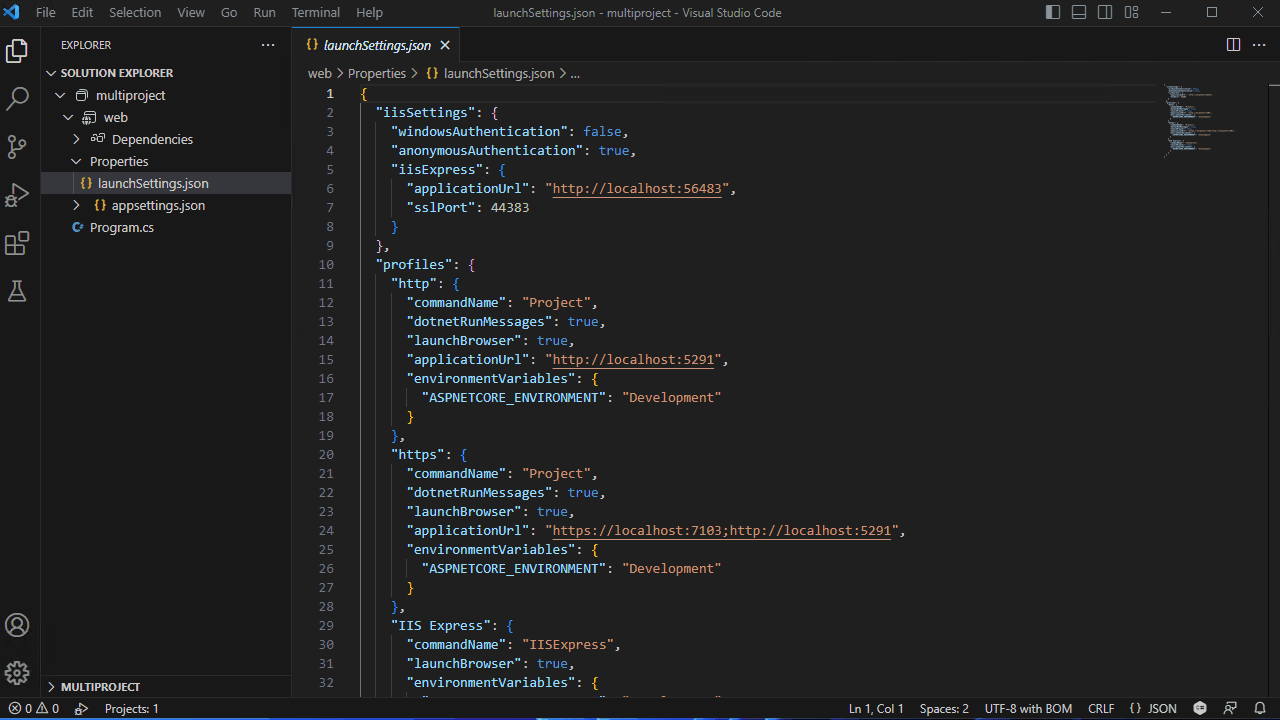
Refer to Configuring C# debugging for more details.
User settings
If you have settings that you wish to change while using the C# debugger, you can find these options under File > Preferences > Settings (⌘, (Windows, Linux Ctrl+,)) and searching for these options.
csharp.debug.stopAtEntry— If true, the debugger should stop at the entry point of the target. This option defaults tofalse.csharp.debug.console— When launching console projects, indicates which console the target program should be launched into. Note: This option is only used for the ‘dotnet’ debug configuration type.internalConsole— Output to the VS Code Debug Console. This doesn’t support reading console input (ex:Console.ReadLine).integratedTerminal— VS Code’s integrated terminal.externalTerminal— External terminal that can be configured via user settings.
csharp.debug.sourceFileMap— Maps build-time paths to local source locations. All instances of build-time path will be replaced with the local source path.
Example:
{\"<build-path>\":\"<local-source-path>\"}csharp.debug.justMyCode— When enabled (the default), the debugger only displays and steps into user code («My Code»), ignoring system code and other code that is optimized or that does not have debugging symbols. More information.csharp.debug.requireExactSource— Flag to require current source code to match the pdb. This option defaults totrue.csharp.debug.enableStepFiltering— Flag to enable stepping over Properties and Operators. This option defaults totrue.csharp.debug.logging.exceptions— Flag to determine whether exception messages should be logged to the output window. This option defaults totrue.csharp.debug.logging.moduleLoad— Flag to determine whether module load events should be logged to the output window. This option defaults totrue.csharp.debug.logging.programOutput— Flag to determine whether program output should be logged to the output window when not using an external console. This option defaults totrue.csharp.debug.logging.engineLogging— Flag to determine whether diagnostic engine logs should be logged to the output window. This option defaults tofalse.csharp.debug.logging.browserStdOut— Flag to determine if stdout text from the launching the web browser should be logged to the output window. This option defaults totrue.csharp.debug.logging.elapsedTiming— If true, engine logging includesadapterElapsedTimeandengineElapsedTimeproperties to indicate the amount of time, in microseconds, that a request took. This option defaults tofalse.csharp.debug.logging.threadExit— Controls if a message is logged when a thread in the target process exits. This option defaults tofalse.csharp.debug.logging.processExit— Controls if a message is logged when the target process exits, or debugging is stopped. This option defaults totrue.csharp.debug.suppressJITOptimizations— If true, when an optimized module (.dll compiled in the Release configuration) loads in the target process, the debugger asks the Just-In-Time compiler to generate code with optimizations disabled. More informationcsharp.debug.symbolOptions.searchPaths— Array of symbol server URLs (example:http://MyExampleSymbolServer) or directories (example: /build/symbols) to search for .pdb files. These directories will be searched in addition to the default locations next to the module and the path where the pdb was originally dropped to.csharp.debug.symbolOptions.searchMicrosoftSymbolServer— Iftruethe Microsoft Symbol server (https://msdl.microsoft.com/download/symbols) is added to the symbols search path. If unspecified, this option defaults tofalse.csharp.debug.symbolOptions.searchNuGetOrgSymbolServer— Iftruethe NuGet.org symbol server (https://symbols.nuget.org/download/symbols) is added to the symbols search path. If unspecified, this option defaults tofalse.csharp.debug.symbolOptions.cachePath— Directory where symbols downloaded from symbol servers should be cached. If unspecified, on Windows the debugger defaults to%TEMP%\\SymbolCache, and on Linux and macOS the debugger defaults to~/.dotnet/symbolcache.
*-csharp.debug.symbolOptions.moduleFilter.mode— Controls which of the two basic operating modes the module filter operates in.loadAllButExcluded— Load symbols for all modules unless the module is in theexcludedModulesarray.loadOnlyIncluded— Do not attempt to load symbols for ANY module unless it is in theincludedModulesarray, or it is included through theincludeSymbolsNextToModulessetting.
csharp.debug.symbolOptions.moduleFilter.excludedModules— Array of modules that the debugger should NOT load symbols for. Wildcards (example: MyCompany.*.dll) are supported. This property is ignored unlessmodeis set toloadAllButExcluded.csharp.debug.symbolOptions.moduleFilter.includedModules— Array of modules that the debugger should load symbols for. Wildcards (example: MyCompany.*.dll) are supported. This property is ignored unlessmodeis set toloadOnlyIncluded.csharp.debug.symbolOptions.moduleFilter.includeSymbolsNextToModules— If true, for any module NOT in theincludedModulesarray, the debugger will still check next to the module itself and the launching executable, but it will not check paths on the symbol search list. This option defaults totrue.
This property is ignored unlessmodeis set toloadOnlyIncludedcsharp.debug.allowFastEvaluate— When true (the default state), the debugger will attempt faster evaluation by simulating execution of simple properties and methods.
Breakpoints
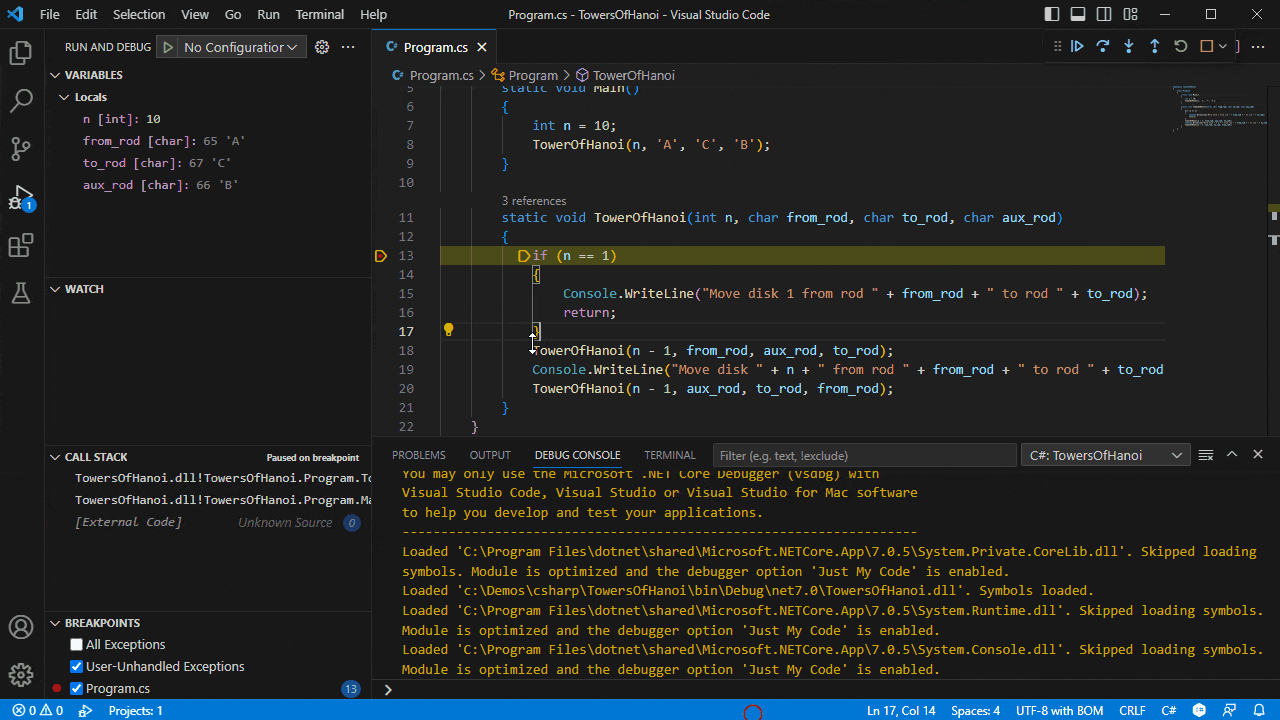
The C# Debugger supports various breakpoints, such as source line breakpoints, conditional breakpoints, and logpoints.
Breakpoint — conditional breakpoint
With the help of expression evaluation, the debugger also supports conditional breakpoint. You can set your breakpoint to break when expression evaluates to true.

Breakpoint — Logpoints
Logpoints (also known as Tracepoints in Visual Studio) allow you to send output to Debug Console without editing code. They’re different from breakpoints because they don’t stop the execution flow of your application.
To add a Logpoint, right-click in the far-left margin next to a line of code. Select Add Logpoint and type the message you want to log. Any expression between curly braces (‘{‘ and ‘}’) will be evaluated when the Logpoint is hit.
The following tokens are also supported in the log message:
| Token | Description | Example Output |
|---|---|---|
| $FILEPOS | Current source file location | C:\sources\repos\Project\Program.cs:4 |
| $FUNCTION | Current function name | Program.<Main>$ |
| $ADDRESS | Current instruction | 0x00007FFF83A54001 |
| $TID | Thread ID | 20668 |
| $PID | Process ID | 10028 |
| $TNAME | Thread name | <No Thread Name> |
| $PNAME | Process name | C:\sources\repos\Project\bin\Debug\net7.0\console.exe |
| $CALLER | Calling function name | void console.dll!Program.Foo() |
| $CALLSTACK | Call stack | void console.dll!Program.Bar() void console.dll!Program.Foo() void console.dll!Program.<Main>$(string[] args) [External Code] |
| $TICK | Tick count (from Windows GetTickCount) | 28194046 |
| $HITCOUNT | Number of times this breakpoint has been hit | 5 |
Expression evaluation
The debugger also lets you evaluate expressions in the WATCH window as well as the Debug Console.
Next steps
Read on to find out about:
- Debugging — Find out how to use the debugger in VS Code with your project for any language.
6/6/2023

By the end of this short guide, you’d be able to run, debug, and get IntelliSense for C/C++ files in VSCode. Though, this guide is focused on the Windows platform but can be extended to Mac and Linux with some minor changes.
I extensively used C & C++ in my competitive programming years and wanted better support for debugging & IntelliSense. The only options available were Dev-C++ (outdated) and the original «Mammoth» Visual Studio. Lately, I found VSCode and fell in love with it (first love was Atom). I tweaked it around and set it up as a complete IDE For small C, C++ projects especially geared towards competitive programming.
Create a sample C/C++ project
-
Open/Create an empty folder in VSCode.
-
Create a
new.cppfile inside it like below:#include <iostream> using namespace std; int main() { cout << "Hello World" << endl; // uncomment below line to stop cmd from exiting immediately in case of "externalConsole": true //system("pause"); return 0; } -
Install recommended C/C++ extension in VSCode and reload.

Official C/C++ Extension for VSCode

Install C/C++ Compiler
C/C++ extension does not include a C++ compiler. So, you will need to install one or use which is already installed on your computer.
Windows: Download MinGW64.zip (latest release) and extract it to the C Drive.
Mac: xcode
Linux: gcc
Also, Make sure to add C++ compiler PATH to environment variable of your platform. For Windows MinGW64 add: C:\MinGW64\bin
Run and Debug C/C++ Code
You’ll notice that there is also a .vscode folder in your sample project. To configure debug configuration, 2 files are required launch.json and tasks.json inside .vscode folder.
VSCode can create and auto-configure these files if we try to debug for the first time. To do that, open C++ file in VSCode and either hit F5 or go to Debug -> Start Debugging and select C++ (GDB/LLDB) then select g++.exe build and debug active file.


This should create 2 files launch.json and tasks.json in .vscode folder which should look like below (update the MinGW64 path if not correct)
Notice that I’ve added one more optional configuration g++ build & run active file in launch.json and g++ build & run in tasks.json file for purpose of also Running C/C++ code without debugging. Now you may choose which configuration to pick when you start debugging. You may remove the configuration whichever you won’t need.

launch.json
{
  "version": "0.2.0",
  "configurations": [
    {
      "name": "g++.exe build and debug active file",
      "type": "cppdbg",
      "request": "launch",
      "program": "${fileDirname}\${fileBasenameNoExtension}.exe",
      "args": [],
      "stopAtEntry": false,
      "cwd": "${workspaceFolder}",
      "environment": [],
      "externalConsole": false, //set to true to see output in cmd instead
      "MIMode": "gdb",
      "miDebuggerPath": "C:\MinGW64\bin\gdb.exe",
      "setupCommands": [
        {
          "description": "Enable pretty-printing for gdb",
          "text": "-enable-pretty-printing",
          "ignoreFailures": true
        }
      ],
      "preLaunchTask": "g++.exe build active file"
    },
    {
      "name": "g++ build & run active file",
      "type": "cppdbg",
      "request": "launch",
      "program": "${fileDirname}\${fileBasenameNoExtension}.exe",
      "args": [],
      "stopAtEntry": false,
      "cwd": "${workspaceFolder}",
      "environment": [],
      "externalConsole": false, //set to true to see output in cmd instead
      "MIMode": "gdb",
      "miDebuggerPath": "C:\MinGW64\bin\gdb.exe",
      "setupCommands": [
        {
          "description": "Enable pretty-printing for gdb",
          "text": "-enable-pretty-printing",
          "ignoreFailures": true
        }
      ],
      "preLaunchTask": "g++ build & run active file"
    }
    ]
}
tasks.json
{
  "tasks": [
    {
      "type": "shell",
      "label": "g++.exe build active file",
      "command": "C:\MinGW64\bin\g++.exe",
      "args": [
        "-g",
        "${file}",
        "-o",
        "${fileDirname}\${fileBasenameNoExtension}.exe"
      ],
      "options": {
        "cwd": "C:\MinGW64\bin"
      }
    },
    {
      "type": "shell",
      "label": "g++ build & run active file",
      "command": "C:\MinGW64\bin\g++.exe",
      "args": [
        "${file}",
        "-o",
        "${fileDirname}\${fileBasenameNoExtension}.exe"
      ],
      "options": {
        "cwd": "C:\MinGW64\bin"
      }
    }
  ],
  "version":"2.0.0"
}
externalConsole in launch.json can be set to true to see code output in cmd instead.
Restart VSCode to take effects of newly added compiler paths.
Open any C/C++ file, set some breakpoints (or not), and hit the Big Green Play Button.
(Shortcut to debug: F5 )

Tip: To hide *.exe files in the side explorer of VSCode, open settings and paste the below config:
"files.exclude": {
 "*.exe": true
 }
💬 Discuss on Github
That’s all, folks!

This article is about using VS Code for Debugging your C/C++ code on Windows(8/9/10). I thought it was a simple task when I was trying to debug my code for one of the problems for an online coding competition on codeforces but I found out a lot of blockers in front of me when I did it the very first time.
The first one of those was setting up a debugger in Windows(Windows 10 in my case) was quite problematic when used for languages like C++. Although I could have used Codeblocks which supports debugging features on Windows platforms in this case, but I am not used to light-theme applications and I don’t quite like the debugging interface it offers. Like a lot of other developers, I am a fan of dark-themes too, and using something like VS Code will give me more options to explore in dark themes. For that reason, I decided to get the debugger for C++ running on my Windows system.
After a lot of googling and reading a lot of articles on the same, I was finally able to debug my C++ code using VS Code on my Windows system but it took a lot of my time to work out the complete solution. So I decided to prepare a compiled step-by-step guide for the complete process so that everything can be found at a single place. Here are the steps:
-
Install Visual Studio Code.
-
Install Windows Subsystems for Linux(WSL) using the instructions from the official documentation here.
-
Install your Linux distribution of choice. Just open the Microsoft Store and select your favorite Linux distribution(Ubuntu in my case).
-
After installation is completed, search for the Linux distribution which you installed in windows search(lets say Ubuntu). Opening it will start the WSL command prompt.
-
Inside the WSL command prompt, first run apt-get update to update the Ubuntu package lists just to avoid any issues because of out-of-date packages:
sudo apt-get update -
Next, install the GNU compiler tools and the GDB debugger by typing:
sudo apt-get install build-essential gdb -
After installing the compiler tools, verify that the GNU C++ Compiler and the debugger is installed by using these commands:
g++ --version
gdb --version
If both these commands do not return the version currently present on WSL and give some error, try updating/installing the GNU compiler tools once again.
-
Now your Linux environment is fully set up to get the things running. Create a folder for your visual studio project(say helloWorld) and open it in Visual Studio Code in the project folder using following commands.
mkdir helloworld cd mkdir code . -
Opening VS Code in WSL command prompt will install a small server(VS Code Server) on the Linux side that the Windows system VS Code will talk to.
-
Once the VS Code is open on WSL, go to View > Extensions(or Ctrl+Shift+X) and install these two extensions:
- Remote — WSL extension : The Remote — WSL extension extension lets you use the Windows Subsystem for Linux (WSL) as your full-time development environment right from VS Code.
-
C/C++: C/C++ extension adds language support for C/C++ to Visual Studio Code, including features such as IntelliSense and debugging.

-
Once these two extensions are installed, you will see the context in which the VS code is running is changed to [WSL: Ubuntu] in the status bar present at the bottom of Visual Studio.

-
Now you are ready to write your code. Add a source code file(say helloWorld.cpp) from VS code and write your code in that file:

// helloWorld.CPP #include<bits/stdc++.h> using namespace std; int lengthOfLIS(vector<int>& a, int n) { if(n==0) return 0; vector<int> dp(n, 0); dp[0] = a[0]; int len = 1; for(int i=1; i<n; i++){ auto it = lower_bound(dp.begin(), dp.begin()+len, a[i]); if(it == dp.begin()+len) dp[len++] = a[i]; else *it = a[i]; } return len; } int main(){ int n; cin>>n; vector<int> v; int x; for(int i=0; i<n; i++){ cin>>x; v.push_back(x); } cout<<lengthOfLIS(v, n); } -
Build the Task: After writing the code, go to
Terminal > Configure Default Build Task. In the dropdown, chooseg++ build active file, which will build the file that is currently displayed(helloWorld.cpp in this case) in the editor. -
This will create a tasks.json file in a .vscode folder and open it in the editor. Your new tasks.json file should look similar to the JSON below:
{ "version": "2.0.0", "tasks": [ { "type": "shell", "label": "g++ build active file", "command": "/usr/bin/g++", "args": [ "-g", "${file}", "-o", "${fileDirname}/${fileBasenameNoExtension}" ], "options": { "cwd": "/usr/bin" }, "problemMatcher": [ "$gcc" ], "group": { "kind": "build", "isDefault": true } } ] } -
Next,
Run > Add Configurationand then chooseC++(GDB/LLDB).
You’ll then see a dropdown for various predefined debugging configurations. Chooseg++ build and debug active file. VS Code creates a launch.json file which should look like this:{ /**************************************************** Use IntelliSense to learn about possible attributes. Hover to view descriptions of existing attributes. For more information, visit: https://go.microsoft.com/fwlink/?linkid=830387 ****************************************************/ "version": "0.2.0", "configurations": [ { "name": "g++ - Build and debug active file", "type": "cppdbg", "request": "launch", "program": "${fileDirname}/${fileBasenameNoExtension}", "args": [], "stopAtEntry": false, "cwd": "${workspaceFolder}", "environment": [], "externalConsole": false, "MIMode": "gdb", "setupCommands": [ { "description": "Enable pretty-printing for gdb", "text": "-enable-pretty-printing", "ignoreFailures": true } ], "preLaunchTask": "g++ build active file", "miDebuggerPath": "/usr/bin/gdb", } ] } -
Now you can start the debugging session. Go back to helloworld.cpp so that it is the active file. Press F5 or from the main menu choose
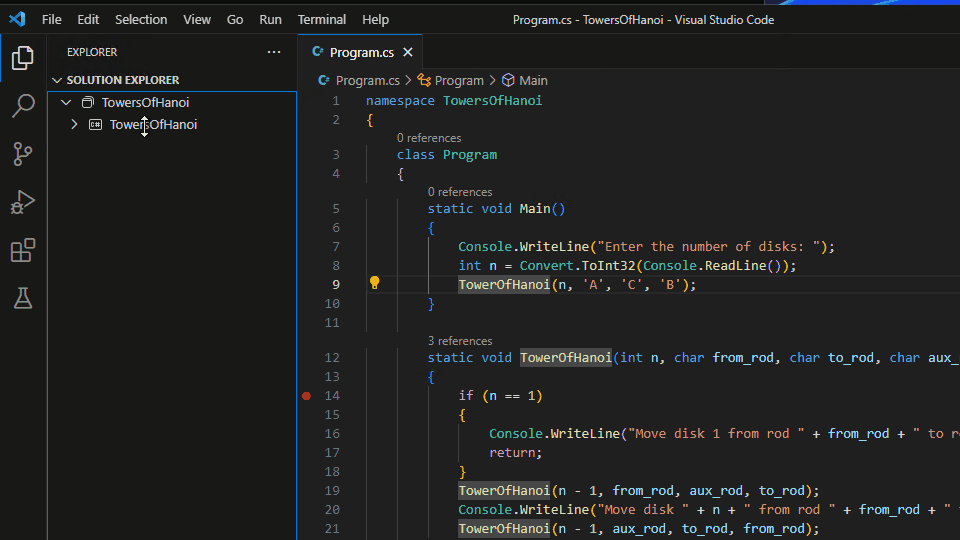
Run > Start Debugging. Do not forget to set the breakpoints(just click on the left of line number) where you want the debugger to stop as shown in the sample image below.


- This way you can set breakpoints and go line by line(https://code.visualstudio.com/docs/cpp/config-mingw#_step-through-the-code) through your code using the debugger options to find where it might be going wrong. Here is some help on how to use a debugger.
So that is it. Hope it helps in debugging the C++ code on Windows OS and making lives easier.
Summary
- Basic
- Spec
- debugging Unit Test (cunit)
- debugging executable file
- debugging on Windows
Basic
- GNU GCC
- Extension: C/C++
- Debugger: lldb(MacOS), gdb(Linux)
- module code: bubble_sort.c
Spec
- OS
- ✅ MacOS
- ✅ Windows
* ✅ Linux
- Break Point
- ✅ break point
- ✅ condition break point
- ✅ function breakpoint
- Step Execution
- ✅ Step Over
- ✅ Step Into
- ✅ Step Out
- ✅ Continue
- ❌ Step Back
- ❌ Move To
- ❌ Pause
- Variables
- ✅ variables views
- ✅ watch variables
- Call Stack
- ✅ call stack
- Evaluation
- ✅ eval expression to show variables
- ✅ eval expression to change variables
- Type of Execution
- ✅ debug unit test
- ✅ debug executable package
- ✅ attach debug process (but cannot work on MacOS)
- ✅ remote debugging (but cannot start server on MacOS)
Instruction
MacOS
- install XCode
- install Extension C/C++
Windows
- install Visual Studio 2017
- install Extension C/C++
Linux
- install gcc:
sudo apt get -y gcc - install Extension C/C++
debugging unit test (cunit)
- test code: bubble_sort_cunit.c
MacOS instruction
Ubuntu instruction
sudo apt install libcunit1 libcunit1-dev
Windows instruction
HELP Wanted
launch.json
menu: C/C++: Launch
{
  "version": "0.2.0",
  "configurations": [
    {
      // for MacOS
      "name": "(lldb) Launch cunit",
      "type": "cppdbg",
      "request": "launch",
      "program": "${workspaceRoot}/bubble_sort_cunit",
      "args": [],
      "stopAtEntry": false,
      "cwd": "${workspaceRoot}",
      "environment": [],
      "externalConsole": true,
      "preLaunchTask": "build cunit",
      "MIMode": "lldb"
    },
    {
      // for Linux
      "name": "(gdb) Launch cunit",
      "type": "cppdbg",
      "request": "launch",
      "program": "${workspaceRoot}/a.out",
      "args": [],
      "stopAtEntry": false,
      "cwd": "${workspaceRoot}",
      "environment": [],
      "externalConsole": true,
      "MIMode": "gdb",
      "preLaunchTask": "build cunit",
      "setupCommands": [
        {
          "description": "Enable pretty-printing for gdb",
          "text": "-enable-pretty-printing",
          "ignoreFailures": true
        }
      ]
    }
  ]
}
how-to
- build cunit
gcc bubble_sort.c bubble_sort_cunit.c -g -O0 -W -Wall -lcunit
-
Start “launch cunit”
-
new window is opened, and Run cunit
./a.out
***************** CUNIT CONSOLE - MAIN MENU ******************************
(R)un  (S)elect  (L)ist  (A)ctivate  (F)ailures  (O)ptions  (H)elp  (Q)uit
Enter command: R
gcc option for debugging
-Wand-Wall: show warnings (not must)-g: debug-O0: no optimisation-lcunit: load cunit
debugging executable file (MacOS, Linux)
- Program: main.c
launch.json
{
  "version": "0.2.0",
  "configurations": [
    {
      // MacOS
      "name": "Launch Program(lldb)",
      "type": "cppdbg",
      "request": "launch",
      "program": "${workspaceRoot}/a.out",
      "args": ["4", "3", "2", "1"],
      "stopAtEntry": false,
      "cwd": "${workspaceRoot}",
      "environment": [],
      "externalConsole": true,
      "MIMode": "lldb"
    },
    {
      // Linux
      "name": "(gdb) Launch",
      "type": "cppdbg",
      "request": "launch",
      "program": "${workspaceRoot}/a.out",
      "args": ["4", "3", "2", "1"],
      "stopAtEntry": false,
      "cwd": "${workspaceRoot}",
      "environment": [],
      "externalConsole": true,
      "MIMode": "gdb",
      "setupCommands": [
        {
          "description": "Enable pretty-printing for gdb",
          "text": "-enable-pretty-printing",
          "ignoreFailures": true
        }
      ]
    }
  ]
}
how-to
- build with
-g -O0option
gcc bubble_sort.c main.c -g -O0 -W -Wall
- Start “Launch Program”
debugging execute file (Windows)
launch.json
{
  "version": "0.2.0",
  "configurations": [
    {
      "name": "(Windows) Launch",
      "type": "cppvsdbg",
      "request": "launch",
      "program": "${workspaceRoot}/main.exe",
      "args": ["4", "3", "2", "1"],
      "stopAtEntry": false,
      "cwd": "${workspaceRoot}",
      "environment": [],
      "externalConsole": true
    }
  ]
}
how-to
- Start Developer Command Prompt and build with /ZI option
cl main.c bubble_sort.c /ZI
- Start debug.
attach to process
launch.json
{
  "version": "0.2.0",
  "configurations": [
    {
      "name": "(Linux gdb) Attach",
      "type": "cppdbg",
      "request": "attach",
      "program": "${workspaceFolder}/bubble_sort_cunit",
      "processId": "${command:pickProcess}",
      "MIMode": "gdb",
      "setupCommands": [
        {
          "description": "Enable pretty-printing for gdb",
          "text": "-enable-pretty-printing",
          "ignoreFailures": true
        }
      ]
    }
  ]
}
debug to remote machine (Mac/Linux to Linux)
With pipe transport, you’ll debug remote linux from macos.
launch.json
- set gdb path with sudo
{
  "version": "0.2.0",
  "configurations": [
		{
			"name": "(Mac to Linux)pipe transport",
			"type": "cppdbg",
			"request": "launch",
			"program": "/home/nnyn/Documents/vscode-debug-specs/cpp/main",
			"args": [
				"4",
				"3",
				"2",
				"1"
			],
			"stopAtEntry": false,
			"cwd": "/home/nnyn/Documents/vscode-debug-specs/cpp",
			"environment": [],
			"externalConsole": true,
			"pipeTransport": {
				"pipeCwd": "/usr/bin",
				"pipeProgram": "/usr/bin/ssh",
				"pipeArgs": [
					"nnyn@192.168.56.101"
				],
				"debuggerPath": "sudo /usr/bin/gdb"
			},
			"sourceFileMap": {
				// "remote": "local"
				"/home/nnyn/Documents/vscode-debug-specs/cpp": "${workspaceFolder}"
			},
			"MIMode": "gdb"
		},
	}
 ]
how to
- build at remote machine
cd /home/nnyn/Documents/vscode-debug-specs/cpp
gcc -O0 -g -W -Wall -o main bubble_sort.c main.c
- launch debug.
attach to remote process (Mac/Linux to Linux)
With pipe transport, you’ll attach remote linux process from macos.
launch.json
{
  "version": "0.2.0",
  "configurations": [
		{
			"name": "(Mac to Linux)pipe transport attach",
			"type": "cppdbg",
			"request": "attach",
			"program": "/home/nnyn/Documents/vscode-debug-specs/cpp/bubble_sort_cunit",
			"processId": "21073",
			"pipeTransport": {
				"pipeCwd": "",
				"pipeProgram": "/usr/bin/ssh",
				"pipeArgs": [
					"nnyn@192.168.56.101"
				],
				"debuggerPath": "sudo /usr/bin/gdb"
			},
			"sourceFileMap": {
				// "remote": "local"
				"/home/nnyn/Documents/vscode-debug-specs/cpp": "${workspaceFolder}"
			},
			"MIMode": "gdb"
    }
	}
 ]
how to
- build at remote machine
- launch program at remote machine
- check the process id of remote process
- set the process id to launch.json
- launch debug