Using GCC with MinGW
In this tutorial, you configure Visual Studio Code to use the GCC C++ compiler (g++) and GDB debugger from mingw-w64 to create programs that run on Windows. After configuring VS Code, you will compile, run, and debug a simple Hello World program.
This tutorial does not teach you about GCC, GDB, minGW-w64, or the C++ language. For those subjects, there are many good resources available on the Web.
If you have any problems, feel free to file an issue for this tutorial in the VS Code documentation repository.
Prerequisites
To successfully complete this tutorial, you must do the following steps:
-
Install Visual Studio Code.
-
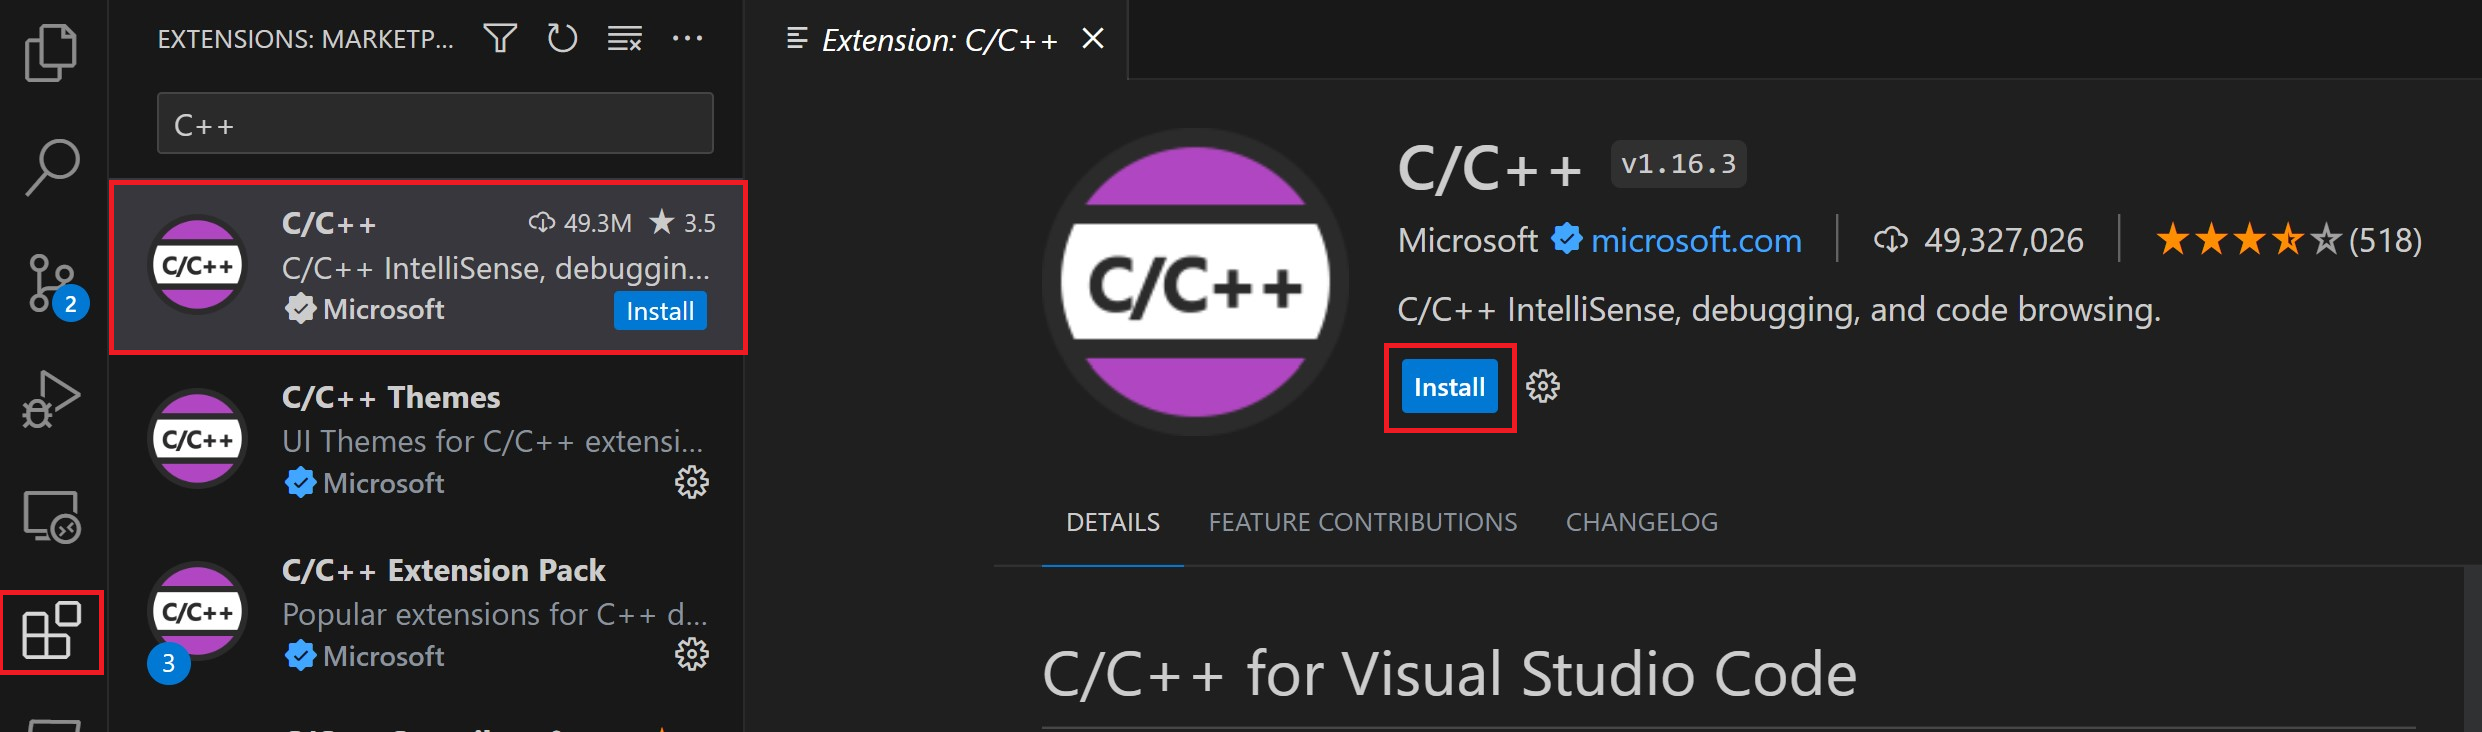
Install the C/C++ extension for VS Code. You can install the C/C++ extension by searching for ‘C++’ in the Extensions view (⇧⌘X (Windows, Linux Ctrl+Shift+X)).

Get the latest version of MinGW-w64 via MSYS2, which provides up-to-date native builds of GCC, MinGW-w64, and other helpful C++ tools and libraries. This will provide you with the necessary tools to compile your code, debug it, and configure it to work with IntelliSense.
-
You can download the latest installer from the MSYS2 page or use this direct link to the installer.
-
Run the installer and follow the steps of the installation wizard. Note that MSYS2 requires 64 bit Windows 8.1 or newer.
-
In the wizard, choose your desired Installation Folder. Record this directory for later. In most cases, the recommended directory is acceptable. The same applies when you get to setting the start menu shortcuts step. When complete, ensure the Run MSYS2 now box is checked and select Finish. This will open a MSYS2 terminal window for you.
-
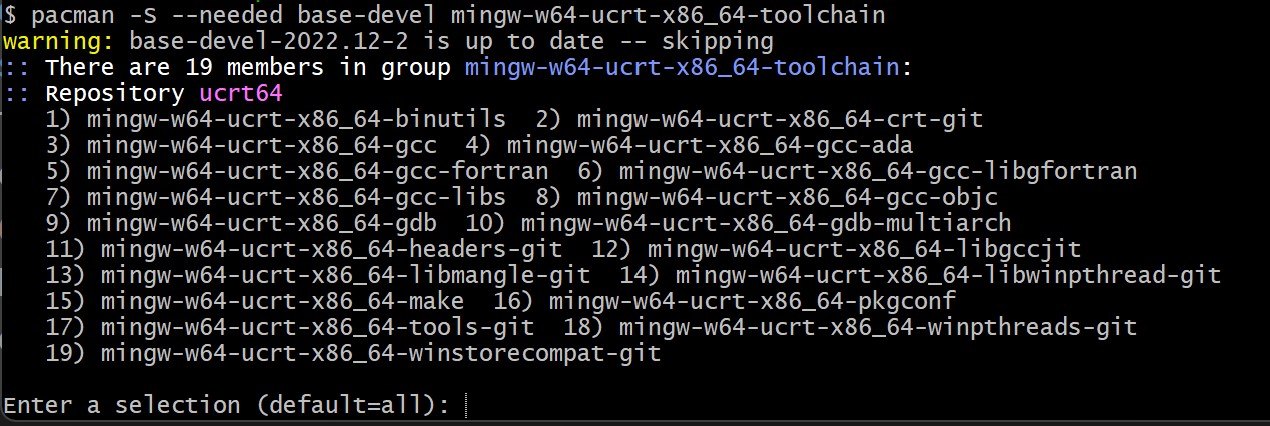
In this terminal, install the MinGW-w64 toolchain by running the following command:
pacman -S --needed base-devel mingw-w64-ucrt-x86_64-toolchain -
Accept the default number of packages in the
toolchaingroup by pressing Enter. -
Enter
Ywhen prompted whether to proceed with the installation. -
Add the path to your MinGW-w64
binfolder to the WindowsPATHenvironment variable by using the following steps:- In the Windows search bar, type Settings to open your Windows Settings.
- Search for Edit environment variables for your account.
- In your User variables, select the
Pathvariable and then select Edit. - Select New and add the MinGW-w64 destination folder you recorded during the installation process to the list. If you used the default settings above, then this will be the path:
C:\msys64\ucrt64\bin. - Select OK to save the updated PATH. You will need to reopen any console windows for the new PATH location to be available.
Check your MinGW installation
To check that your MinGW-w64 tools are correctly installed and available, open a new Command Prompt and type:
gcc --version
g++ --version
gdb --version
You should see output that states which versions of GCC, g++ and GDB you have installed. If this is not the case:
- Make sure your PATH variable entry matches the MinGW-w64 binary location where the toochain was installed. If the compilers do not exist at that PATH entry, make sure you followed the previous instructions.
- If
gcchas the correct output but notgdb, then you need to install the packages you are missing from the MinGW-w64 toolset.- If on compilation you are getting the «The value of miDebuggerPath is invalid.» message, one cause can be you are missing the
mingw-w64-gdbpackage.
- If on compilation you are getting the «The value of miDebuggerPath is invalid.» message, one cause can be you are missing the
Create a Hello World app
First, lets get a project set up.
- Launch a Windows command prompt (Enter Windows command prompt in the Windows search bar), then
- Run the following commands. These will create an empty folder called
projectswhere you can place all your VS Code projects. There, the next commands will create and navigate to a sub-folder calledhelloworld. From there, you will openhelloworlddirectly in VS Code.
mkdir projects
cd projects
mkdir helloworld
cd helloworld
code .
The «code .» command opens VS Code in the current working folder, which becomes your «workspace». Accept the Workspace Trust dialog by selecting Yes, I trust the authors since this is a folder you created.
As you go through the tutorial, you will see three files created in a .vscode folder in the workspace:
tasks.json(build instructions)launch.json(debugger settings)c_cpp_properties.json(compiler path and IntelliSense settings)
Add a source code file
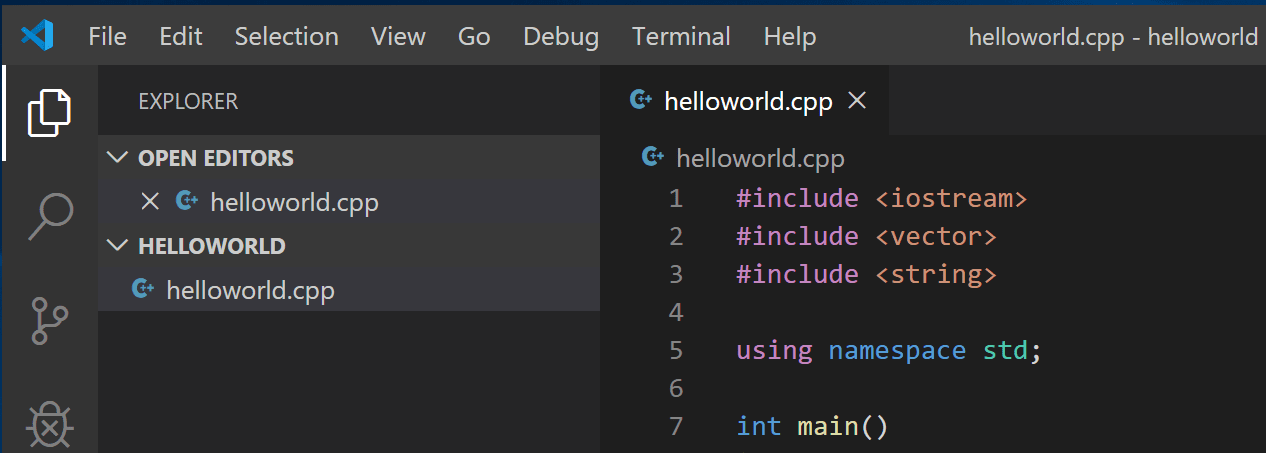
In the File Explorer title bar, select the New File button and name the file helloworld.cpp.

Add hello world source code
Now paste in this source code:
#include <iostream>
#include <vector>
#include <string>

using namespace std;

int main()
{
    vector<string> msg {"Hello", "C++", "World", "from", "VS Code", "and the C++ extension!"};

    for (const string& word : msg)
    {
        cout << word << " ";
    }
    cout << endl;
}
Now press ⌘S (Windows, Linux Ctrl+S) to save the file. Notice how the file you just added appears in the File Explorer view (⇧⌘E (Windows, Linux Ctrl+Shift+E)) in the side bar of VS Code:
You can also enable Auto Save to automatically save your file changes, by selecting File > Auto Save. You can find out more about the other views in the VS Code User Interface documentation.
Note: When you save or open a C++ file, you may see a notification from the C/C++ extension about the availability of an Insiders version, which lets you test new features and fixes. You can ignore this notification by selecting the
X(Clear Notification).
Explore IntelliSense
IntelliSense is a tool to help you code faster and more efficently by adding code editing features such as code completion, parameter info, quick info, and member lists.
To see IntelliSense in action,
hover over vector or string to see their type information. If you type msg. in line 10, you can see a completion list of recommended member functions to call, all generated by IntelliSense:
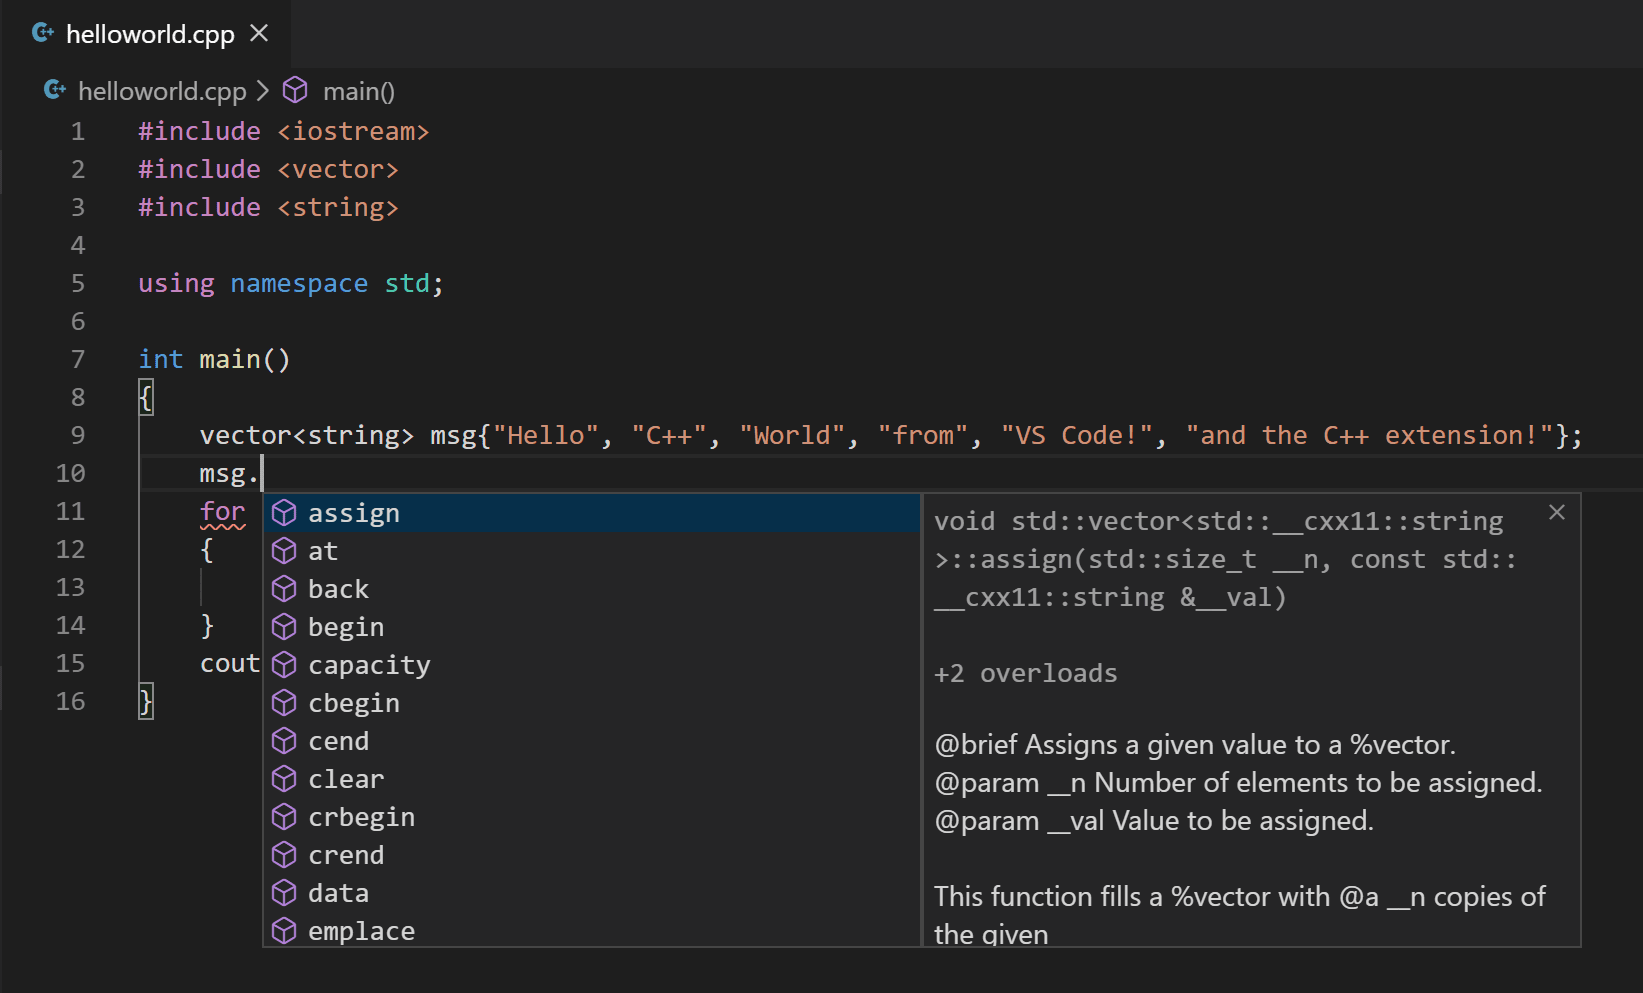
You can press the Tab key to insert a selected member. If you then add open parenthesis, IntelliSense will show information on which arguments are required.
If IntelliSense is not already configured, open the Command Palette (⇧⌘P (Windows, Linux Ctrl+Shift+P)) and enter Select IntelliSense Configuration. From the dropdown of compilers, select Use gcc.exe to configure.
Run helloworld.cpp
Remember, the C++ extension uses the C++ compiler you have installed on your machine to build your program. Make sure you have completed the «Installing the MinGW-w64 toolchain» step before attempting to run and debug helloworld.cpp in VS Code.
-
Open
helloworld.cppso that it is the active file. -
Press the play button in the top right corner of the editor.
-
Choose C/C++: g++.exe build and debug active file from the list of detected compilers on your system.
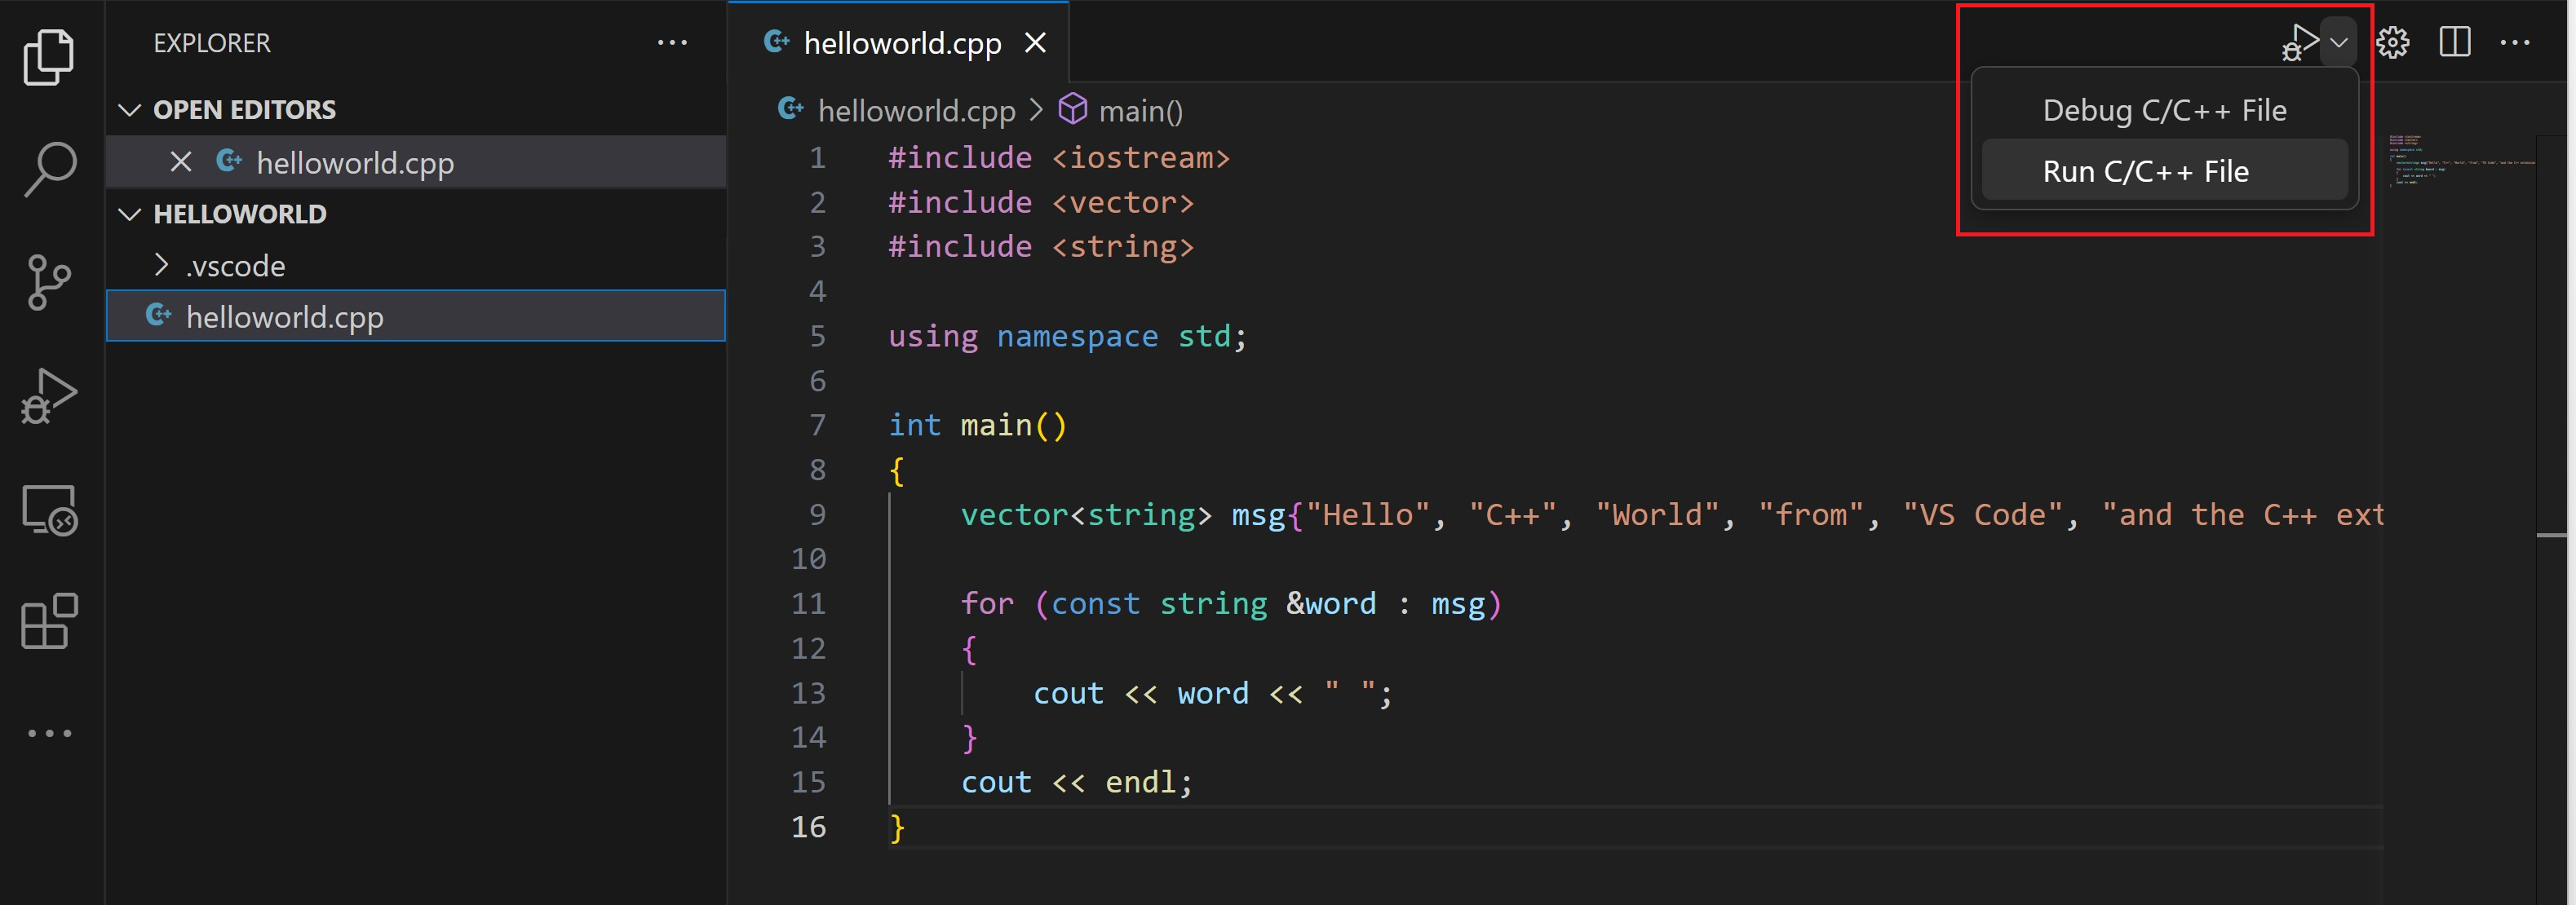
You’ll only be asked to choose a compiler the first time you run helloworld.cpp. This compiler will be set as the «default» compiler in tasks.json file.
-
After the build succeeds, your program’s output will appear in the integrated Terminal.
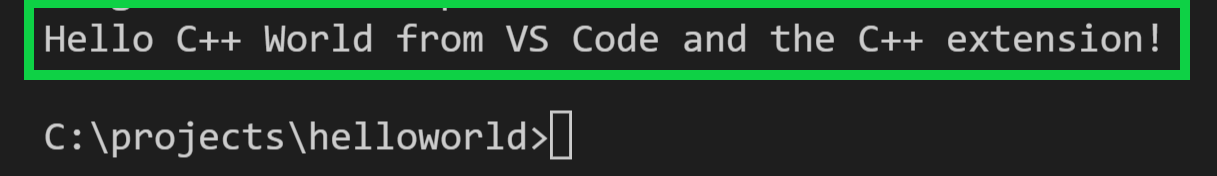
Congratulations! You’ve just run your first C++ program in VS Code!
Understanding tasks.json
The first time you run your program, the C++ extension creates a tasks.json file, which you’ll find in your project’s .vscode folder. tasks.json stores your build configurations.
Your new tasks.json file should look similar to the JSON below:
{
  "tasks": [
    {
      "type": "cppbuild",
      "label": "C/C++: g++.exe build active file",
      "command": "C:\\msys64\\ucrt64\\bin\\g++.exe",
      "args": [
        "-fdiagnostics-color=always",
        "-g",
        "${file}",
        "-o",
        "${fileDirname}\\${fileBasenameNoExtension}.exe"
      ],
      "options": {
        "cwd": "${fileDirname}"
      },
      "problemMatcher": ["$gcc"],
      "group": {
        "kind": "build",
        "isDefault": true
      },
      "detail": "Task generated by Debugger."
    }
  ],
  "version": "2.0.0"
}
Note: You can learn more about
tasks.jsonvariables in the variables reference.
The command setting specifies the program to run; in this case that is g++.
The args array specifies the command-line arguments that will be passed to g++. These arguments are listed in this file in the specific order expected by the compiler.
This task tells g++ to take the active file (${file}), compile it, and create an executable file in the current directory (${fileDirname}) with the same name as the active file but with the .exe extension (${fileBasenameNoExtension}.exe). For us, this results in helloworld.exe.
The label value is what you will see in the tasks list; you can name this whatever you like.
The detail value is what you will as the description of the task in the tasks list. It’s highly recommended to rename this value to differentiate it from similar tasks.
From now on, the play button will read from tasks.json to figure out how to build and run your program. You can define multiple build tasks in tasks.json, and whichever task is marked as the default will be used by the play button. In case you need to change the default compiler, you can run Tasks: Configure Default Build Task in the Command Palette. Alternatively you can modify the tasks.json file and remove the default by replacing this segment:
    "group": {
        "kind": "build",
        "isDefault": true
    },
with this:
"group": "build",
Modifying tasks.json
You can modify your tasks.json to build multiple C++ files by using an argument like "${workspaceFolder}/*.cpp" instead of ${file}.This will build all .cpp files in your current folder. You can also modify the output filename by replacing "${fileDirname}\\${fileBasenameNoExtension}.exe" with a hard-coded filename (for example "${workspaceFolder}\\myProgram.exe").
Debug helloworld.cpp
To debug your code,
-
Go back to
helloworld.cppso that it is the active file. -
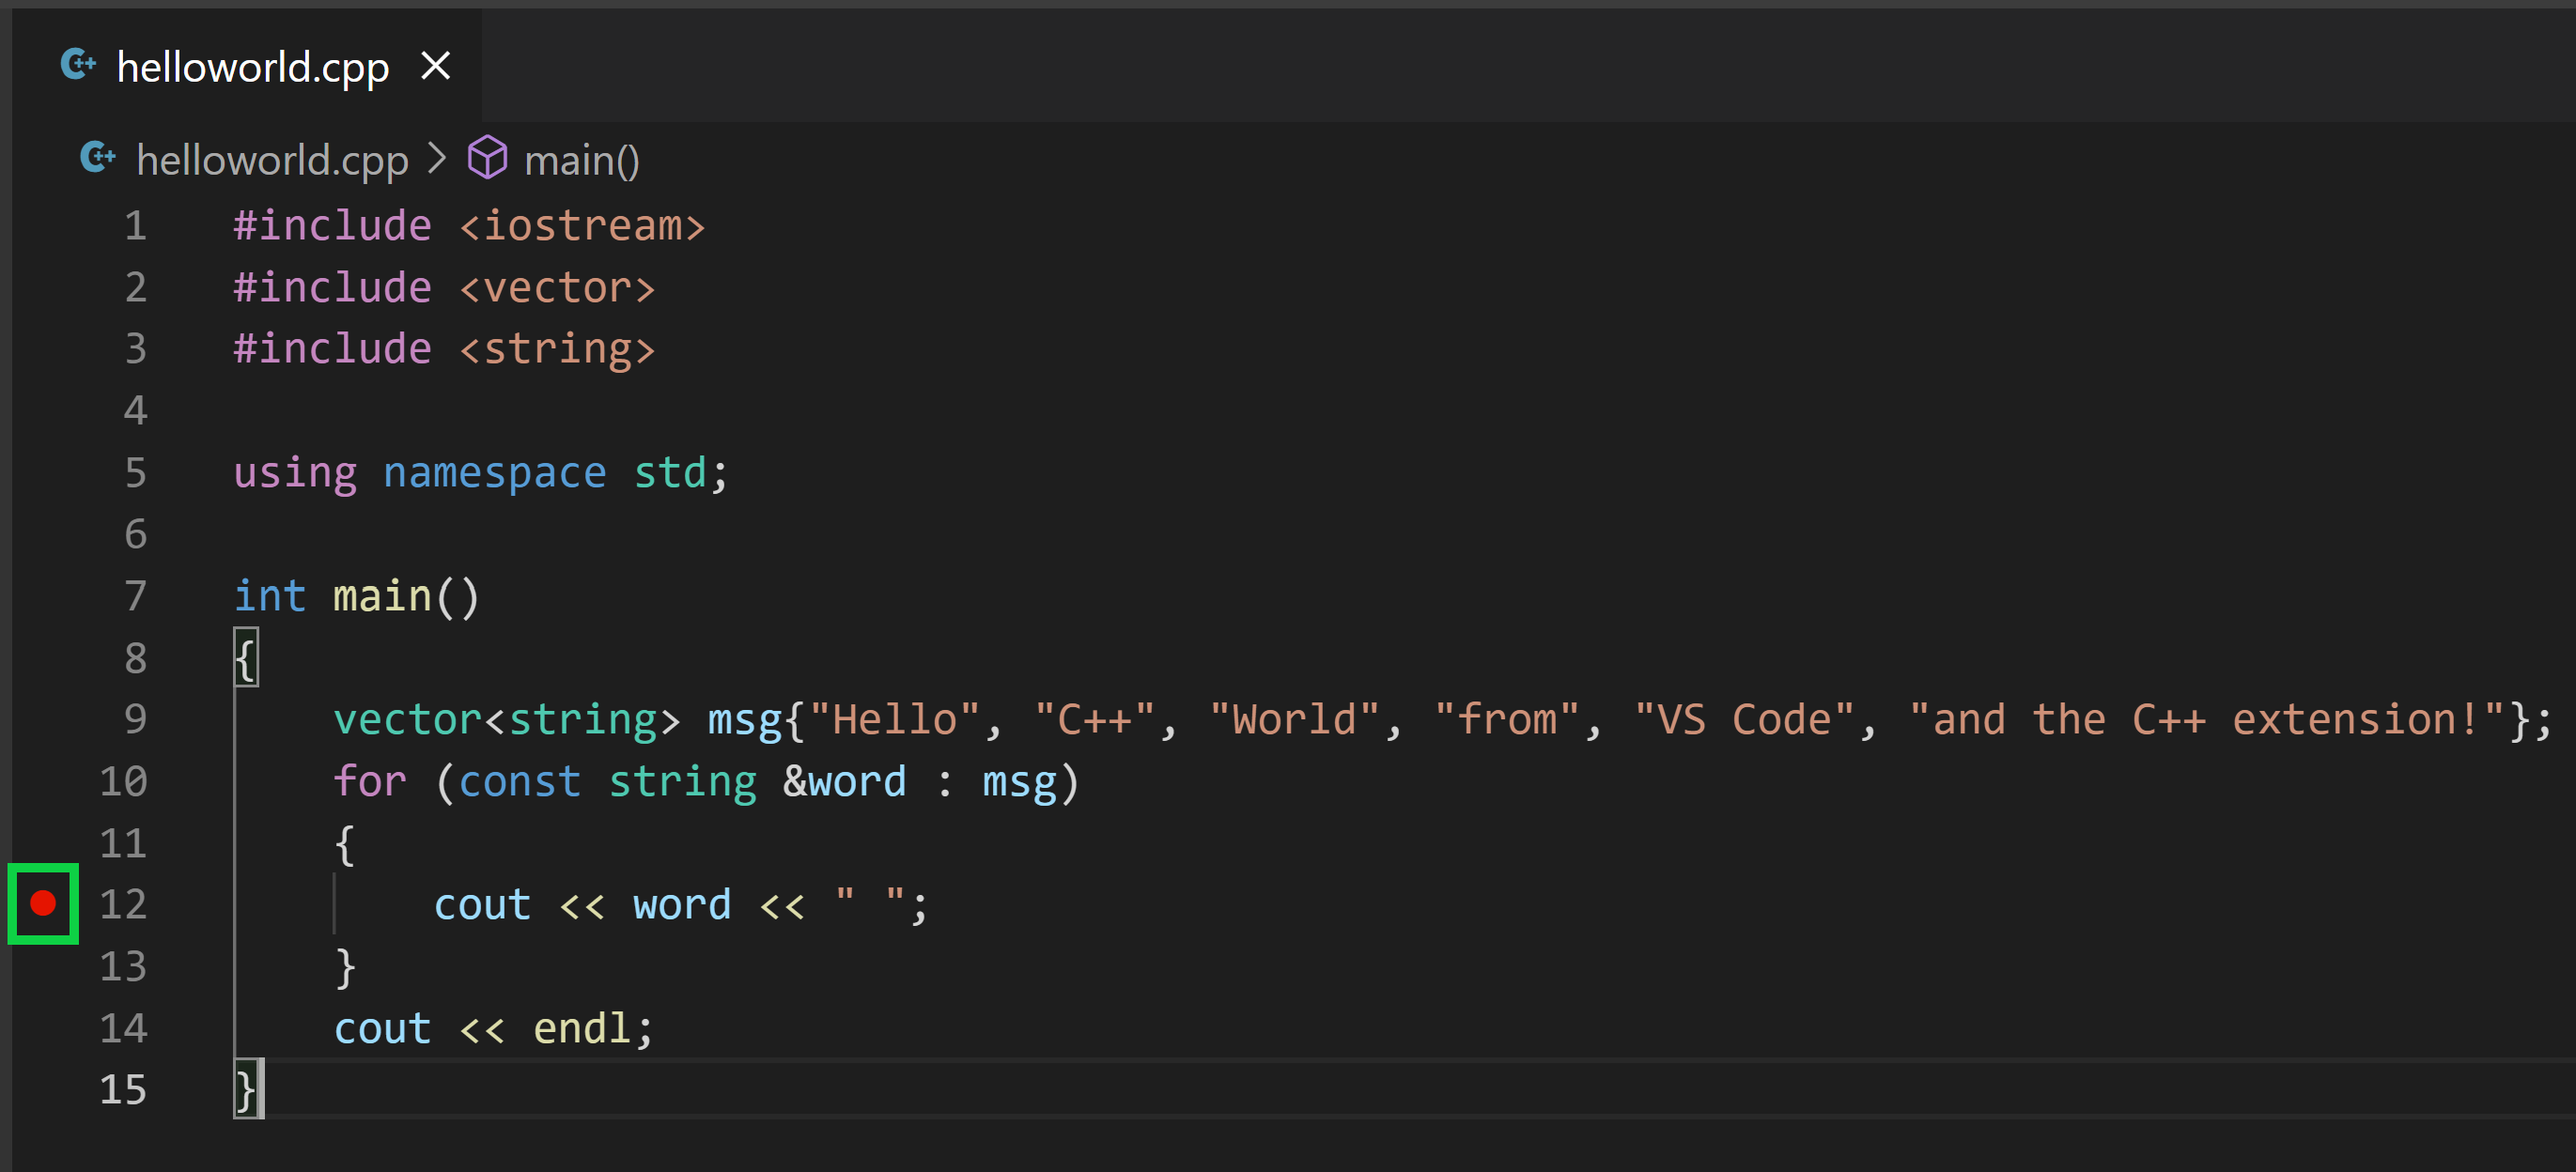
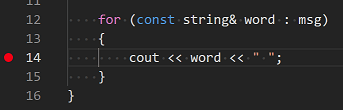
Set a breakpoint by clicking on the editor margin or using F9 on the current line.
-
From the drop-down next to the play button, select Debug C/C++ File.
-
Choose C/C++: g++ build and debug active file from the list of detected compilers on your system (you’ll only be asked to choose a compiler the first time you run or debug
helloworld.cpp).
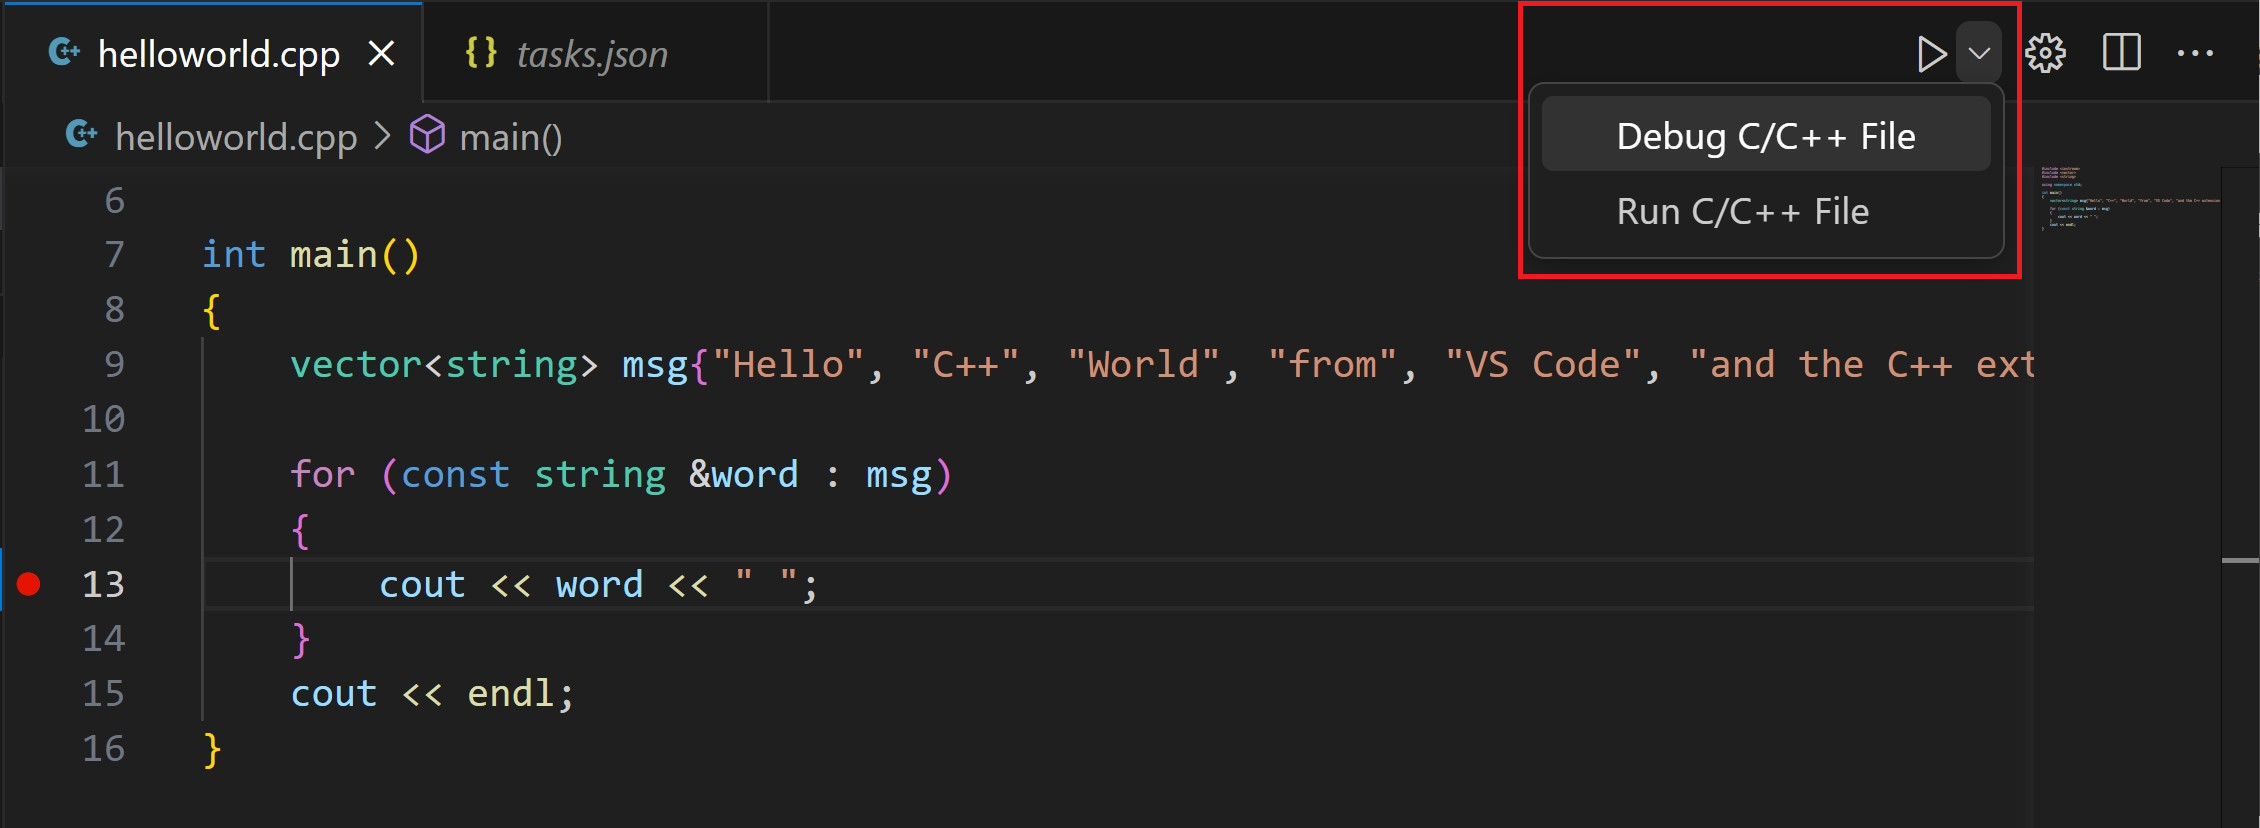
The play button has two modes: Run C/C++ File and Debug C/C++ File. It will default to the last-used mode. If you see the debug icon in the play button, you can just select the play button to debug, instead of using the drop-down.
Explore the debugger
Before you start stepping through the code, let’s take a moment to notice several changes in the user interface:
-
The Integrated Terminal appears at the bottom of the source code editor. In the Debug Output tab, you see output that indicates the debugger is up and running.
-
The editor highlights the line where you set a breakpoint before starting the debugger:
-
The Run and Debug view on the left shows debugging information. You’ll see an example later in the tutorial.
-
At the top of the code editor, a debugging control panel appears. You can move this around the screen by grabbing the dots on the left side.
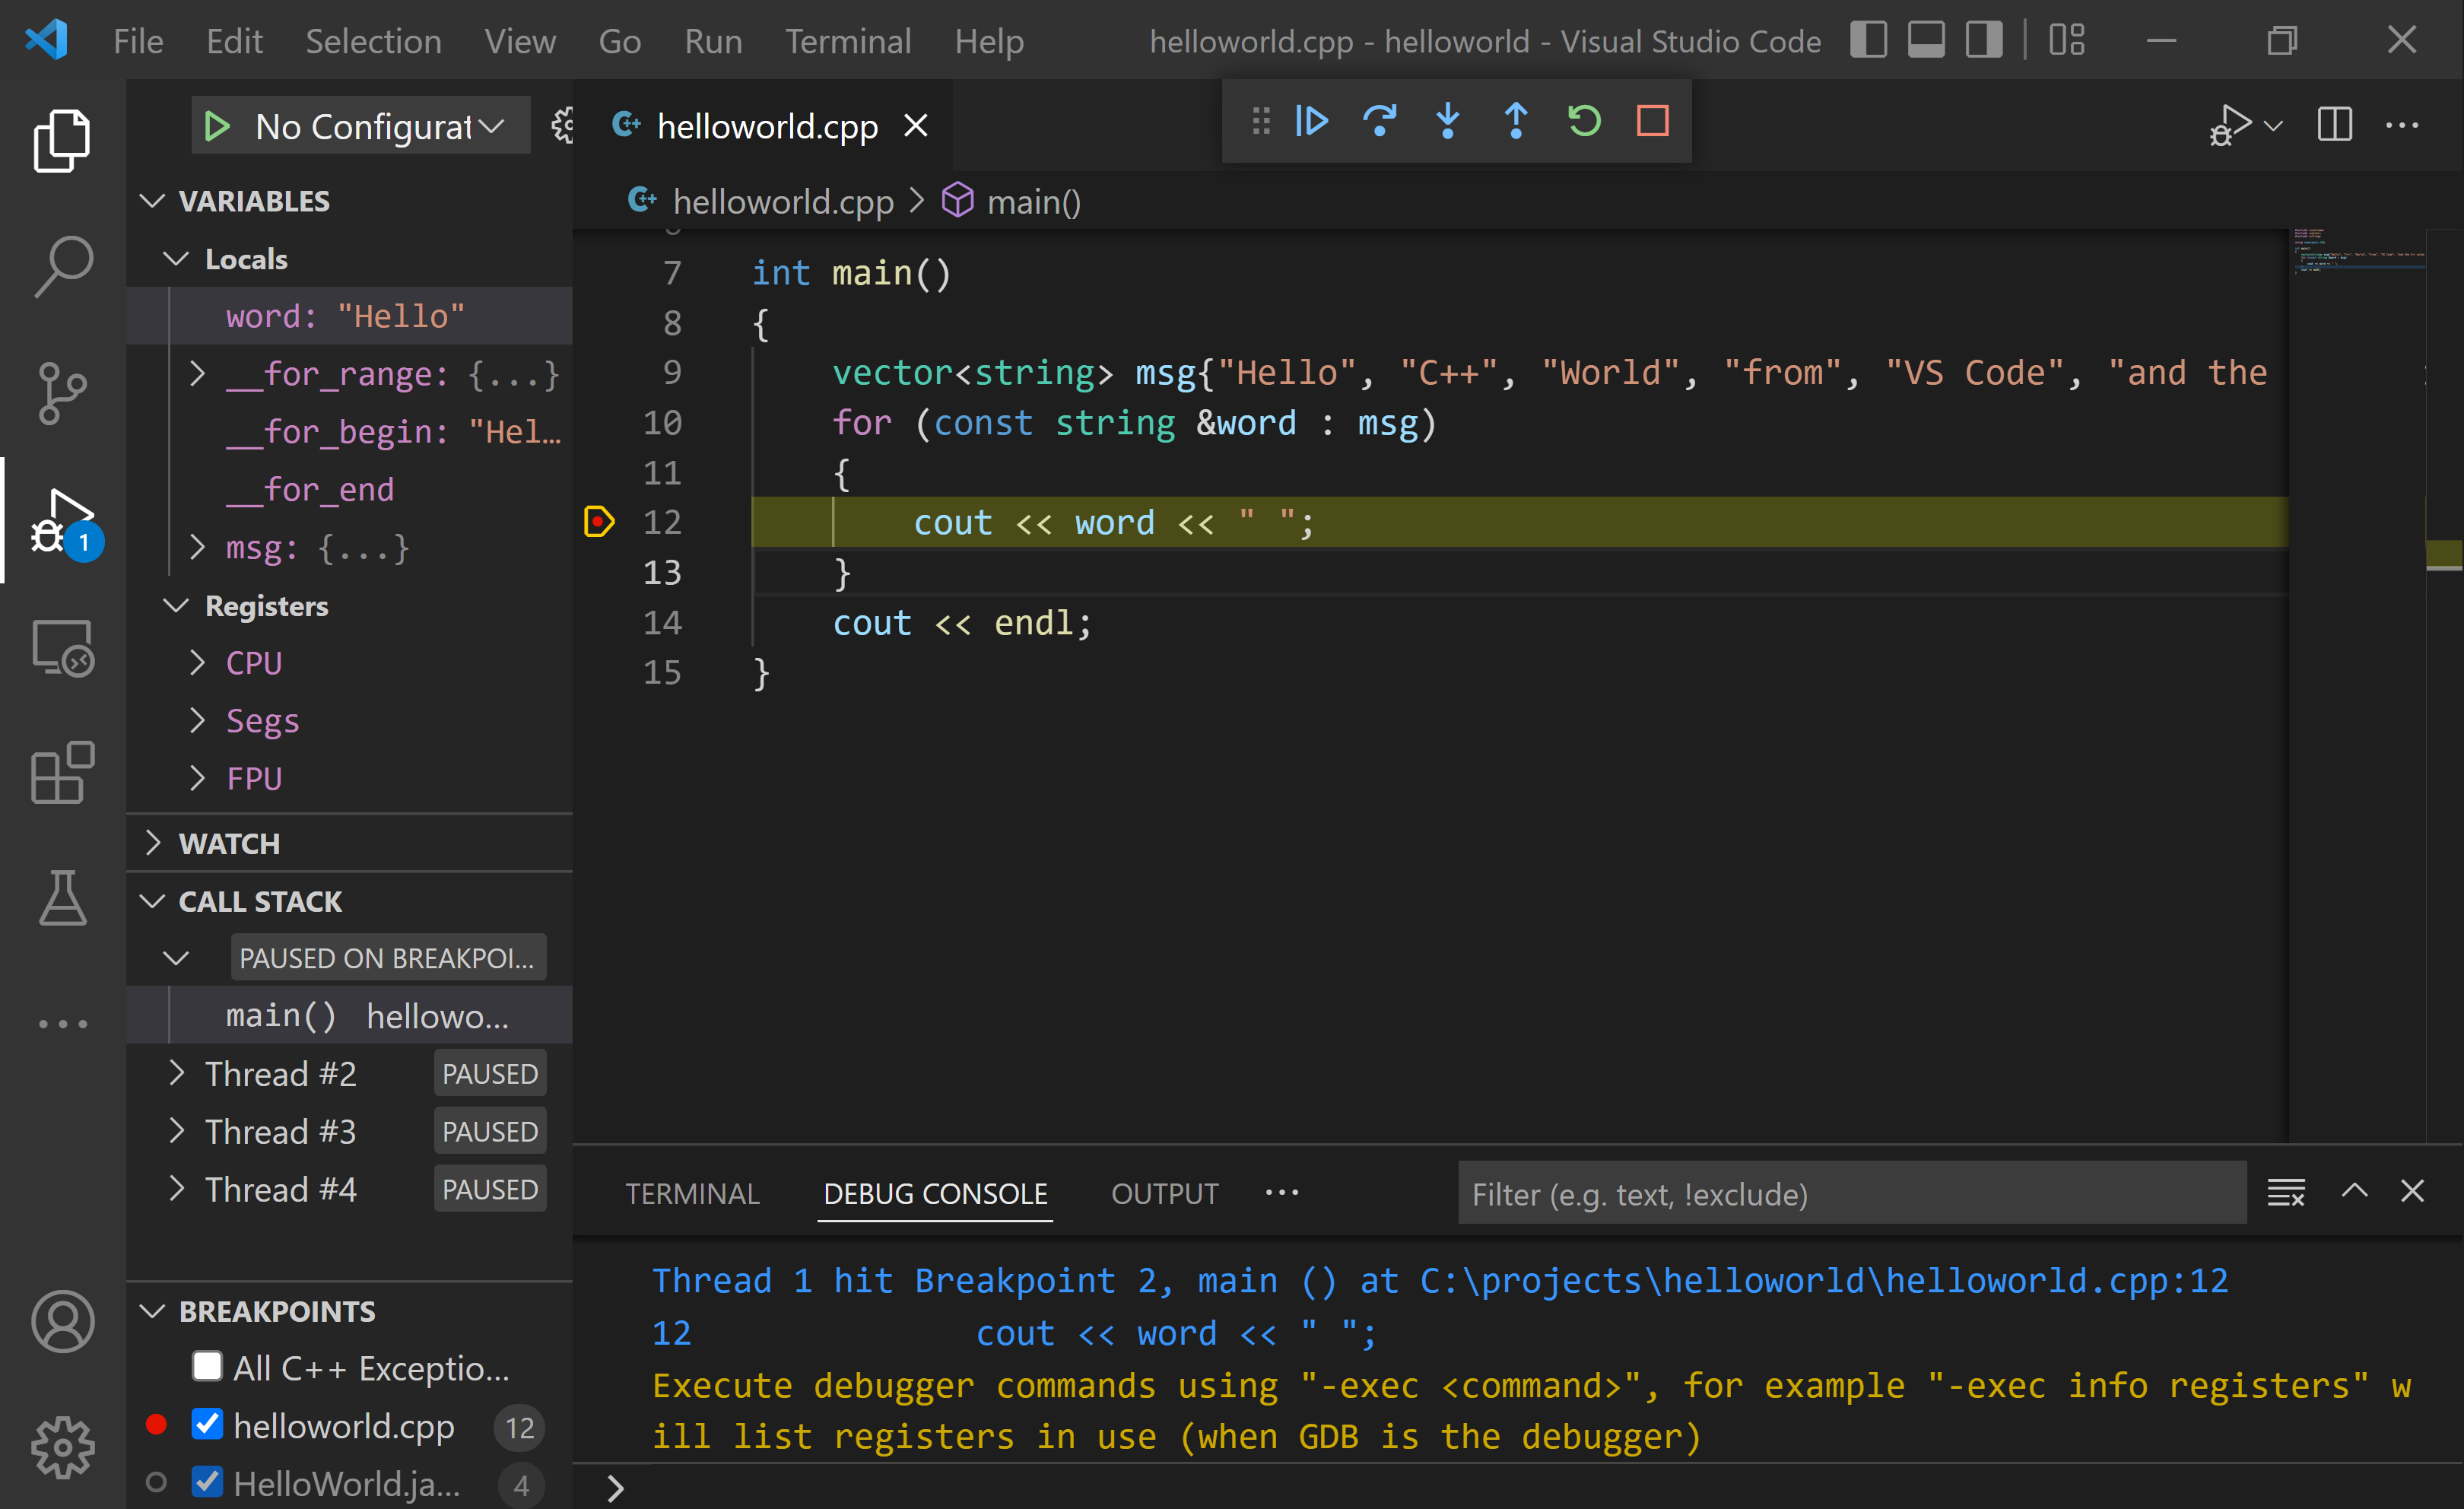
Step through the code
Now you’re ready to start stepping through the code.
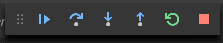
-
Click or press the Step over icon in the debugging control panel.
This will advance program execution to the first line of the for loop, and skip over all the internal function calls within the
vectorandstringclasses that are invoked when themsgvariable is created and initialized. Notice the change in the Variables window on the left.In this case, the errors are expected because, although the variable names for the loop are now visible to the debugger, the statement has not executed yet, so there is nothing to read at this point. The contents of
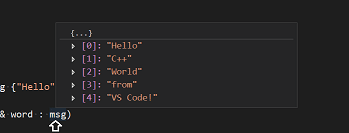
msgare visible, however, because that statement has completed. -
Press Step over again to advance to the next statement in this program (skipping over all the internal code that is executed to initialize the loop). Now, the Variables window shows information about the loop variables.
-
Press Step over again to execute the
coutstatement. (Note that as of the March 2019 release, the C++ extension does not print any output to the Debug Console until the loop exits.) -
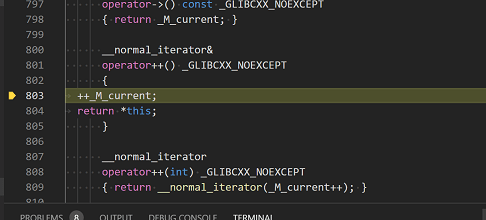
If you like, you can keep pressing Step over until all the words in the vector have been printed to the console. But if you are curious, try pressing the Step Into button to step through source code in the C++ standard library!
To return to your own code, one way is to keep pressing Step over. Another way is to set a breakpoint in your code by switching to the
helloworld.cpptab in the code editor, putting the insertion point somewhere on thecoutstatement inside the loop, and pressing F9. A red dot appears in the gutter on the left to indicate that a breakpoint has been set on this line.Then press F5 to start execution from the current line in the standard library header. Execution will break on
cout. If you like, you can press F9 again to toggle off the breakpoint.When the loop has completed, you can see the output in the Integrated Terminal, along with some other diagnostic information that is output by GDB.
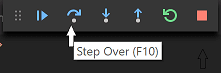

Set a watch
Sometimes you might want to keep track of the value of a variable as your program executes. You can do this by setting a watch on the variable.
-
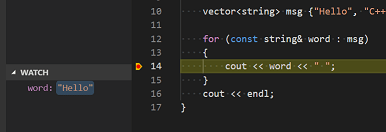
Place the insertion point inside the loop. In the Watch window, click the plus sign and in the text box, type
word, which is the name of the loop variable. Now view the Watch window as you step through the loop. -
Add another watch by adding this statement before the loop:
int i = 0;. Then, inside the loop, add this statement:++i;. Now add a watch forias you did in the previous step. -
To quickly view the value of any variable while execution is paused on a breakpoint, you can hover over it with the mouse pointer.
Customize debugging with launch.json
When you debug with the play button or F5, the C++ extension creates a dynamic debug configuration on the fly.
There are cases where you’d want to customize your debug configuration, such as specifying arguments to pass to the program at runtime. You can define custom debug configurations in a launch.json file.
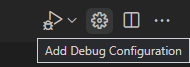
To create launch.json, choose Add Debug Configuration from the play button drop-down menu.
You’ll then see a dropdown for various predefined debugging configurations. Choose C/C++: g++.exe build and debug active file.
VS Code creates a launch.json file in the .vscode folder`, which looks something like this:
{
  "configurations": [
    {
      "name": "C/C++: g++.exe build and debug active file",
      "type": "cppdbg",
      "request": "launch",
      "program": "${fileDirname}\\${fileBasenameNoExtension}.exe",
      "args": [],
      "stopAtEntry": false,
      "cwd": "${fileDirname}",
      "environment": [],
      "externalConsole": false,
      "MIMode": "gdb",
      "miDebuggerPath": "C:\\msys64\\ucrt64\\bin\\gdb.exe",
      "setupCommands": [
        {
          "description": "Enable pretty-printing for gdb",
          "text": "-enable-pretty-printing",
          "ignoreFailures": true
        },
        {
          "description": "Set Disassembly Flavor to Intel",
          "text": "-gdb-set disassembly-flavor intel",
          "ignoreFailures": true
        }
      ],
      "preLaunchTask": "C/C++: g++.exe build active file"
    }
  ],
  "version": "2.0.0"
}
In the JSON above, program specifies the program you want to debug. Here it is set to the active file folder (${fileDirname}) and active filename with the .exe extension (${fileBasenameNoExtension}.exe), which if helloworld.cpp is the active file will be helloworld.exe. The args property is an array of arguments to pass to the program at runtime.
By default, the C++ extension won’t add any breakpoints to your source code and the stopAtEntry value is set to false.
Change the stopAtEntry value to true to cause the debugger to stop on the main method when you start debugging.
From now on, the play button and F5 will read from your
launch.jsonfile when launching your program for debugging.
Adding additional C/C++ settings
If you want more control over the C/C++ extension, you can create a c_cpp_properties.json file, which will allow you to change settings such as the path to the compiler, include paths, C++ standard (default is C++17), and more.
You can view the C/C++ configuration UI by running the command C/C++: Edit Configurations (UI) from the Command Palette (⇧⌘P (Windows, Linux Ctrl+Shift+P)).
This opens the C/C++ Configurations page. When you make changes here, VS Code writes them to a file called c_cpp_properties.json in the .vscode folder.
Here, we’ve changed the Configuration name to GCC, set the Compiler path dropdown to the g++ compiler, and the IntelliSense mode to match the compiler (gcc-x64).
Visual Studio Code places these settings in .vscode\c_cpp_properties.json. If you open that file directly, it should look something like this:
{
  "configurations": [
    {
      "name": "GCC",
      "includePath": ["${workspaceFolder}/**"],
      "defines": ["_DEBUG", "UNICODE", "_UNICODE"],
      "windowsSdkVersion": "10.0.22000.0",
      "compilerPath": "C:/msys64/mingw64/bin/g++.exe",
      "cStandard": "c17",
      "cppStandard": "c++17",
      "intelliSenseMode": "windows-gcc-x64"
    }
  ],
  "version": 4
}
You only need to add to the Include path array setting if your program includes header files that are not in your workspace or in the standard library path.
Compiler path
The extension uses the compilerPath setting to infer the path to the C++ standard library header files. When the extension knows where to find those files, it can provide features like smart completions and Go to Definition navigation.
The C/C++ extension attempts to populate compilerPath with the default compiler location based on what it finds on your system. The extension looks in several common compiler locations.
The compilerPath search order is:
- First check for the Microsoft Visual C++ compiler
- Then look for g++ on Windows Subsystem for Linux (WSL)
- Then g++ for MinGW-w64.
If you have Visual Studio or WSL installed, you may need to change compilerPath to match the preferred compiler for your project. For example, if you installed MinGW-w64 version 8.1.0 using the i686 architecture, Win32 threading, and sjlj exception handling install options, the path would look like this: C:\Program Files (x86)\mingw-w64\i686-8.1.0-win32-sjlj-rt_v6-rev0\mingw64\bin\g++.exe.
Troubleshooting
MSYS2 is installed, but g++ and gdb are still not found
You must follow the steps on the MSYS2 website to use the MSYS CLI to install the full MinGW-w64 toolchain(pacman -S --needed base-devel mingw-w64-ucrt-x86_64-toolchain), as well as all required prerequisites. The toolchain includes g++ and gdb.
As a Windows user, running the pacman command gives me an error
UCRT on Windows machines is only included in Windows 10 or later. If you are using another version of Windows, run the following command that does not use UCRT:
pacman -S --needed base-devel mingw-w64-x86_64-toolchain
When adding the the MinGW-w64 destination folder to your list of environment variables, the default path will then be: C:\msys64\mingw64\bin.
MinGW 32-bit
If you need a 32-bit version of the MinGW toolset, consult the Downloading section on the MSYS2 wiki. It includes links to both 32-bit and 64-bit installation options.
Next steps
- Explore the VS Code User Guide.
- Review the Overview of the C++ extension.
- Create a new workspace, copy your
.vscodeJSON files to it, adjust the necessary settings for the new workspace path, program name, etc. and start coding!
7/14/2023
Прежде чем
двигаться дальше, нам нужно настроить рабочее место для написания программ на
Си. А, именно, установить (если его еще нет) компилятор и интегрированную среду
разработки для написания, компиляции и отладки программ. Начнем с выбора и
установки компилятора. На сегодняшний день одним из самых популярных является
компилятор gcc. Это сокращение
от:
GNU Compiler Collection
Если вы
работаете под ОС Linux, то, этот компилятор должен быть уже
установлен в системе. Если же вы работаете под ОС Windows, то компилятор
нужно устанавливать самим. Давайте это сделаем.
Так как я
работаю под ОС Windows, то буду показывать порядок установки
всех средств именно на этой ОС. Итак, первым делом нужно перейти на официальный
сайт компилятора gcc, предназначенных для ОС Windows:
https://gcc.gnu.org
Далее, переходим
в раздел Download/Binaries (бинарники) и
видим несколько вариантов способов установки gcc на систему. Наиболее
удобный, на мой взгляд, является использование, так называемого, порта MinGW с установкой
только необходимых (минимального набора) компонент компилятора gcc.
Здесь есть два
варианта MinGW: старый
32-битный и новый – 64-битный. Я рекомендую воспользоваться старым вариантом,
т.к. он хорошо себя зарекомендовал и, что называется, проверен временем. С
новым могут возникать проблемы, да и для языка Си стандарта C99 он явно
избыточен.
Нажимаем на
ссылку MinGW и нас
перенаправляют на страницу:
https://osdn.net/projects/mingw/
и здесь нам
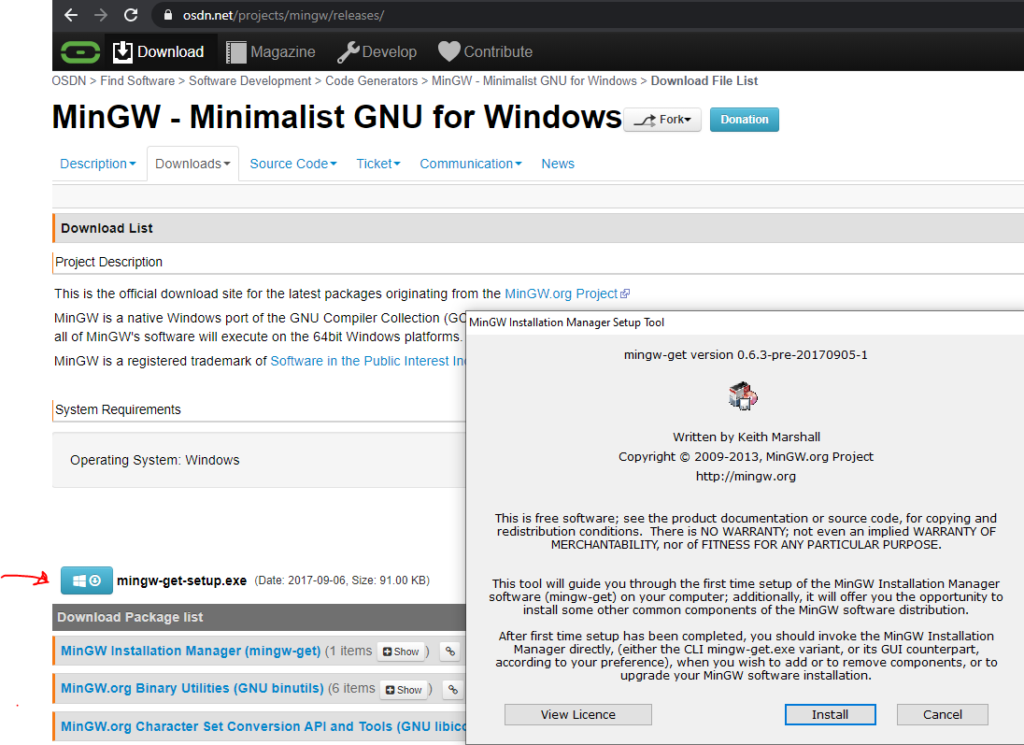
нужно скачать установщик mingw-get-setup.exe.
Запускаем эту
программу. Появится следующее диалоговое окно:
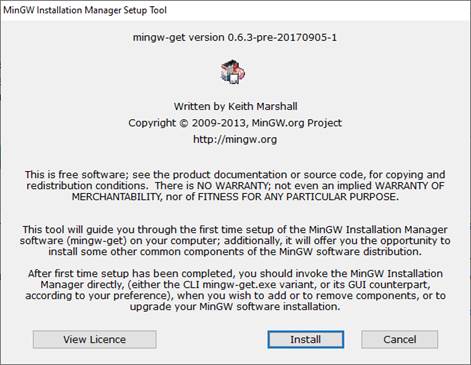
Нажимаем здесь
кнопку «Install». В следующем
окне соглашаемся со всеми настройками по умолчанию, в том числе и с маршрутом
распаковки «C:\MinGW» (если вас он
не устраивает, то можете изменить на свой) и нажимаем на кнопку «Continue». Начнется
скачивание и установка. После установки этот инсталлятор автоматически
запустится:
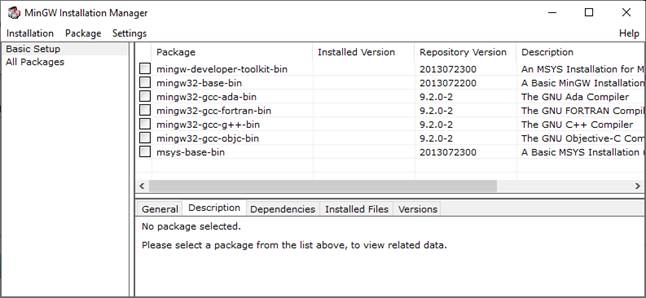
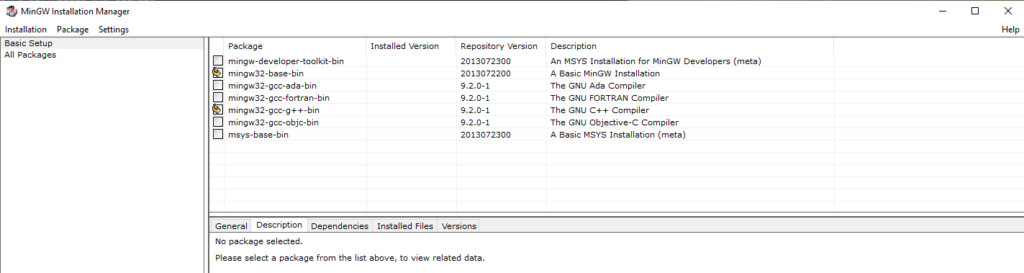
В диалоговом
окне нам нужно выбрать все необходимые компоненты для установки компилятора gcc для языка Си. Они
следующие:
- mingw32-gcc-bin (после отметки
также дополнительно отмечаются другие компоненты, с которыми mingw32-gcc-bin работает
совместно); - mingw32-gcc-g++-bin (для установки
линкера для компилятора Си); - mingw32-make-bin;
- mingw32-gdb-bin (дебаггер, для
отладки кода).
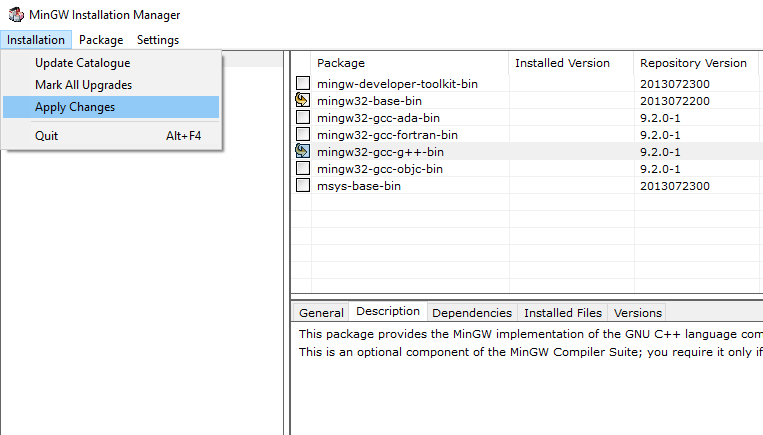
После этого в
меню «Installation» выбираем пункт
«Apply Changes» и в окне
нажимаем кнопку «Apply»:

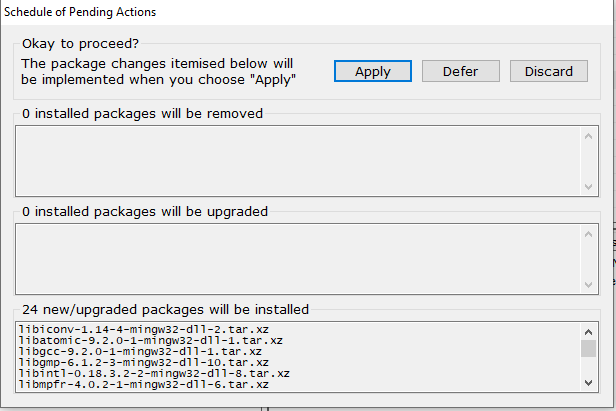
Начнется
установка выбранных компонент для компилятора gcc в указанный
каталог.
Далее, нужно
прописать в системе путь к каталогу компилятора gcc. Для этого
нажимаем правую кнопку мыши на кнопке «Пуск» и выбираем «система». В
появившемся диалоговом окне щелкаем на «Дополнительные параметры системы», и
затем «Переменные среды…». Появится еще одно диалоговое окно, в котором нас
будет интересовать системная переменная Path:
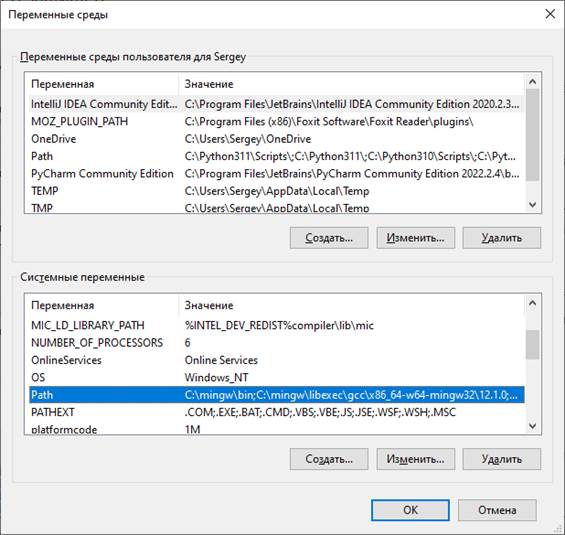
Два раза щелкаем
по строчке с переменной Path, появится следующее окно, в котором
следует добавить путь «C:\mingw\bin» в переменную Path.
Все, компилятор gcc установлен в ОС Windows и готов к
работе. Чтобы в этом убедиться, откроем командное окно (комбинация Win+R, набираем cmd и кнопка «OK»), набираем в
нем gcc и должны
увидеть следующие строчки:
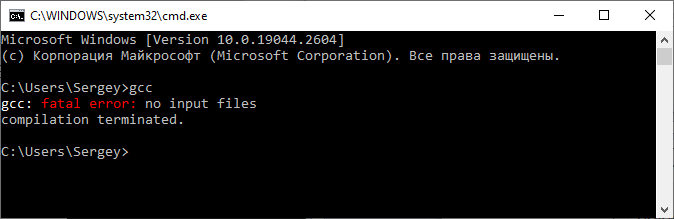
Если у вас все
отображается именно так, то компилятор был успешно установлен.
Установка и настройка Visual Studio Code
Следующим шагом
нам нужно установить интегрированную среду для написания, компиляции и отладки
наших программ написанных на языке Си. Для этого, на мой взгляд, удобно
воспользоваться программой Visual Studio Code, доступной на
странице официального сайта:
https://code.visualstudio.com
Именно в ней я
буду писать и показывать все тексты программ данного курса. При желании, вы,
конечно, можете использовать любую другую среду, главное, чтобы в ней было
удобно компилировать и отлаживать программы на Си.
Первым делом,
конечно же, нужно скачать дистрибутив программы Visual Studio Code и установить
себе на компьютер. Ничего сложно в этом нет. Далее, открываем эту программу.
Для начала работы нам нужно определиться, где будут располагаться файлы
текущего проекта. Делается это очень просто. На диске в любом желаемом месте
создается папка, которая, затем, выбирается в программе VS Code. В моем случае
– это путь:
D:\Visual
Studio\Code\course
У вас может быть
любой другой. Сейчас каталог пустой. Поэтому для начала работы в него нужно
поместить файл, в котором будем писать текст программы. Например, его можно
назвать так:
lessons.c
Обратите
внимание, файл с текстом программы на языке Си должен иметь расширение «c». Теперь здесь
можно написать простую программу. Пусть это будет классический «Hello, world!»:
#include <stdio.h>

int main(void)
{
    printf("Hello, world\n");
    return 0;
}
Не беспокойтесь
пока о том, что содержимое этой программы вам, возможно, непонятно. Ее мы
подробно еще будем разбирать. Пока, на этом этапе, нам нужно просто настроить
среду разработки для компиляции и запуска программ на Си.
По идее, мы уже
сейчас можем достаточно просто скомпилировать эту программу. Для этого нажимаем
Ctrl + ~, появится
окно powershell и в нем вручную
можно вызвать компилятор gcc следующим образом:
gcc lessons.c
Если мы все
сделали правильно, то в текущем каталоге появится исполняемый файл a.exe, который
выводит в консоль сообщение «Hello, world!»:
.\a
Конечно,
постоянно выполнять компиляцию через терминал очень неудобно, поэтому нам нужно
настроить редактор VS Code под компиляцию
Си-программ. Для этого необходимо установить некоторые полезные расширения (extensions). Щелкаем слева
на кнопку с квадратиками и в поиске набираем «c lange»:
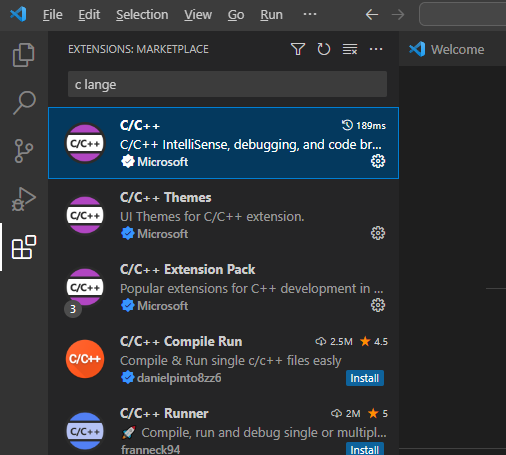
Выбираем первый
компонент C/C++ компании Microsoft, которая
позволяет выполнять разработку программ на языке Си.
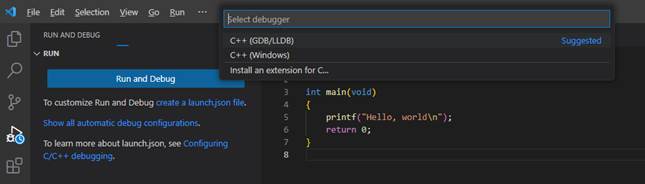
После этого,
слева щелкаем на кнопку с треугольником (Run and Debug) и нажимаем на
кнопку «Run and Debug». Сверху в
выпадающем списке следует выбрать «C++ (GDB/LLDB)» (это ранее
установленный компилятор gcc), затем, скомпилировать и выполнить
программу в режиме Debug (отладки):
Например, можно
поставить в любом месте программы точку останова, снова запустить, и программа
остановится на выбранной строке. Это, как раз и есть процесс отладки кода.
Далее установим
еще одно расширение, которое будет отвечать за простой процесс запуска кода без
режима отладки. Чтобы можно было быстро и просто запустить программу и
посмотреть, что получается. Для этого переходим на вкладку «extensions» и набираем:
code runner
Это расширение
позволяет с помощью комбинации клавиш Ctrl+Alt+N компилировать и запускать
код. Результат отображается во вкладке «OUTPUT».
Настройка компилятора на стандарт C99
Последнее, что
нам осталось – это настроить компилятор на стандарт C99. Формально,
это делается с помощью специального флага -std следующим
образом:
gcc
-std=c99 -o outputfile sourcefile.c
Такой флаг нам
нужно добавить в настройках компилятора. Первым делом откроем файл tasks.json в
текущем каталоге и пропишем для ключа «args» первым
элементом этот ключ:
«args»: [
«-std=c99»,
…
]
Этот флаг будет
срабатывать при перекомпиляции проекта – комбинация клавиш Ctrl+Shift+B.
Точно такой же
ключ нужно добавить для компилятора, используемого расширением «Code Runner». Для этого переходим в меню File->Preferences->Settings и в строке набираем «code
runner run in terminal». Ставим
галочку.
Затем, в этом же
окне настроек набираем в строке «Run Code Configuration». Находим в настройках
раздел «Code-runner: Executor Map» и нажимаем на редактирование. Для ключа «c» после «gcc» прописываем «-std=c99» и ключ «code-runner.runInTerminal» устанавливаем в
false. Все, теперь
компилятор будет ориентироваться на стандарт c99 при
компиляции наших программ.
Видео по теме
Search code, repositories, users, issues, pull requests…
Provide feedback
Saved searches
Use saved searches to filter your results more quickly
Sign up
I am programming in C in Visual Studio Code, but I can’t compile, as VSC only offers three compilers built in — Node.js, C# Mono, and Extension development. After a little bit of digging I came across the Visual Studio Marketplace. This seemed like the right sort of thing, but only four uncommon languages were there.
I can only assume that C debugging support is built in, I just can’t find it or I am going the wrong way about doing it. I attempted to create a new launch.json (the manifest that seems to hold the compiling/debugging settings for each file) and manually entering the GCC binaries that I have, but that didn’t end up working. I’m currently stuck manually compiling the C source file I am working on through command prompt.
Would really help if someone could point me in the right direction on what to do.
tl;dr — Help from anyone debugging C in Visual Studio Code
Windows 8, if that matters
Cheers!
![]()
Gama11
31.8k9 gold badges79 silver badges101 bronze badges
asked Dec 3, 2015 at 4:16
![]()
6
Caution
A friendly reminder: The following tutorial is for Linux user instead of Windows
Tutorial
If you want to debug your c++ code with GDB
You can read this ( Debugging your code ) article from Visual Studio Code official website.
Step 1: Compilation
You need to set up task.json for compilation of your cpp file
or simply type in the following command in the command window
g++ -g file.cpp -o file.exe
to generate a debuggable .exe file
Step 2: Set up the launch.json file
To enable debugging, you will need to generate a launch.json file
follow the launch.json example or google others
Step 3: Press (Ctrl+F5) to start compiling
this launch.json file will launch the configuration when you press the shortcut (Ctrl+F5)
Enjoy it!
ps. For those who want to set up tasks.json, you can read this from vscode official (-> TypeScript Hello World)
answered Oct 9, 2017 at 15:07
![]()
WY HsuWY Hsu
1,8272 gold badges22 silver badges33 bronze badges
1
Press Ctrl + Shift + P to pull up the Command Pallette, and Type ext install cpptools. It will install everything you need to debug C and C++.
Debugging in VS code is very complete, but if you just need to compile and run:
https://code.visualstudio.com/docs/languages/cpp
Look in the debugging section, and it will explain everything.
![]()
Nate T
7375 silver badges21 bronze badges
answered Apr 8, 2016 at 4:18
![]()
guest23guest23
1711 silver badge3 bronze badges
1
For Windows:
- Install MinGW or Dev C++
- Open Environment Variables
- In System Variable select Path -> Edit -> New
- Copy this
C:\Program Files (x86)\Dev-Cpp\MinGW64\binto the New window.
(If you have MinGW installed copy its /bin path). - To check if you have added it successfully: Open CMD -> Type «gcc» and it should return:
gcc: fatal error: no input files compilation terminated. - Install C/C++ for Visual Studio Code && C/C++ Compile Run || Code Runner
- If you installed only C/C++ Compile Run extension you can compile your program using F6/F7
- If you installed the second extension you can compile your program using the button in the top bar.
Screenshot: Hello World compiled in VS Code
answered Jun 16, 2019 at 21:19
![]()
Just wanted to add that if you want to debug stuff, you should compile with debug information before you debug, otherwise the debugger won’t work. So, in g++ you need to do g++ -g source.cpp. The -g flag means that the compiler will insert debugging information into your executable, so that you can run gdb on it.
![]()
Rob♦
27k16 gold badges82 silver badges98 bronze badges
answered Oct 22, 2016 at 11:50
![]()
0
EDIT: As of ~March 2016, Microsoft offers a C/C++ extension for Visual Studio Code and therefor the answer I originally gave is no longer valid.
Visual Studio Code doesn’t support C/C++ very well. As such it doesn’t >naturally support gcc or gdb within the Visual Studio Code application.
The most it will do is syntax highlighting, the advanced features like >intellisense aren’t supported with C. You can still compile and debug code >that you wrote in VSC, but you’ll need to do that outside the program itself.
answered Dec 3, 2015 at 5:11
![]()
Данный текст будет полезен тем, кто давно хотел слезть с иглы тяжеленных IDE, но настройка компилятора под себя – казалось делом неблагодарным и запутанным.
VS Code – это лишь редактор кода. Это не среда разработки – здесь нет встроенного компилятора или дебаггера. Здесь есть только их поддержка. Чем более инструмент универсален – тем сложнее вначале разобраться в его особенностях. Однако, здесь нет ничего невозможного! Если правильно один раз настроить VS Code, то вы получите замечательную среду с помощью которой можно поддерживать различные проекты на совершенно разных языках.

VS Code является легковесным, кроссплатформенным редактором кода. Одной из его главных особенностей является поддержка кучи плагинов. Плагины позволяют расширять технологию IntelliSense (автодополнение кода) на разные языки программирования, добавлять поддержку специфического оборудования, отладчиков и прочее. Очень приятная и гибкая цветовая схема не раздражает даже после многочасового просиживания в процессе работы.
В общем-то поэтому решил написать как подготовить себе приятную среду разработки. В данном случае – под C и C++
Картинки кликабельны. И их максимально много. Если считаете, что что-то слишком очевидно, то пропустите этот момент
Чаще всего используется компилятор gcc. Данный компилятор обычно идет совместно с Unix-осью. Для того, чтобы работать с этим компилятором на Windows, нужно установить некоторые инструменты разработки. Есть два больших и известных проекта, созданных с данной целью:
- MinGW
- Cygwin
Главное их отличие в том, что MinGW сосредоточен в основном на компиляторе с некой поддержкой системных команд, в то время как Cygwin старается эмулировать полноценную UNIX-среду.
Обсуждение на Stack Overflow на эту тему
https://stackoverflow.com/questions/771756/what-is-the-difference-between-cygwin-and-mingw
Установка MinGW
Первым делом нужно убедится, что на компьютере уже не установлен компилятор gcc. Нажмем Win+R и вызовем командную строку.
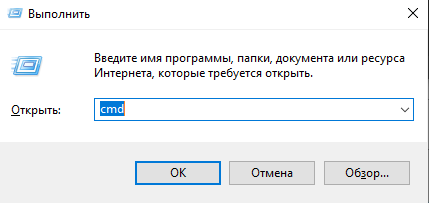
C:\Users\User> gcc -version
Если компилятор не установлен – выведется сообщение, что программа не найдена. Иначе, можно опустить установку и настройку MinGW и переходить прямо к разделу с настройкой VS Code.
Закрываем консоль (“cmd“) и переходим на официальный сайт проекта MinGW http://www.mingw.org/.
Ищем ссылку “Download” и переходим. Должно открыться что-то подобное, как на рисунке снизу.
Выбираем необходимые нам пакеты. Нам нужен базовый пакет mingw32-base и mingw32-gcc-g++. Отмечаем их
Внимание – приписка 32 в названии не означает работу приложения только и/или нацеленно на 32-битной платформе
После чего применяем внесенные изменения
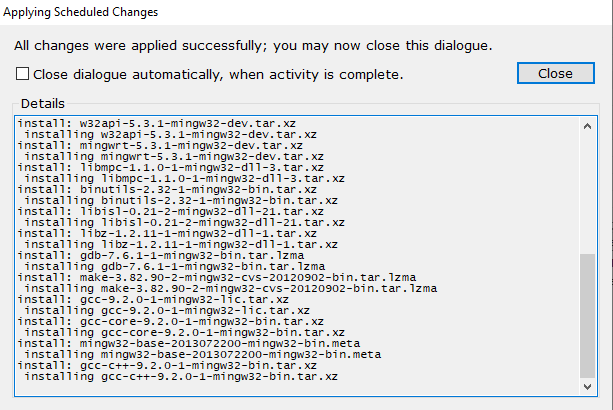
Видим, что будет установлено/обновлено 24 пакета
Новое окно сообщает об успешном применении изменений
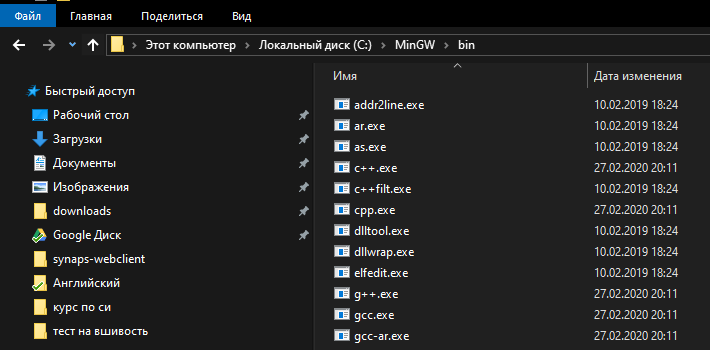
Теперь можем перейти в папку установки и убедиться в том, что все необходимое установлено (g++.exe и gcc.exe)
Выполним проверку установки переменной PATH. Проведем такую же проверку, как и в начале. Нажмем Win+R и вызовем командную строку.
Попросим компилятор вывести его версию следующей командой:
C:\Users\User> gcc -version
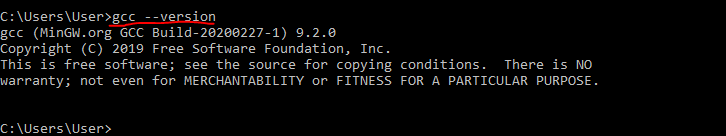
Если все сработало как нужно, то переходим к разделу с настройкой VS Code.
Если в консоли появилась ошибка, то нужно настроить переменную PATH. Это глобальная системная переменная и содержит в себе каталог исполняемых программ. То есть её настройка позволяет запустить программу по имени, не указывая полный путь до исполняемого файла. Их есть два вида – отдельная для каждого пользователя и одна общесистемная, которая доступна каждому пользователю.
Как настроить переменную PATH
Переходим в “Этот компьютер” и нажимаем правую кнопку -> свойства.
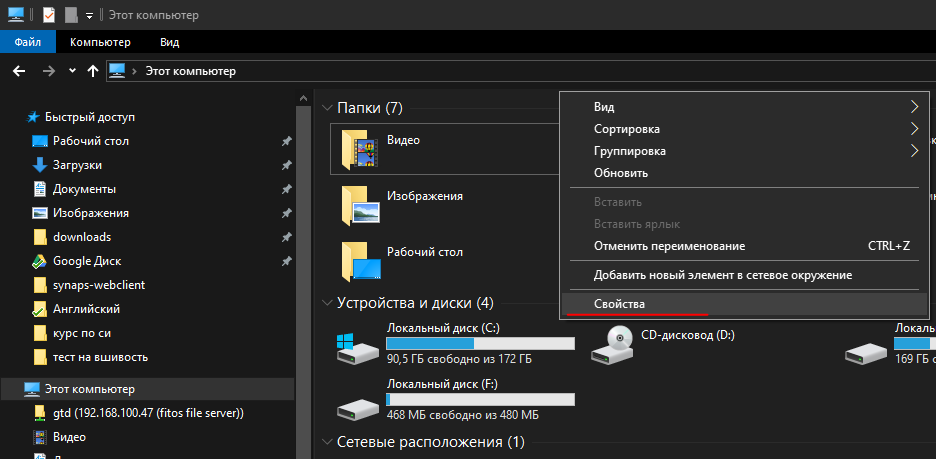
Далее в левой колонке жмем “Дополнительные параметры среды“
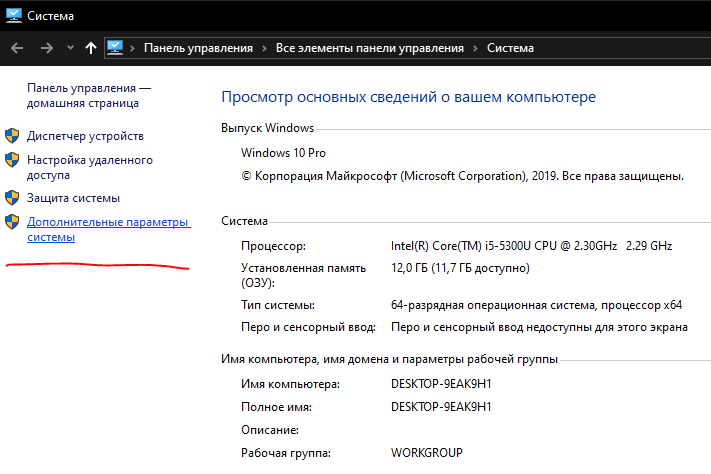
Далее в “Переменные среды“
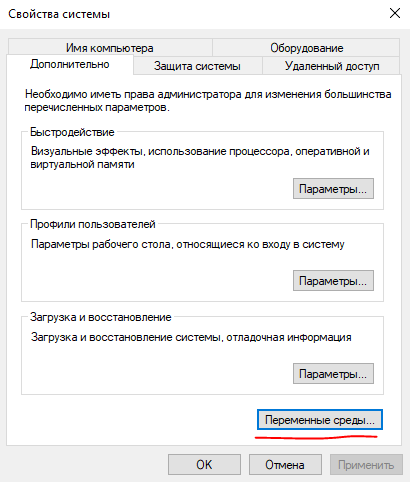
Выбираем в списке переменных сред для пользователя выбираем переменную PATH и жмем “Изменить“.
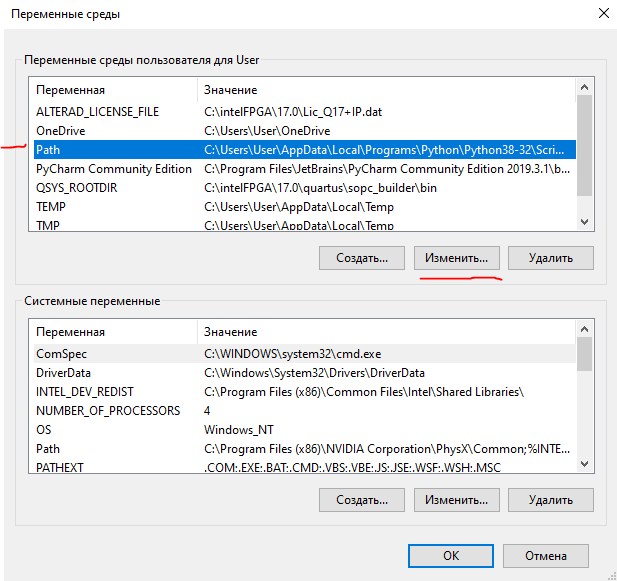
Жмем “Создать” и вписываем полный путь до папки MinGW\bin
Нажимаем “Ок” и снова вызываем командную строку – Win+R – cmd.
Внимание – чтобы изменения переменной PATH вступили в силу, командную строку нужно перезапустить, если она осталась открытой.
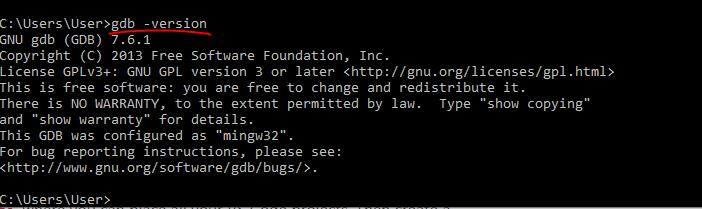
Выводим для проверки версию компилятора:
C:\Users\User> gcc -version
Заодно проверим дебаггер:
C:\Users\User> gdb -version
VS Code – Hellow World
Скачиваем с официального сайта абсолютно бесплатный VS Code.
https://code.visualstudio.com/
Процесс установки опустим – подсказок установщика достаточно
Для корректного автодополнения, дебага и подсказок по документации стоит установить расширение C/C++.
Расширения устанавливаются прямо из VS Code во вкладке “Extensions” или Ctrl+Shift+X. На нижней картинке эта вкладка подчеркнута в левом столбце.
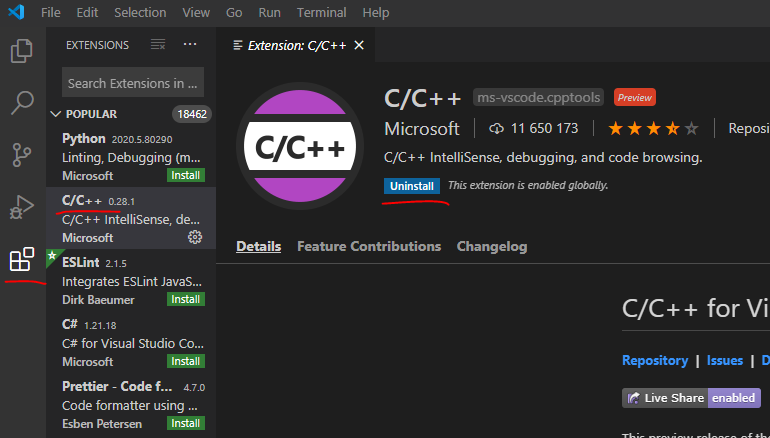
Найдем через строку поиска C/C++ и установим.
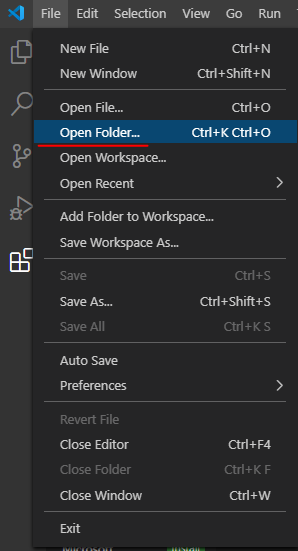
Далее создаем папку будущего проекта в произвольном месте на компьютере. Свою назвал “helloworld“. Она будет папкой всего проекта, который вы будете разрабатывать. В VS Code открываем папку используя File > Open Folder…
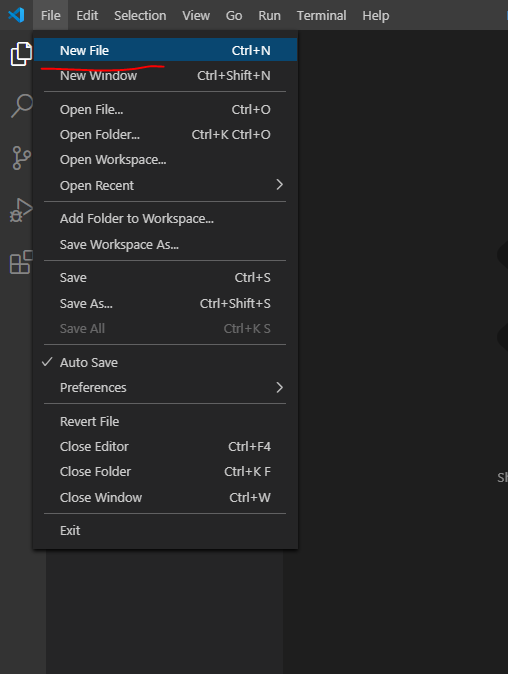
Откроется проект. Пока он пустой. Создадим первый файл в проекте через File > New File
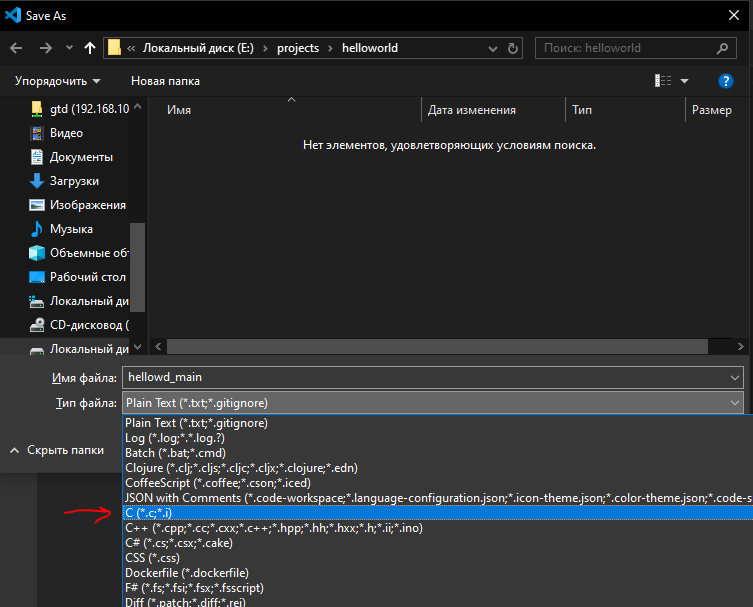
Чтобы VS Code начал предлагать подсказки по вводу и подсвечивать синтаксис, следует сразу после создания файла сохранить его в необходимом расширении. По сути сейчас вы определяете язык будущего проекта. Нажимаете File > Save… и в открывшемся окне выбираете тип файла. Т.к. наш тестовый проект пишется на Си, выбираем его в выпадающем списке Тип файла.
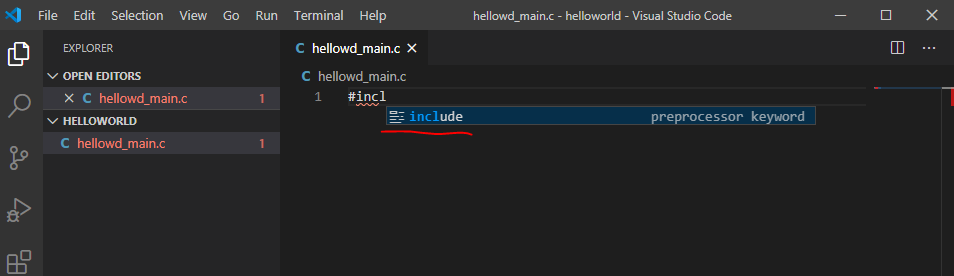
Теперь при вводе текста будут появляться подсказки с автодополнением. Для подстановки предложенного автодополнения можно нажать Tab. В VS Code достаточно много удобных хоткеев. Посмотреть все быстрые клавиши можно тут File > Preferences > Keyboard Shortcuts
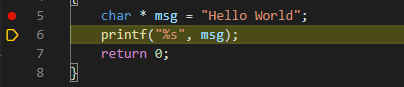
Запишем наш код HelloWorld в файл. В принципе, можно писать любой код – главное, чтобы был вывод в консоль для отладки.
#include <stdio.h>

int main(void)
{
    char * msg = "Hello World";
    printf("%s", msg);
    return 0;
}
Настройка компилятора
Время перейти к настройке компилятора и дебаггера.
Компилятор позволит из написанного кода собрать рабочее приложение.
Переходим Terminal > Configure Default Build Task…
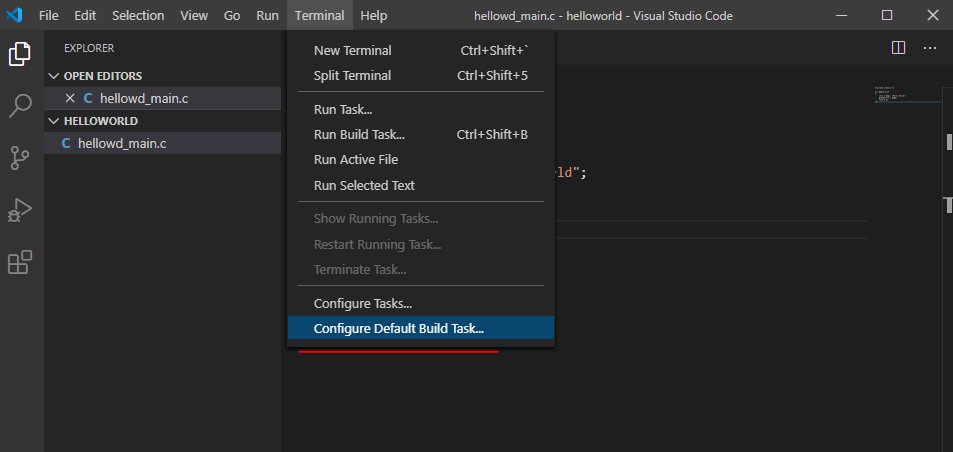
Мы изначально определили язык программирования (во время сохранения) и VS Code самостоятельно нашел компилятор – нам предложено задать сценарий работы с ним.
Если самостоятельно VS Code не нашла компилятор, то нужно редактировать файл c_cpp_properties.json, который идет вместе с расширением. Именно в данном файле настраивается путь к includePath
Подробнее по ссылке на официальном сайте. Ссылка актуальна на 2020 год.
https://code.visualstudio.com/docs/cpp/configure-intellisense-crosscompilation
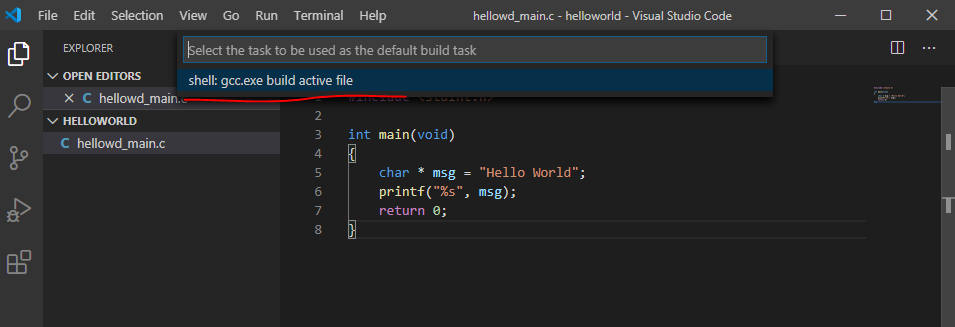
Кликаем по предложенной подсказке.
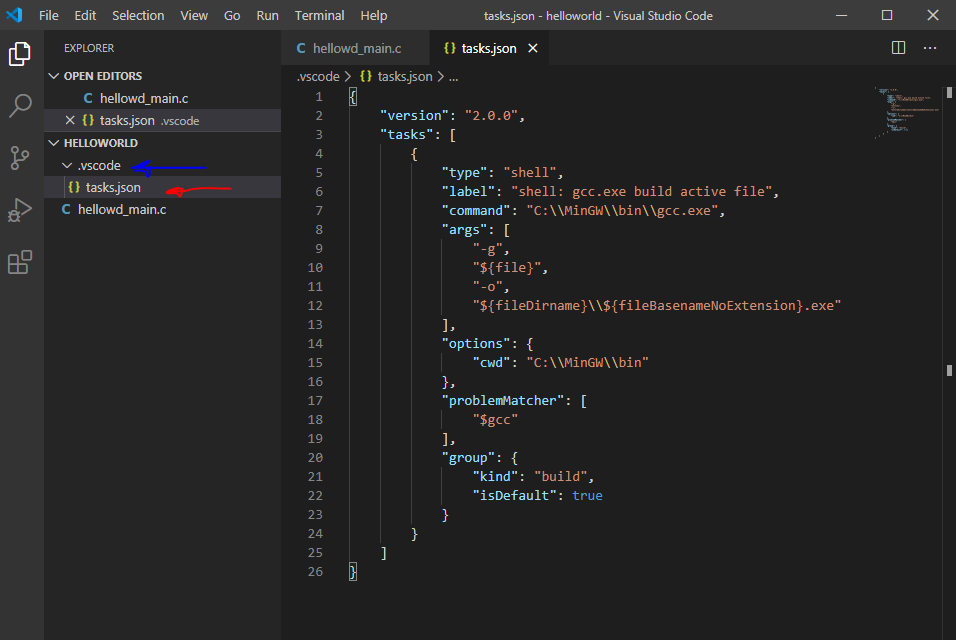
Текст файла примерно такой:
{
    "version": "2.0.0",
    "tasks": [
        {
            "type": "shell",
            "label": "shell: gcc.exe build active file",
            "command": "C:\\MinGW\\bin\\gcc.exe",
            "args": [
                "-g",
                "${file}",
                "-o",
                "${fileDirname}\\${fileBasenameNoExtension}.exe"
            ],
            "options": {
                "cwd": "C:\\MinGW\\bin"
            },
            "problemMatcher": [
                "$gcc"
            ],
            "group": {
                "kind": "build",
                "isDefault": true
            }
        }
     }
   ]
}
Выглядит страшно, как и любой развернутый JSON
Гайд на официальном сайте vscode говорит о том, что этого достаточно, а если что-то идет не так, то отсылают почитать про функционал task.json. К сожалению, если оставить в таком виде, то собирать многофайловые проекты будет невозможно.
Если в вашем проекте будет НЕ больше одного файла, можете пропустить дальнейший текст и перейти к настройке дебаггера. Если планируется работать с несколькими файлами – рекомендую проделать дальнейшие манипуляции.
JSON – это текстовое представление данных/объектов (в основном в JS).
Обычно используется для передачи данных в парах Клиент-Сервер.
Массивы обозначаются квадратными скобками []
Ячейки обозначаются фигурными скобками {}
Обычная запись представляет собой пару ключ-значение через двоеточие:
{ “Ключ” : “Значение” }
Значение может быть массивом, ячейкой, массивом ячеек и т.д. – ограничений нет.Коротко про JSON
Поле tasks содержит массив ( [массив] ), который состоит из ячеек отделенных фигурными скобками и запятыми ( [ {ячейка 1}, {ячейка 2}, {ячейка 3} ] ). В нашем случае этот массив содержит одну ячейку.
Создадим еще один элемент в массиве задач (task). Нужно скопировать все что есть в квадратных скобках (task[ вот это ]) и вставить через запятую в конце первой ячейки массива.
{
    "version": "2.0.0",
    "tasks": [
        {
            "type": "shell",
            "label": "shell: gcc.exe build active file",
            "command": "C:\\MinGW\\bin\\gcc.exe",
            "args": [
                "-g",
                "${file}",
                "-o",
                "${fileDirname}\\${fileBasenameNoExtension}.exe"
            ],
            "options": {
                "cwd": "C:\\MinGW\\bin"
            },
            "problemMatcher": [
                "$gcc"
            ],
            "group": {
                "kind": "build",
                "isDefault": true
            }
        },
        {
            "type": "shell",
            "label": "shell: gcc.exe build active file",
            "command": "C:\\MinGW\\bin\\gcc.exe",
           "args": [
                "-g",
                "${file}",
                "-o",
                "${fileDirname}\\${fileBasenameNoExtension}.exe"
            ],
            "options": {
                "cwd": "C:\\MinGW\\bin"
            },
            "problemMatcher": [
                "$gcc"
            ],
            "group": {
                "kind": "build",
                "isDefault": true
            }
        }
    ]
}
Файл должен выглядеть примерно как указано выше. Следите за скобками и запятыми – если где-то будет ошибка VS Code сообщит. Удаляем ячейку “group” на строках 20-23. Этот параметр отвечает за выбор компилятора, который будет запущен по-умолчанию.
Нас сейчас больше всего интересуют строки с 27 по 31.
Изменим значение ячейки “label” на 27 строке на любое название. Пусть будет build c project. Именно по этому имени мы сможем понять какой именно компилятор сейчас выбран.
Ячейка “command” – это команда, которая будет передана в терминал/консоль для старта компиляции. Как мы видим, все правильно, это путь к gcc.exe.
Ячейка “args” – это список аргументов, который будет передан после команды. Не пугайтесь, мы уже это делали. Чуть ранее мы узнавали версию gcc путем передачи аргумента -version.
- “-g” указывает компилятору на необходимость вставлять в готовое приложение отладочную информацию – номера строк, имена переменных и т.д. Необходимо для корректной работы дебаггера (отладчика) GDB;
- Следующим аргументом идёт файл или список файлов. “${file}” означает текущий файл. То есть компилятору будет передан только один файл. Мы хотим, чтобы сюда входили все файлы из определенной директории. Да, одним из решений будет вписывать сюда каждый созданный .c файл, но разве это удобно? Значит записываем сюда конструкцию: Из этой директории, взять все .c-файлы. Получится следующее: “${fileDirname}/**.c“
- Аргумент вывода файла
- Путь вывода скомпилированного приложения.
В итоге, добавленная нами часть будет выглядеть следующим образом:
         {
            "type": "shell",
            "label": "build c project",
            "command": "C:\\MinGW\\bin\\gcc.exe",
            "args": [
                "-g",
                "${fileDirname}/**.c",
                "-o",
                "${fileDirname}\\${fileBasenameNoExtension}.exe"
            ],
            "options": {
                "cwd": "C:\\MinGW\\bin"
            },
            "problemMatcher": [
                "$gcc"
            ],
            "group": {
                "kind": "build",
                "isDefault": true
            }
        }
    ]
}
Подробнее про task.json
https://code.visualstudio.com/docs/editor/tasks
Настройка отладчика
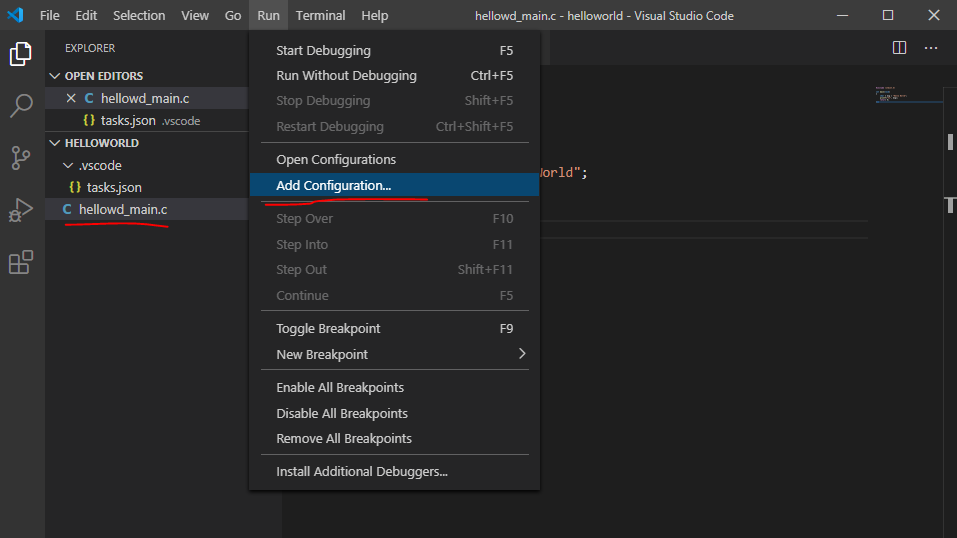
Теперь настроим дебаггер или отладчик. Переходим в наш файл с кодом, далее Run > Add Configuration…
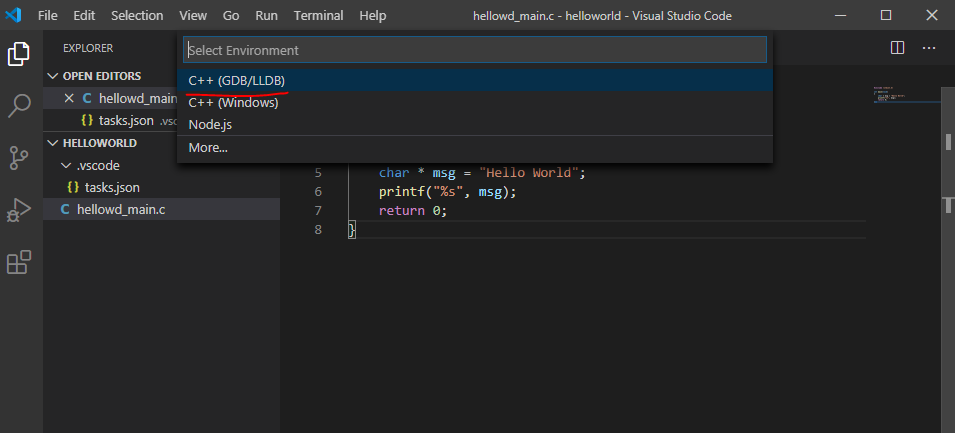
Выбираем окружение GDB
Выбираем Сборка и отладка активного файла
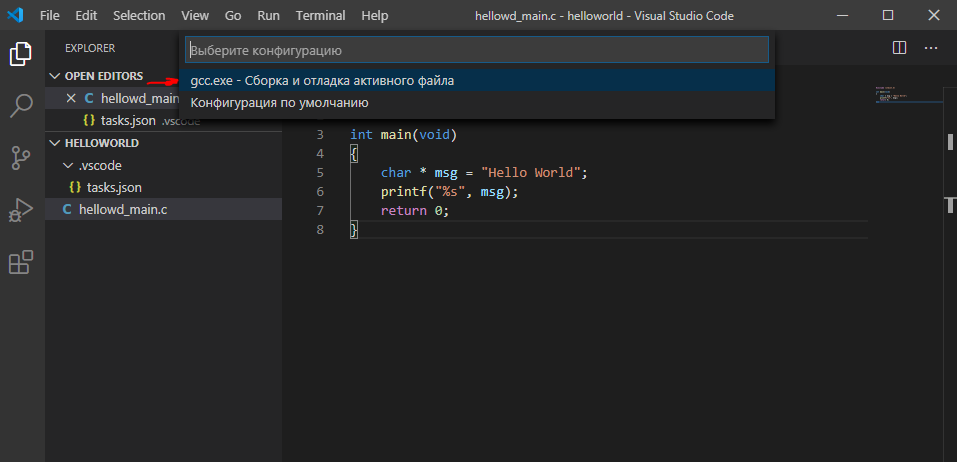
Если возникла ошибка и открылось окно, нажмите на нем Abort. Это лишь значит, что не удалось собрать приложение – может быть синтаксическая ошибка.
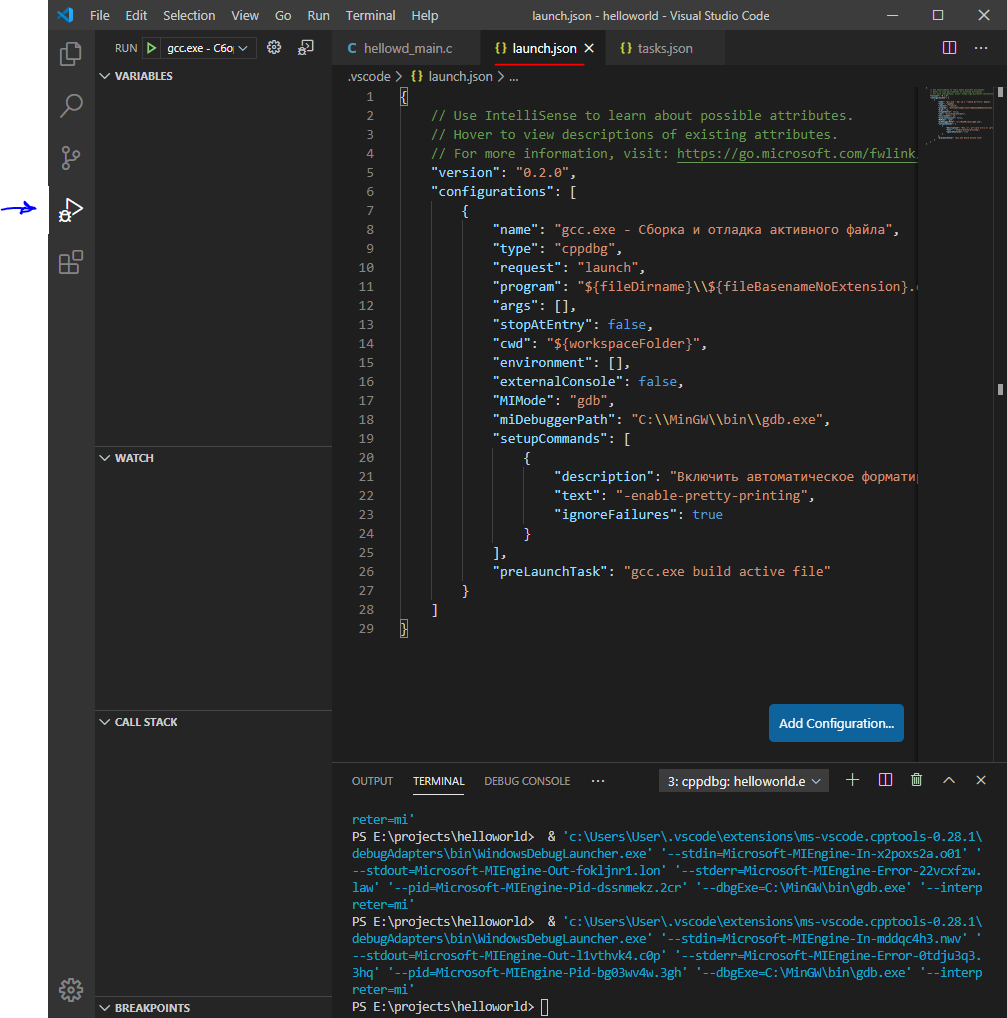
Далее откроется файл launch.json
Для тех, кто добавлял свой task: Изменим значение preLaunchTask на то название, которое придумали для своего компилятора. В моем случае – это “build c project“. Чтобы не было путаница стоить изменить и поле “name“. Можете как и прошлом примере добавить еще одну конфигурацию запуска в массив конфигураций, оставив первоначальную без изменений.
Запускаем приложение
Снова переходим в созданный файл с кодом и выбираем Terminal > Run Build Task…
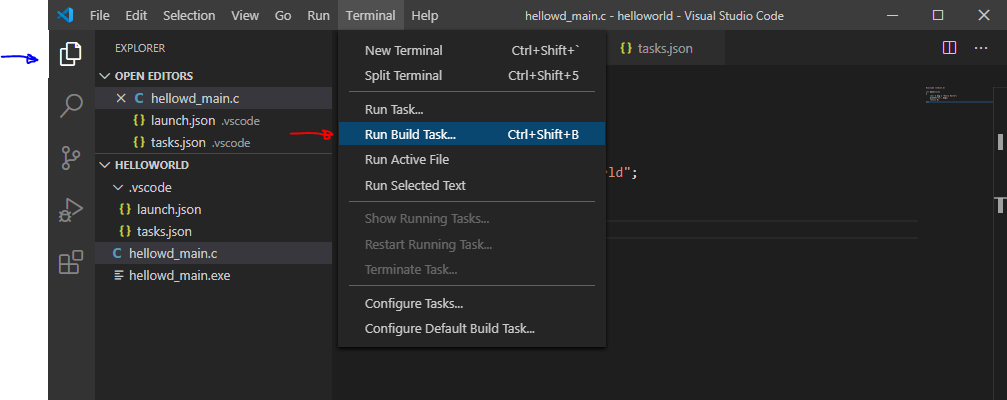
Эта команда проведет все шаги компиляции приложения и создаст в целевой папке исполняемый файл с расширением .exe
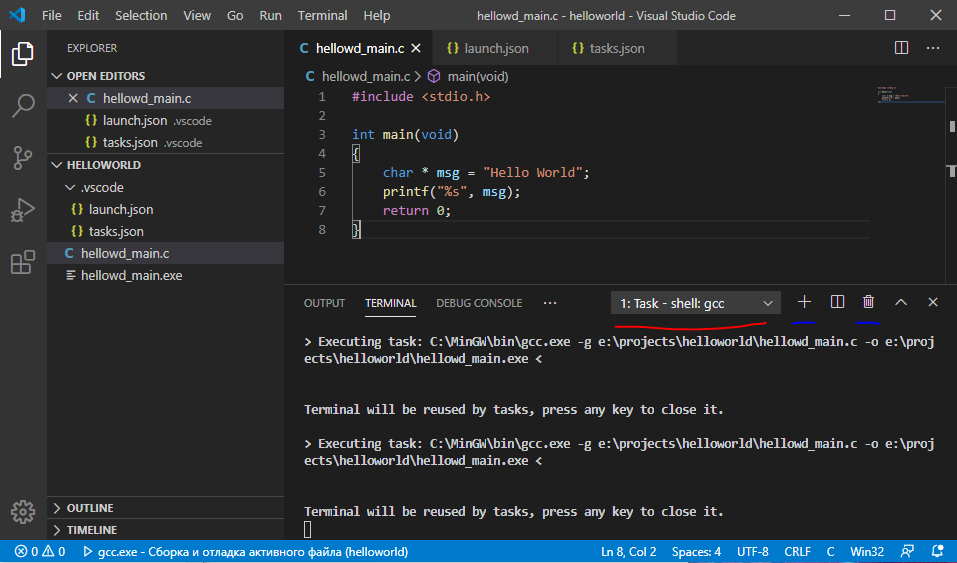
На картинке выше красным подчеркнут выпадающий список открытых терминалов (без паники – это как несколько cmd-консолей или терминалов в линуксе). Синим (правее красной линии, видно плохо) подчеркнуты элементы управления списком терминалов – их можно добавить, удалить или поставить парочку рядом.
Как мы видим, процесс компиляции завершился без ошибок и в списке файлов проекта появился .exe.
Создадим новый терминал.
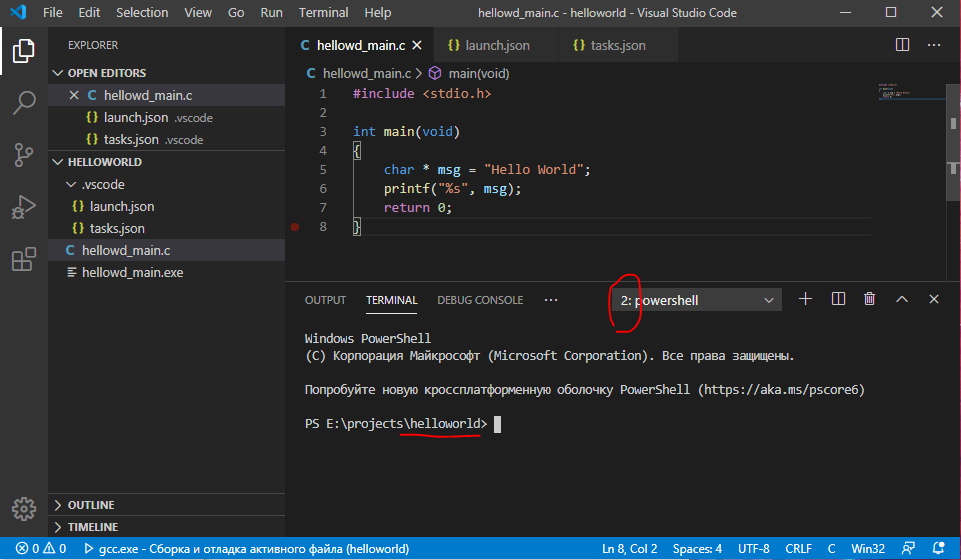
Как мы видим, изменился порядковый номер нового терминала. Также видно, что мы находимся в папке с проектом. Отсюда можно вызвать наше скомпилированное приложение. Можно начать набирать его имя и нажать Tab и сработает автодополнение. На каждое следующее нажатие терминал предложит различные подходящие варианты под то, что имелось ввиду. Если предложить нечего – ничего не произойдет.
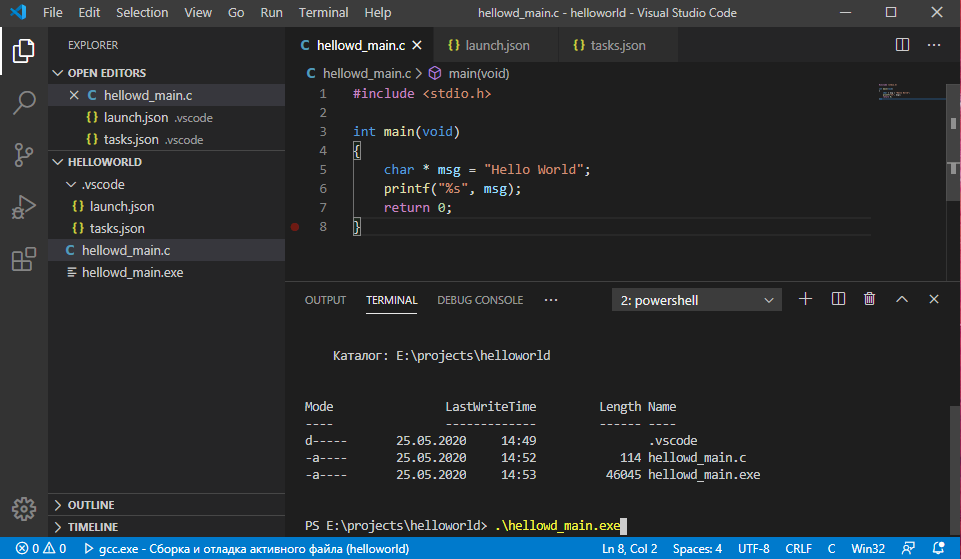
Вызовем наше приложение. В моем случае:
> .\hellowd_main.exe
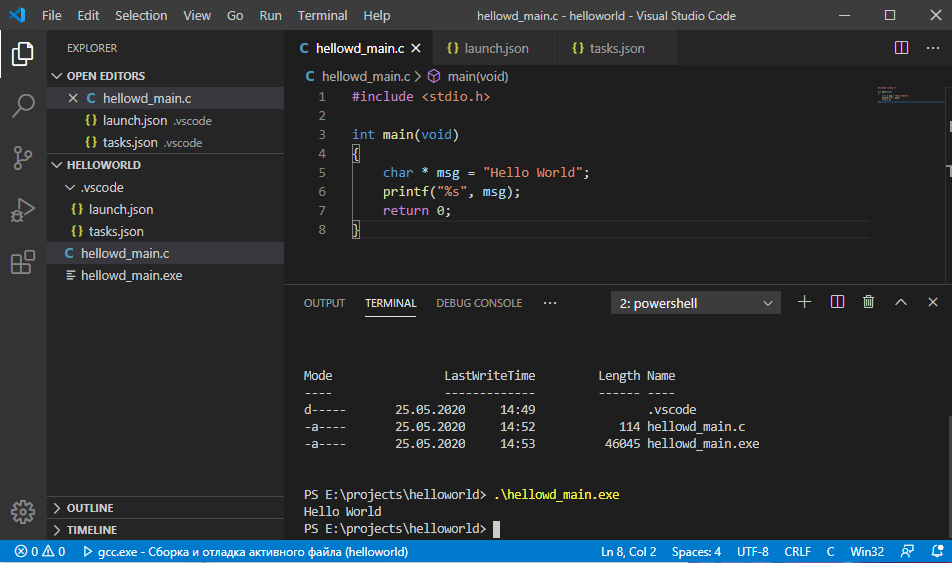
Замечательно, вывод сработал как надо.
Теперь инициируем отладку/дебаггинг этого приложения, чтобы посмотреть как это работает.
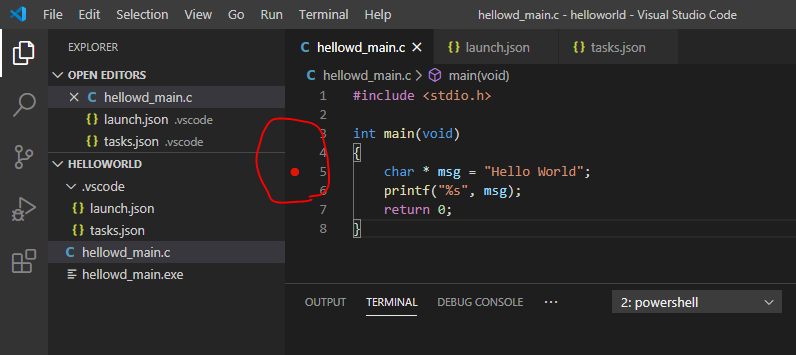
Установим “Breakpoint” или точку останова. Все как в классических IDE.
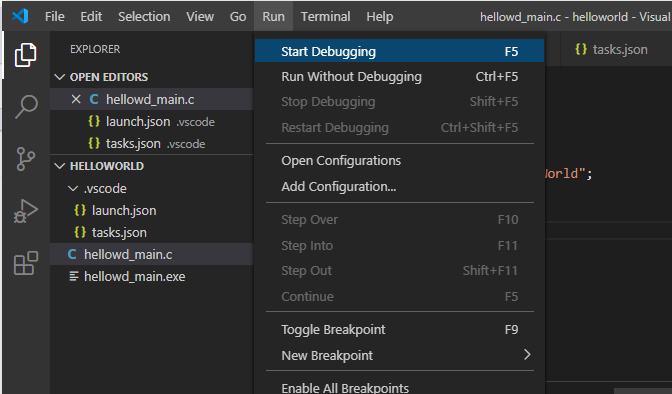
Запускаем отладку Run > Start Debugging или f5
Выполнение программы было приостановлено в том месте, которое мы пометили точкой останова.

Открылось другое окно редактора, которое специально подготовлено для работы в режиме отладки. В левой части окна появилось четыре секции:
- VARIABLES все переменные
- WATCH сюда, через знак плюса можно добавлять переменные, функции и т.д. по имени
- CALL STACK стек вызовов функции. В общих чертах – функции часто вызываются в теле других функций.
- BREAKPOINTS все точки останова
Текущая выполняемая строка подсвечивается и имеет желтый указатель строки
Управление ходом отладки программы тоже удобное и классическое.
- Продолжить
- Сделать шаг
- Пройти “внутрь” текущей строки
- Выйти на уровень выше
- Перезапуск отладки
- Остановка отладки
Удачного освоения инструмента