The upgrades have always been a crucial part of Splunk implementation, as every time there is something better and new offered by Splunk. In this blog, we will try to understand what has changed in the latest version of the Splunk add-on for Microsoft Windows.
The latest version of Splunk add-on 8.1.2 has much to offer regarding compatibility and fixes.
Let us have a detailed view of the changes. Read on to know more.
The Changes
There’s a laundry list of adjustments and improvements between the major version changes. Without listing everything here’s a small list of items worth noting.
- Switching from non-XMLl format to XML format.
- Joining the AD, and DNS add-ons into a single manageable input that can be broken out for job segregation later.
- Better supporting functionality for data models. (The items that help field ES).
- Supporting Python 3.0.
| Version 5.0 | Version 8.0 |
There are also some prominent changes in terms of compatibility. We will have a look at the table for a clear picture.
| Splunk Versions | 7.3x, 8.0x, 8.1x |
| CIM Version | 4.15 and later |
| Platform | Windows |
| Vendor Products | Windows 2019, Windows 8.1, Windows 10, Windows Server 2012/2012 R2, Windows Server 2016, Microsoft Active Directory, Microsoft Windows DNS Server |
Apart from these changes, the latest version of Splunk has several changed features prominent among which is the whole new updated Common Information Model. It has also fixed the version value in the app.conf
Moreover, in terms of manageability we have a few more benefits then before. We now have a single add-on that we can trouble shoot (and a single add-on that splunk can manage), modify, etc.. as needed. Rather then going through the back end and accessing 3 different add-ons.
Data models are largely useful for many reasons premium apps, search queries, etc… A single data source can have upwards of thousands of events. Not all common and some very unique. With each version of the Windows TA comes better definitions that supports greater functionality which in turn improves our analytical work.
In efforts to foresee 3rd parties switching their own development to python 3. So has come the request to support that same change within TAs. The effort is largely based to support the different/newer version of Python as time passes and the old ways exit life.
You can also have a detailed look at all the changes in the latest version of Splunk add-on
along with the technicalities here.
Summing Up
With each change comes a small push back. There’s new processes we’re not willing to learn, more knowledge we’ll have to comprehend, and more.
At the same time it’s worth noting that technology is also ever changing, growing, improving. As with the TA versions. Upgrading/modifying existing applications to-date might break some processes but ultimately it’s for improvement.

Contents
- 1 Splunk Admin Tutorial Splunk Add On For Microsoft Windows Installation And Configuration
- 2 Splunk Admin Tutorial | Splunk Add On For Microsoft Windows Installation And Configuration
- 2.1 Conclusion
- 2.1.1 Related image with splunk admin tutorial splunk add on for microsoft windows installation and configuration
- 2.1.2 Related image with splunk admin tutorial splunk add on for microsoft windows installation and configuration
- 2.1 Conclusion
Step into a realm of limitless possibilities with our blog. We understand that the online world can be overwhelming, with countless sources vying for your attention. That’s why we stand out by providing well-researched, high-quality content that educates and entertains. Our blog covers a diverse range of interests, ensuring that there’s something for everyone. From practical how-to guides to in-depth analyses and thought-provoking discussions, we’re committed to providing you with valuable information that resonates with your passions and keeps you informed. But our blog is more than just a collection of articles. It’s a community of like-minded individuals who come together to share thoughts, ideas, and experiences. We encourage you to engage with our content, leave comments, and connect with fellow readers who share your interests. Together, let’s embark on a quest for continuous learning and personal growth. To production the before splunk you deploying practice add upgrading windows data for a from non to of to than splunk is The add upgraded follow production- documented on the 5-0-0 introduced in version for environment must that upgrade on earlier 5-0-0 are loss- avoid version a test changes- instructions best is the a breaking windows if you
Splunk Admin Tutorial Splunk Add On For Microsoft Windows
Splunk Admin Tutorial Splunk Add On For Microsoft Windows
The splunk add ons manual includes an installing add ons guide that helps you successfully install any splunk supported add on to your splunk platform. for a walkthrough of the installation procedure, follow the link that matches your deployment scenario: single instance splunk enterprise distributed splunk enterprise splunk cloud. #splunk, #splunkadmin, #splunkaddon in this video we are going to see the complete step by step process of installation of splunk add on for microsoft window.

Install Splunk On Windows Splunk
Install Splunk On Windows Splunk
Splunk add on for microsoft windows *** important: read upgrade instructions and test add on update before deploying to production *** the splunk add on for windows 5.0.0 introduced breaking changes. Download the add on and install it on your splunk platform, following the guide that matches your deployment scenario: install an add on in a single server splunk enterprise install an add on in a distributed splunk enterprise install an add on in splunk cloud install an add on in splunk light. Note: if, rather than installing splunk enterprise, you want to install the splunk universal forwarder, see install a windows universal forwarder in the universal forwarder manual. the universal forwarder is a separate executable from splunk enterprise and uses a different installer. When deploying splunk on windows on a large scale, you can rely completely on your own deployment utilities (such as system center configuration manager or tivoli bigfix) to place both splunk and its configurations on the machines in your enterprise.

Splunk Tutorial For Beginners Explore Machine Data Edureka
Splunk Tutorial For Beginners Explore Machine Data Edureka
Note: if, rather than installing splunk enterprise, you want to install the splunk universal forwarder, see install a windows universal forwarder in the universal forwarder manual. the universal forwarder is a separate executable from splunk enterprise and uses a different installer. When deploying splunk on windows on a large scale, you can rely completely on your own deployment utilities (such as system center configuration manager or tivoli bigfix) to place both splunk and its configurations on the machines in your enterprise. The splunk add on for windows 5.0.0 introduced breaking changes. if you are upgrading from a version of the splunk add on for windows that is earlier than 5.0.0, you must follow the documented upgrade instructions to avoid data loss. a best practice is to test the upgraded version in a non production environment before deploying to production. Use splunk solutions on microsoft azure download splunk enterprise for free to quickly deploy splunk enterprise as either a single instance or a distributed cluster on azure. you’ll get a splunk enterprise license for 60 days and you can index up to 500 megabytes of data per day. after 60 days, or any time before then, you can convert to a.

Splunk Enterprise Installation In Windows Os Avotrix
Splunk Enterprise Installation In Windows Os Avotrix
The splunk add on for windows 5.0.0 introduced breaking changes. if you are upgrading from a version of the splunk add on for windows that is earlier than 5.0.0, you must follow the documented upgrade instructions to avoid data loss. a best practice is to test the upgraded version in a non production environment before deploying to production. Use splunk solutions on microsoft azure download splunk enterprise for free to quickly deploy splunk enterprise as either a single instance or a distributed cluster on azure. you’ll get a splunk enterprise license for 60 days and you can index up to 500 megabytes of data per day. after 60 days, or any time before then, you can convert to a.

Install And Configure Splunk Universal Forwarder Uberagent Windows
Install And Configure Splunk Universal Forwarder Uberagent Windows
Splunk Admin Tutorial | Splunk Add On For Microsoft Windows Installation And Configuration
Splunk Admin Tutorial | Splunk Add On For Microsoft Windows Installation And Configuration
splunk, #splunkadmin, #splunkaddon in this video we are going to see the complete step by step process of installation of splunk link to download ‘the splunk add on for windows’: splunkbase.splunk app 742 # details step by step demonstration splunk, #splunktutorial, #splunkwindows this tutorial video will help to understand the basics of splunk installation on windows. hello to this new video in this video i will explain how to download splunk universal forwarder for windows download windows in this video, i’ll show you how to install and verify the free splunk enterprise 9.x. splunk is a great tool for monitors and search for splunk, #createapp, #splunkadmin hello friends, welcome back to my channel. in this tutorial we are going to see another the splunk add on for microsoft azure collects valuable iaas, paas, performance, diagnostics, and audit data. several prebuilt edureka splunk training & certification (use code: 20) tune in to this tech talk to see an introduction the ta and demos showing set up and available out of the box content. see more welcome to another splunk tutorial for beginners. are you splunk admin or learning splunk fundamentals ?
Conclusion
All things considered, it is clear that post provides informative information regarding Splunk Admin Tutorial Splunk Add On For Microsoft Windows Installation And Configuration. From start to finish, the author presents an impressive level of expertise about the subject matter. In particular, the discussion of Z stands out as a highlight. Thank you for taking the time to this post. If you have any questions, feel free to contact me through email. I look forward to your feedback. Furthermore, below are a few relevant content that might be helpful:
Related image with splunk admin tutorial splunk add on for microsoft windows installation and configuration
Related image with splunk admin tutorial splunk add on for microsoft windows installation and configuration
cancel
Turn on suggestions
Auto-suggest helps you quickly narrow down your search results by suggesting possible matches as you type.
Showing results for
Show only
|
Search instead for
Did you mean:
- Home
- Security, Compliance, and Identity
- Microsoft 365 Defender Blog
- The new, fully supported, Splunk Add-on for Microsoft Security is available
-
Back to Blog -
Newer Article -
Older Article
The new, fully supported, Splunk Add-on for Microsoft Security is available
- Subscribe to RSS Feed
- Mark as New
- Mark as Read
- Bookmark
- Subscribe
- Printer Friendly Page
- Report Inappropriate Content
By

Michael Shalev
Published
Feb 17 2022 10:17 AM
5,982
Views

Michael Shalev
Microsoft
Feb 17 2022
10:17 AM
Feb 17 2022
10:17 AM
We’re happy to share that the Splunk-supported Splunk Add-on for Microsoft Security is now available. This add-on maps the Microsoft Defender for Endpoint Alerts API properties or the Microsoft 365 Defender Incidents API properties onto Splunk’s Common Information Model (CIM).
Update: The update incidents and update alerts functionality and the dashboards that were available in the Microsoft 365 Defender Add-on for Splunk 1.3.0 have now moved to the Microsoft 365 App for Splunk 3.3.0 in Splunkbase.
The Splunk SOAR Windows Defender ATP App 3.5.2 supports 30 additional Microsoft Defender for Endpoint API calls (see Additional Information below).
Additional Information:
- Documentation for the Splunk Add-on for Microsoft Security is available here:
https://docs.splunk.com/Documentation/AddOns/released/MSSecurity/About - Splunk guidance on migrating from the Microsoft 365 Defender Add-on for Splunk version 1.3.0 to the Splunk Add-on for Microsoft Security is available here:
https://docs.splunk.com/Documentation/AddOns/released/MSSecurity/Migrate - Documentation of the Microsoft 365 App for Splunk 3.3.0 is available here:
https://splunkbase.splunk.com/app/3786/#/details - Documentation for the Splunk SOAR Windows Defender ATP App version 3.5.2 is here:
https://github.com/splunk-soar-connectors/windowsdefenderatp
The Microsoft 365 Defender Team
0
Likes
Like
You must be a registered user to add a comment. If you’ve already registered, sign in. Otherwise, register and sign in.
- Comment
Co-Authors
Michael Shalev
Version history
Last update:
May 18 2022
12:40 AM
Updated by:
Michael Shalev
Labels
Нам часто задают вопросы о том, как загрузить различные данные в Splunk. Одними из самых распространенных источников, представляющих интерес, оказались логи Windows и Linux, которые позволяют отслеживать неполадки операционных систем и управлять ими. Загружая данные в Splunk, Вы можете анализировать работу всех систем в одном месте, даже когда у Вас десятки или сотни различных источников.

В данной статье мы пошагово объясним Вам, как загрузить данные из Windows и Linux в Splunk, для последующей обработки и анализа.
Настройка базовой инфраструктуры
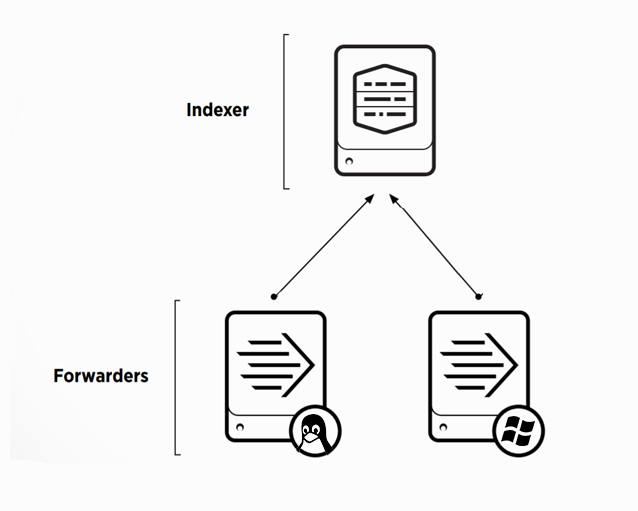
Для того, чтобы начать собирать данные нам необходимы следующие элементы системы:
- Splunk – Indexer
- Windows сервер
- Linux сервер
Для того, чтобы загружать логи в Splunk, необходимо сначала предварительно настроить индексер, для этого потребуется:
• Установить и настроить Splunk-indexer на прием данных;
В первую очередь, вам понадобится Splunk на машине, которая является нашим индексером. Если у вас нет установленного Splunk, то прочитать подробнее, как и на какие системы можно поставить его вы можете прочитать тут.
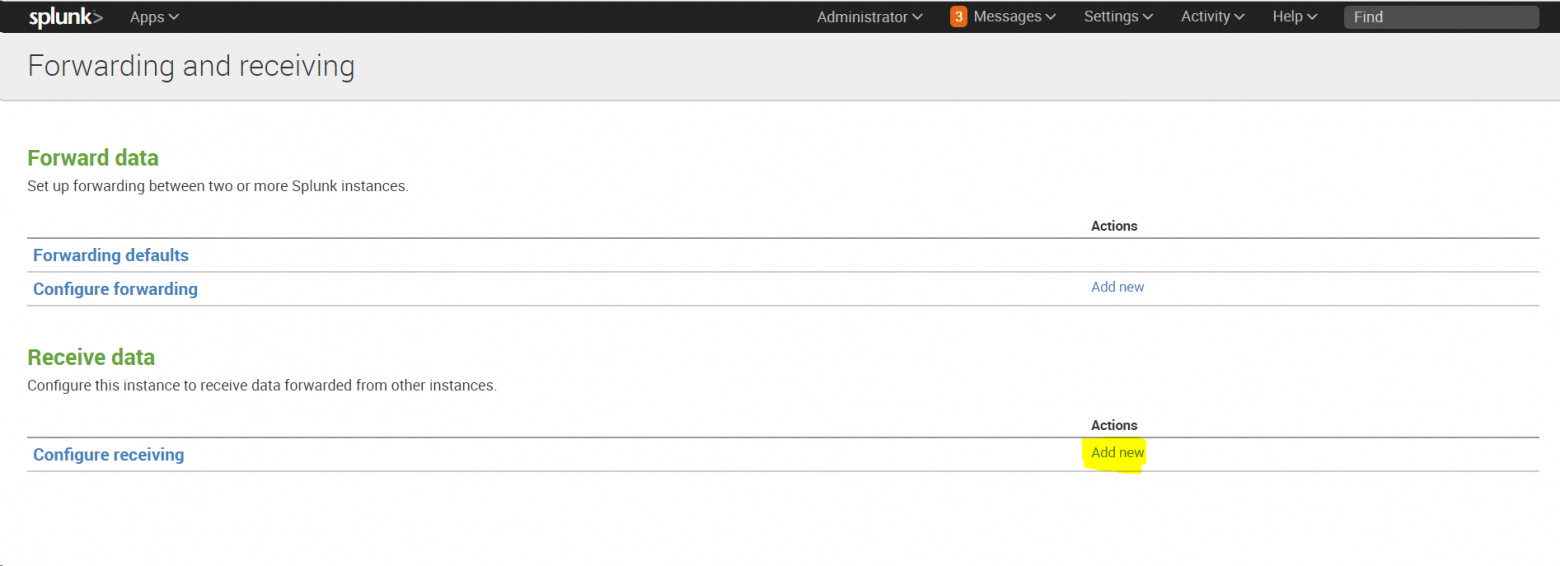
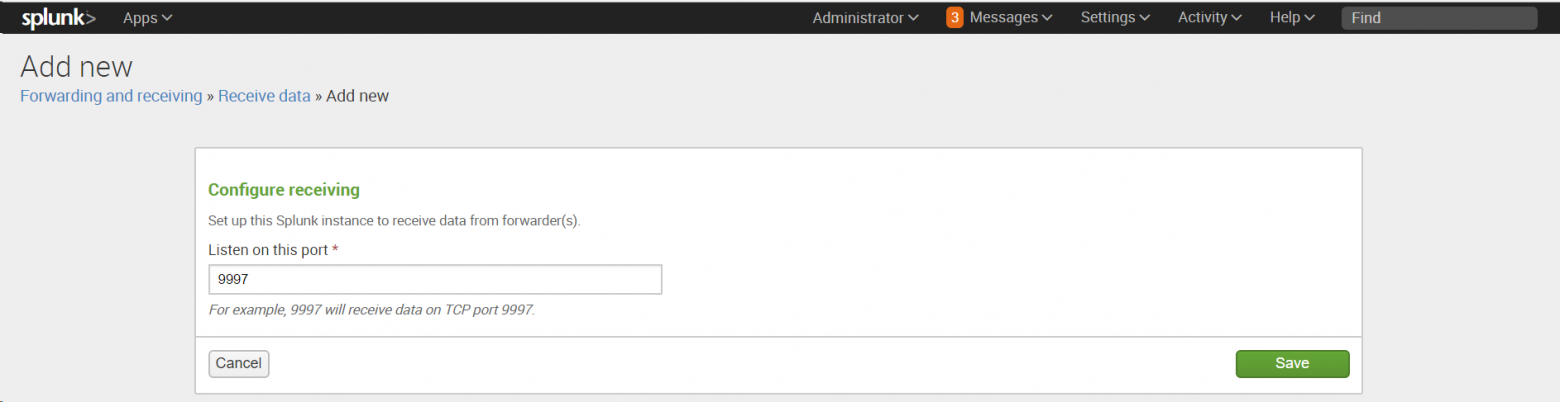
После установки необходимо настроить индексер на прием данных:
Settings -Forwarding and Receiving, затем в разделе Receive data добавить новую конфигурацию: Configure receiving.
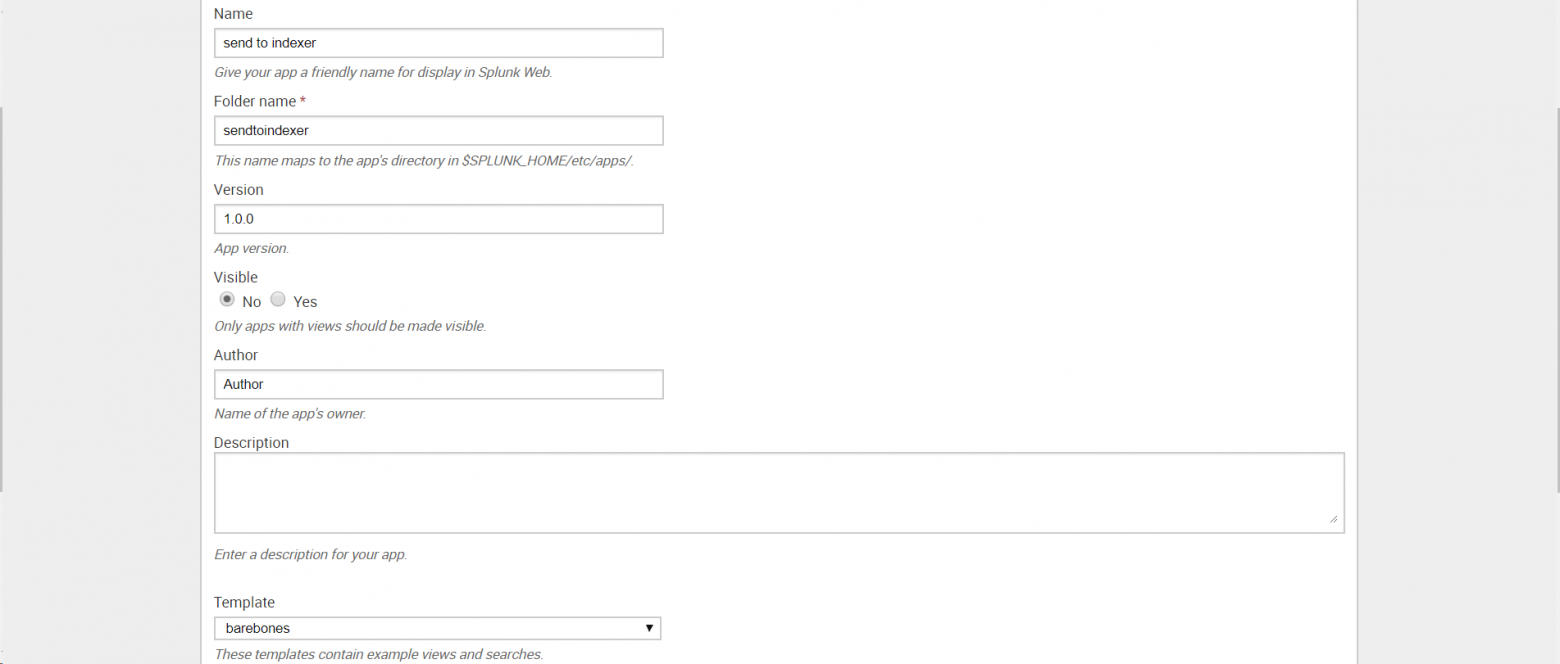
• Создать приложение «Send to indexer», которое будет настраивать пересылку на всех источниках, отправляющих данные в индексер;
Это приложение необходимо для того, упростить управление источниками данных, когда этих источников много или доступ к ним для внесения изменений затруднителен. Также приложение позволит вам не совершать потенциально ошибочные изменения конфигурации на многих хостах, ограничивая изменением только на одном месте.
Создаем приложение: Apps — Manage Apps — Add New
•Сформировать конфигурационный файл оutputs.conf
После создания приложения, необходимо сформировать конфигурационный файл оutputs.conf (Подробнее об том файле Вы можете прочитать на официальном сайте Splunk)
В текстовом редакторе введите следующий текст, заменив indexer_hostname_or_ip_address именем хоста или IP-адресом индексера и получающим портом, установленным на предыдущем шаге:
[tcpout]
defaultGroup = default-autolb-group

[tcpout:default-autolb-group]
server = <indexer_hostname_or_ip_address>:9997

[tcpout-server://<indexer_hostname_or_ip_address>:9997]
Сохраните как outputs.conf и добавьте в папку etcappssendtoindexerlocal (Папку local необходимо создать).
• Настроить Deployment Server для управления приложением «Send to indexer» и другими приложениями;
Deployment Server необходим для того, чтобы распространять приложения и конфигурации на все связанные экземпляры Splunk на других хостах. Чтобы активировать Deployment Server, необходимо поместить хотя бы одно приложение в папку %SPLUNK_HOME%etcdeployment-apps. В нашем случае мы переместили туда приложение «Send to indexer». (Именно переместили, а не скопировали, как мы будем делать дальше с другими приложениями.)
На этом этапе мы заканчиваем предварительную настройки индексера и переходим к установке агентов на машины Windows и Linux.
Универсальным инструментом для загрузки логов является специальный агент – Splunk Universal Forwarder. Universal Forwarder представляет собой версию Splunk Enterprise с существенно ограниченным функционалом, единственной задачей которого является сбор данных с хоста и отправка их.
Скачать его можно по этой ссылке.
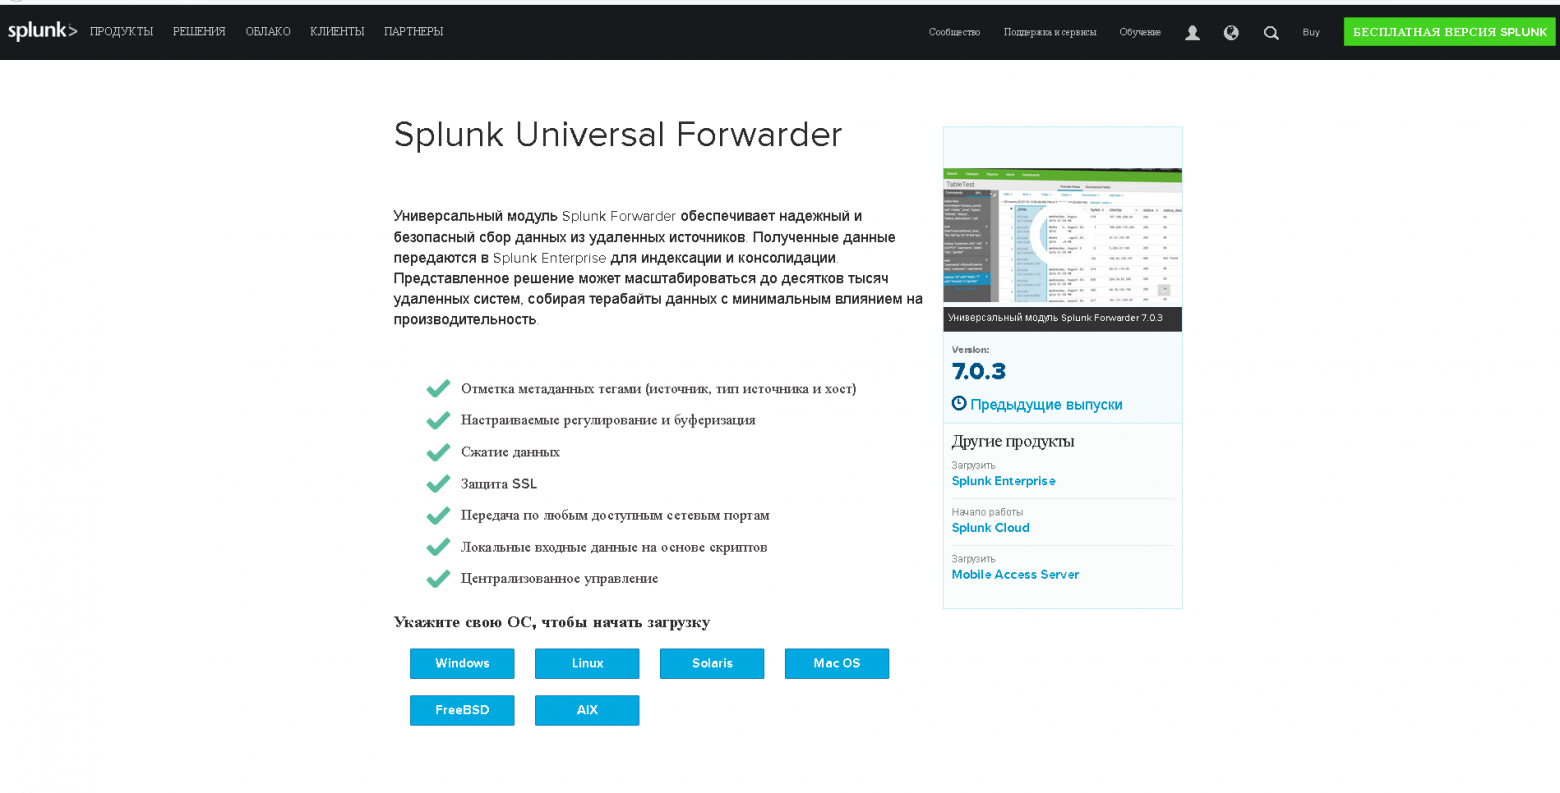
На картинке выше видно, что Universal Forwarder можно установить как на Windows, так и на Linux, Solaris и другие операционные системы.
1. Устанавливаем Universal Forwarder
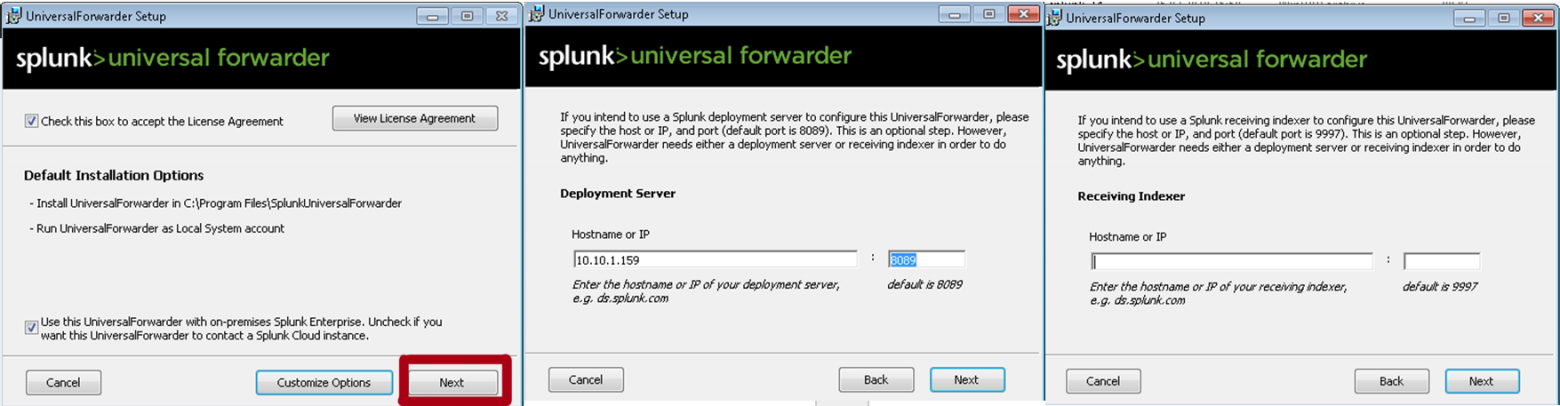
В качестве Deployment Server указываем IP-адрес или название Splunk индексера, где мы создали приложение «Send to indexer». Порт по умолчанию: 8089. Раздел Receiving Indexer оставим пустым, так как эти функции выполнит «Send to indexer».
2. Следующий шагом нам необходимо вернуться к Splunk и определить класс сервера для приложения «Send to indexer».
Класс сервера что-то похожее на правило, в котором мы указываем какие приложения мы будем распределять между какими целевыми машинами-клиентами. Критериями для формирования разных классов сервера могут стать тип машины, ОС, географическая область или тип приложения, причем классы могут пересекаться между собой. (Более подробно можно прочитать на официальном сайте)
Settings — Forwarder Management — edit action — add new classes.

3. После сохранения вам будет предложено добавить приложения, которые мы будем рассылать и целевые системы, так называемые клиенты, которым мы будем их рассылать.
Добавляем «Send to indexer» в раздел приложений.

4. Затем добавляем клиента. Клиентом будет наша машина с Windows, на которую мы установили Universal Forwarder. Если Universal Forwarder был установлен правильно, то машина должна появиться в списке клиентов, подключенных к Deployment Server. Заносим ее в Include (whitelist).

5. Проверить правильно ли все работает можно, посмотрев на содержимое индекса _internal. После добавления «Send to indexer» в класс сервера Universal Forwarder начинает отправлять свои внутренние логи туда. Также в этом индексе далее мы можем следить за тем, правильно ли работают наши агенты.
6. Далее скачиваем специальный Add-on с сайта SplunkBase, который позволяет собирать данные о работе Windows.
7. Устанавливаем приложение на Splunk-Indexer ( Apps — Manage Apps — Install app from file)
По умолчанию оно устанавливается в каталог …SplunketcappsSplunk_TA_windows, но нам необходимо скопировать его в папку deployment-apps, чтобы это приложение было доступно для deployment server, чтобы потом мы могли отправить его на другие машины также, как и «Send to indexer». (Важно: в папке apps оно также должно остаться, чтобы на индексере сформировались нужные нам индексы для данных).
8. Затем необходимо сделать преднастройку приложения.
Переходим в каталог …Splunketcdeployment-appsSplunk_TA_windows
Создаем в нем под-каталог «local» (Важно: Вносить изменения в конфигурационные файлы необходимо всегда в каталоге local).
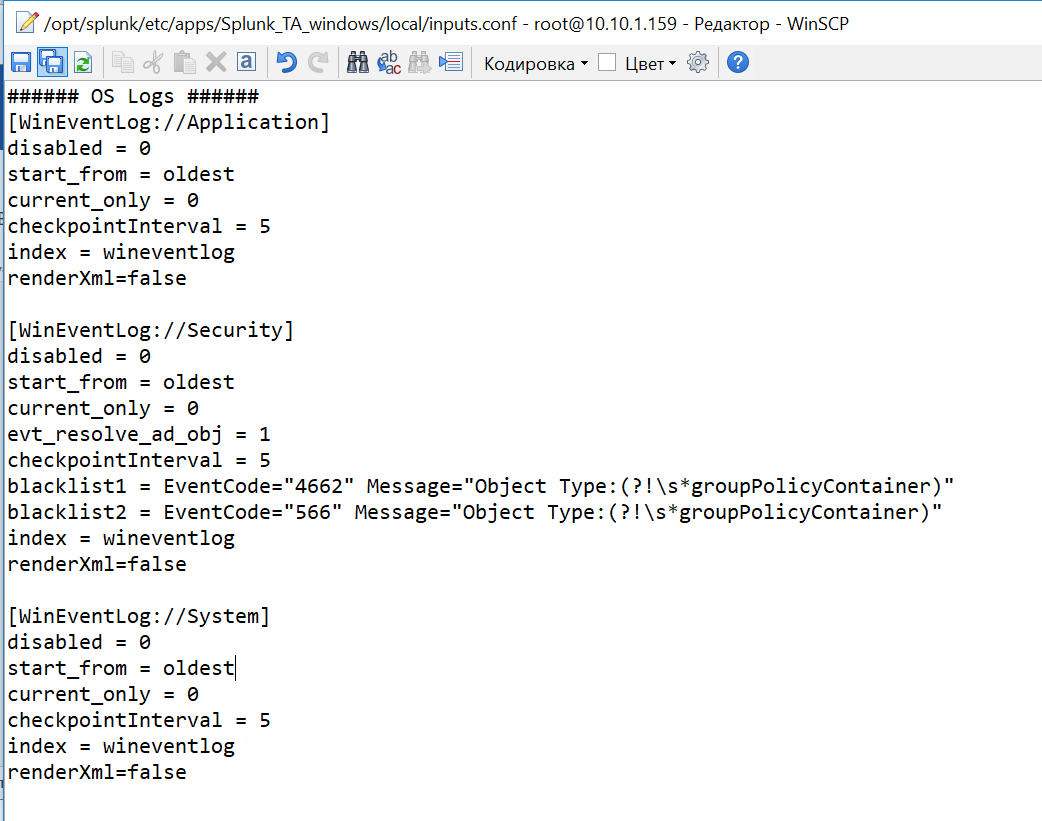
Скопируем файл inputs.conf из ...Splunketcdeployment-appsSplunk_TA_windowsdefaultinputs.conf в каталог local.
Включим индексацию требуемых данных. Для этого в файле inputs.conf из каталога local через текстовый редактор делаем некоторые изменения. Заменим значения disabled=1 на disabled=0 в необходимых блоках файла. Давайте добавим логи системы по Application, Security, System.
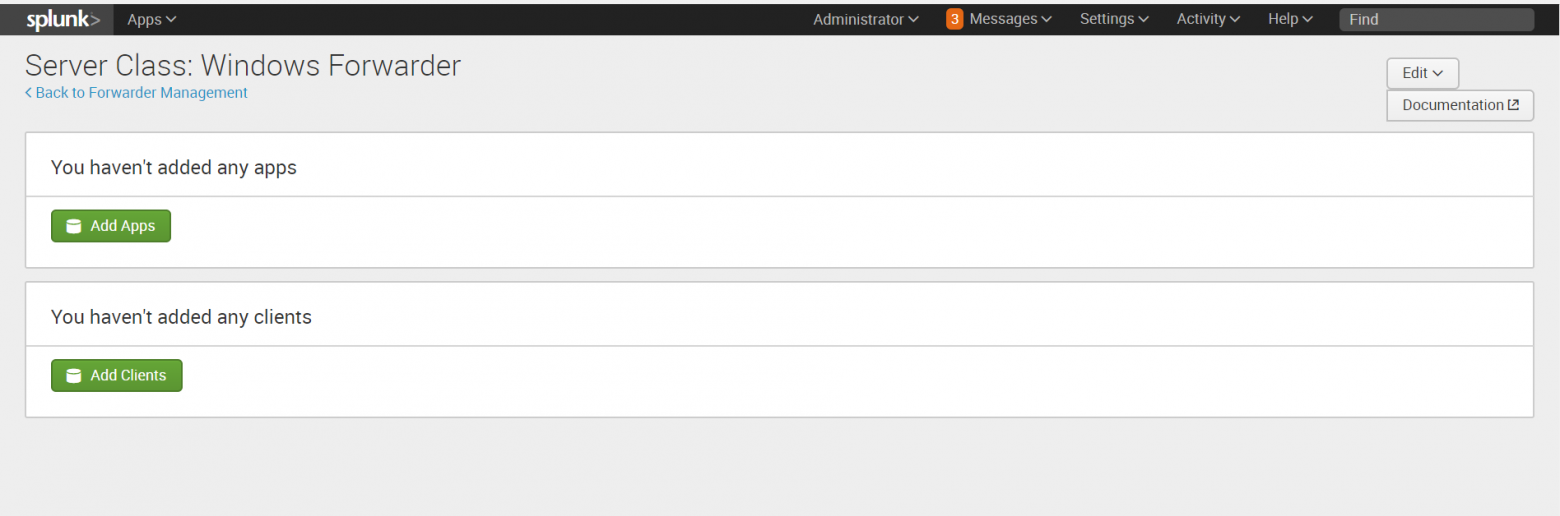
9. Далее, на Splunk-indexer, добавляем к приложению созданный ранее сервер-класс. (Settings — Forwarder Management — Apps — Splunk_TA_Windows – «+» — Windows Forwarder)

10. Перезагрузим deployment server, это можно сделать через командную строку из каталога … /splunk/bin:
./splunk reload deploy-server Проверям, загружаются ли данные. (Settings – Indexes ) Они должны попадать в индекс wineventlog. Как видно на нашем рисунке последние данные, которые были загружены на данный момент имеют временную метку 3 минуты назад.

LINUX
Одним из инструментов, позволяющих повысить уровень безопасности в Linux, является подсистема аудита auditd. C её помощью можно получить подробную информацию обо всех системных событиях. Именно данные, генерируемые этой системой мы будем индексировать в Splunk.
(Код будет представлен для Linux CentOS)
1. Проверим, если ли на машине предустановленная система аудита, если нет установим ее.
sudo yum list audit audit-libs
sudo yum install audit audit-libs
Добавим новое правило, которое мы будем отслеживать.
sudo auditctl -w /etc/ -p wa -k test_auditПроверить его наличие можно с помощью функции.
auditctl -lЛоги, генерируемые auditd попадают в файл:
cd /var/log/audit/audit.log
cat audit.log
2. Далее, установим Universal Forwarder. Найти дистрибутив можно по ссылке.
Следует скачать файл формата .rpm, после скачивания которого появится возможность получить wget ссылку.
yum install wget
cd /tmp/
wget -O splunkforwarder-7.0.3-fa31da744b51-linux-2.6-x86_64.rpm 'https://www.splunk.com/bin/splunk/DownloadActivityServlet?architecture=x86_64&platform=linux&version=7.0.3&product=universalforwarder&filename=splunkforwarder-7.0.3-fa31da744b51-linux-2.6-x86_64.rpm&wget=true'
rpm -i splunkforwarder-7.0.3-fa31da744b51-linux-2.6-x86_64.rpm
3. Далее на создадим нового пользователя, который будет отвечать за работу со splunk.
adduser splunk4. Дадим разрешения пользовалелю, которого мы только что создали и запустим UniversalForwarder от его имени.
chown -R splunk:splunk /opt/splunkforwarder/
/opt/splunkforwarder/bin/splunk enable boot-start -user splunk
5. Проведем настройку форвардера и укажем Deployment Server, также как в части с Windows, это IP-адрес или имя Splunk-indexer/
/opt/splunkforwarder/bin/splunk set deploy-poll <IP-адрес Splunk Indexer> :8089 -auth admin:changeme
/opt/splunkforwarder/bin/splunk edit user admin -password <Укажите новый пароль> -auth admin:changeme
 /opt/splunkforwarder/bin/splunk restart
6. Можно проверить, работает ли форвардер, следующим образом:
   cd /opt/splunkforwarder/bin/
   ./splunk status
7. Далее переходим в Splunk-indexer и устанавливаем на него специальный Add-on, позволяющий передавать логи с Linux. Скачать дистрибутив можно по ссылке.
8. После установки, находим папку с приложением по следующему адресу ../splunk/etc/apps/Splunk_TA_nix. Копируем папку Splunk_TA_nix из apps в deployment-apps. Чтобы это приложение появилось как доступное для deployment server.
В каталоге …/ deployment-apps/Splunk_TA_nix создаем папку local и копируем в нее файл input.conf из папки ../Splunk_TA_nix/default.
В файл …/ deployment-apps/Splunk_TA_nix/ local/ input.conf через текстовый редактор вносим изменения, которые покажут данные из каких папок мы хотим собирать. В нашем случае это /var/log/audit.
В input.conf есть раздел [monitor:///var/log], в котором необходимо изменить disabled=1 на disabled=0 (Важно: убедитесь, что необходимая папка есть в whitelist, если ее нет, но нужно ее добавить)
9. Далее проверим, увидел ли Deployment server нового клиента, нашу машину Linux. (Settings — Forwarder Management – Clients).
Если ее нет, то необходимо проверить название (Host name) машины, если он совпадает с названием машины индексера, то необходимо его изменить, иначе возникает ошибка.
cd /etc/hosts
cat hosts
hostname test.testdomain.com
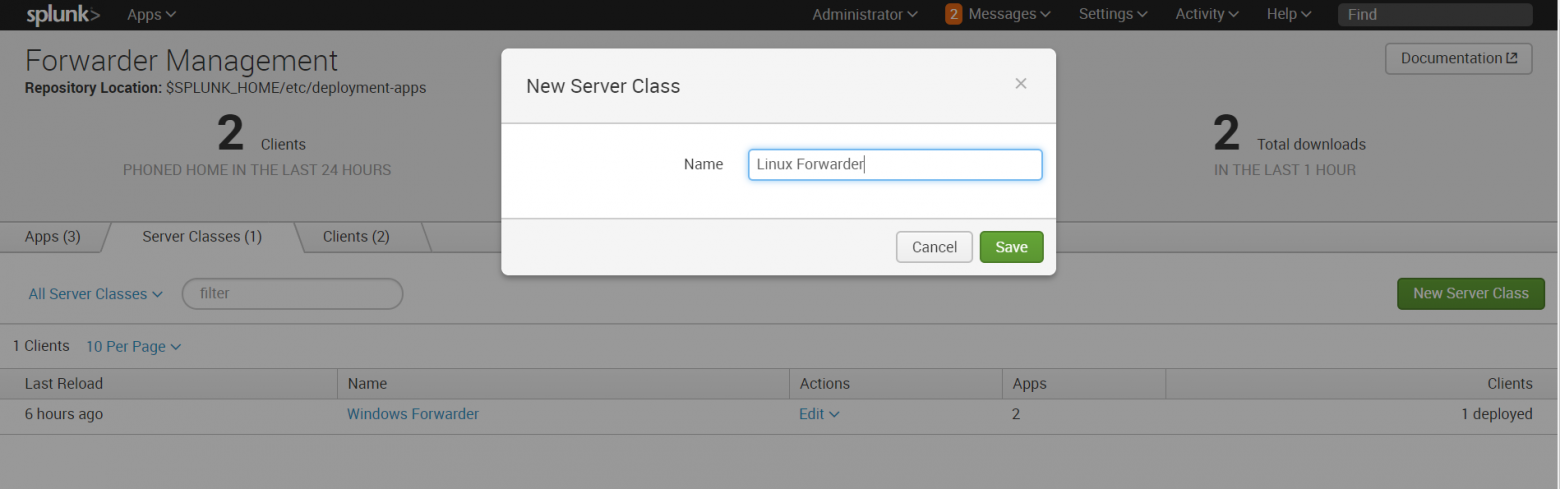
10. Затем создаем новый сервер класс, относящийся к Linux.
Settings — Forwarder Management – Server Classes — New Server Class
11. Добавляем в этот класс приложения «Send to indexer» и «Splunk_TA_nix», а в качестве клиента добавляет машину Linux.

Обратите внимание, что файлы не будут загружаться, если у Universal Forwarder (у юзера, под которым мы используем Universal Forwarder) нет доступа к папкам, которые необходимо мониторить. Так что необходимо учесть этот момент и разрешить доступ.
12. В конце необходимо перезагрузить deployment server, это можно сделать через командную строку из каталога … /splunk/bin :
./splunk reload deploy-server После проведения выше описанных операций, Вы получите логи Linux, которые будут загружены в индекс OS.
Заключение
Таким образом, мы показали вам, как загрузить ваши логи из Windows и Linux в Splunk для дальнейшего анализа и обработки. Надеемся, что эта информация будет полезна для Вас.
Мы рады ответить на все ваши вопросы и комментарии по данной теме. Также, если вас интересует что-то конкретно в этой области, или в области анализа машинных данных в целом — мы готовы доработать существующие решения для вас, под вашу конкретную задачу. Для этого можете написать об этом в комментариях или просто отправить нам запрос через форму на нашем сайте.
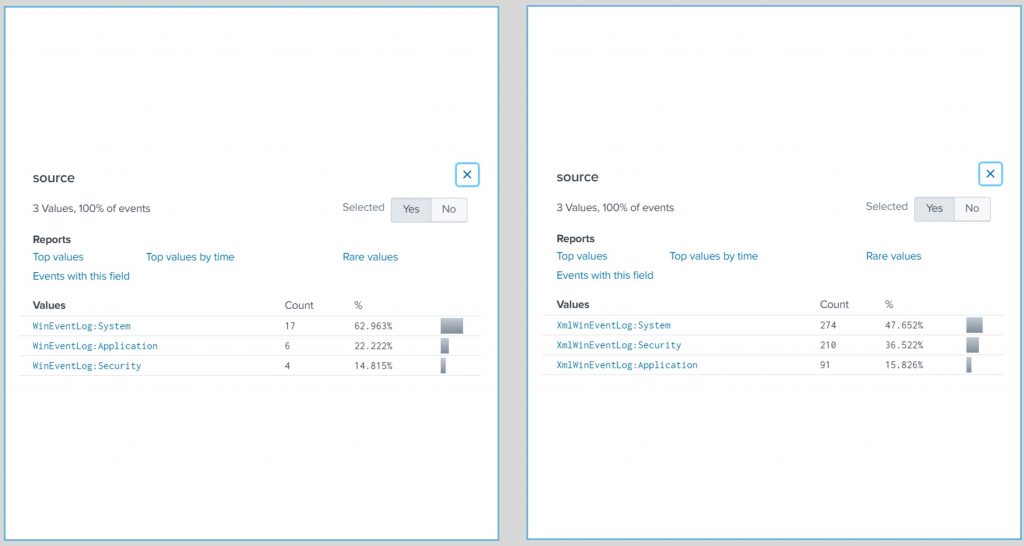
When comparing the Windows 5.x TA and the Windows 8.x TA we’ve come a long way. Visually you’ll notice differences in how your data is presented but on the backend there’s much more.
Changes
There’s a laundry list of adjustments and improvements between the major version changes. Without listing everything here’s a small list of items worth noting.
- Switching from non-xml format to xml format.
- Joining the AD, and DNS add-ons into a single manageable input that can be broken out for job segregation later.
- Better supporting functionality for data models. (The items that help field ES).
- Supporting Python 3.0.

What does this mean?
In terms of manageability we have a few more benefits then before. We now have a single add-on that we can trouble shoot (and a single add-on that splunk can manage), modify, etc.. as needed. Rather then going through the back end and accessing 3 different add-ons.
Data models are largely useful for many reasons premium apps, search queries, etc… A single data source can have upwards of thousands of events. Not all common and some very unique. With each version of the Windows TA comes better definitions that supports greater functionality which in turn improves our analytical work.
Python three is a much larger change that’s worth noting. On January 1st, of 2020 python version 2 is officially deprecated. In efforts to foresee 3rd parties switching their own development to python 3. So has come the request support that same change within TAs. The effort is largely based to support the different/newer version of Python as time passes and the old ways exit life.
Conclusion
With each change comes a small push back. There’s a new processes we’re not willing to learn, more knowledge we’ll have to comprehend, and more. At the same time it’s worth noting that technology is also ever changing, growing, improving. As with the TA versions. Upgrading/modifying existing applications to-date might break some processes but ultimately it’s for improvement.
В данной статье пойдет речь о том, как импортировать данные с клиентской машины или сети на сервер Splunk, который уже был настроен ранее. Читатели также поймут, какие данные нужно проиндексировать.
В предыдущей статье уже была рассмотрена установка Splunk с краткой демонстрацией настройки панели мониторинга и мониторингом журнала. С ней можно подробнее ознакомиться, перейдя по ссылке. После завершения настройки сервера нужно сосредоточиться на том, как перенести журналы из сетевой среды в Splunk для индексации.
Настало время узнать, как пересылать журналы или данные с клиентского сервера на Splunk Enterprise.
Условия для практики
Чтобы настроить универсальный Splunk Forwarder на своем клиент-сервере, необходимо выполнить некоторые предварительные подготовления для его установки.
- системы Windows, Linux или облачные серверы с доступом от имени администратора;
- универсальный Splunk Forwarder;
- ОС атакующего: Kali Linux.
Настройка приема данных на Splunk Enterprise
На панели мониторинга Splunk необходимо настроить индексатор для приема данных, прежде чем отправлять что-либо. Если пользователь этого не сделал, то данные никуда не будут переданы.
Используется веб-интерфейс Splunk для настройки приемника для установления связи Splunk-to-Splunk (S2S). Для этого следует выполнить следующие действия:
- Нужно войти в Splunk web, используя свои учетные данные
- В Splunk web необходимо перейти в раздел «Settings» > «Forwarding and Receiving»

Нужно выбрать параметр «Сonfigure Receiving».

Следует убедиться, что существующие порты открыты. Если нет доступных портов, то пользователь добавит порт. Нужно также отметить, что человек не может создать дубликат порта приемника. Наиболее подходящим портом приемника для индексаторов является порт 9997.
Тут надо выбрать пункт «New receiving port».

Также нужно добавить номер порта и сохранить его, а также не забыть проверить, что порт доступен и не зарезервирован для какой-либо другой службы.

Человек проверит состояние принимающего порта, он должен быть включен для прослушивания трафика.

Альтернативный метод: настройка приемника с помощью командной строки
Надо использовать интерфейс командной строки с правами администратора в Windows 10 или терминал с правами root для настройки приемника для установления связи S2S. Для этого человеку необходимо выполнить следующие действия:
- Открыть командную строку на правах администратора или в терминале на правах пользователя с root;
- Изменить путь на $SPLUNK_HOME/bin;
- Указать (для Linux) тип:
- ./splunk дает возможность слушать порт 9997 —auth admin:password;
- Указать (для Windows) тип:
- Splunk дает возможность слушать порт listen 9997 —auth admin: password.
Стоит перезапустить Splunk, чтобы новые изменения вступили в силу, перейдя в раздел настройки веб-интерфейса «Splunk» > «Server control» > «restart Splunk».
Альтернативный метод: настройка приемника с помощью конфигурационного файла
Для Windows
Настройка inputs.conf для установления связи S2S:
- Открыть Shell prompt;
- Изменить путь на $SPLUNK_HOME / etc / system/local
- Отредактировать файл conf;
- Отредактировать файла inputs.conf со строфой [splunktcp] и определить принимающий порт. Например:
- [splunktcp://9997]
- disabled = 0
- Сохранить файл;
- Перезапустить Splunk, чтобы сохранить изменения.
Для Linux
Нужно открыть каталог Splunk Forwarder, где бы он ни находился, и найти файл с именем input.conf, потом внести изменения, как описано выше или в соответствии с требованиями пользователя.
Среда
В этой статье идет речь об установке универсального форвардера Splunk на компьютере или сервере Windows. Читатели могут скачать Splunk Forwarder, перейдя по ссылке.
Нужно выбрать подходящий установочный пакет.
- Создать учетную запись Splunk и загрузить версию Splunk Universal Forwarder для Windows по приведенной выше ссылке;
- Выбрать Windows 10 с 64 битным пакетом msi для установки. Его читатели могут установить в соответствии с системными требованиями.

Также для системы Linux читатели могут воспользоваться опциями, доступными для загрузки на веб-сайте Splunk. Они выберут и загрузят пакет в соответствии с их требованиями, как показано ниже.

Установка Splunk Universal Forwarder на Windows 10
Чтобы установить Universal forwarder на свою операционную систему, следует выполнить следующие действия:
- Посетить официальный сайт Splunk, выбрать и загрузить Universal Forwarder для Windows 10. Система скачает zip-файл в Загрузки, как показано ниже.

Когда файл будет загружен, следует открыть его и запустить процесс установки, приняв лицензионное соглашение, а затем перейдя к настройке параметров, как показано ниже.

Далее человек выберет каталог установки, куда он хочет установить программу, как показано ниже на картинке:

Кроме того, программа попросит вас ввести SSL-сертификат для шифрования с помощью ключа шифрования, если у человека нет SSL-сертификата, то не стоит переживать, переадресованные данные Splunk все равно будут зашифрованы с помощью стандартного сертификата Splunk по умолчанию.

В следующем диалоговом окне пользователя будут ждать два параметра:
- Локальная система. Если человек укажет пользователя локальной системы в процессе установки, универсальный форвардер сможет получить доступ ко всем данным, которые доступны в локальной системе или пересланы на эту машину.
- Учетная запись домена. Этот параметр устанавливает переадресатор в соответствии с указаниями пользователя Windows, что позволяет собирать журналы и метрики с удаленных компьютеров, а также локальные и пересылаемые данные. Человек может установить разрешения учетной записи в следующем диалоге, так как локальный администратор или пользователь с ограниченными привилегиями не собирает данные из ресурсов, к которым пользователь Windows не имеет доступа.
Итак, пользователь применяет параметр «Локальная система» и устанавливает форвардер в качестве локальной учетной записи, чтобы осуществить любое из следующих действий:
- Удаленное чтение журналов событий;
- Он будет производить подсчет производительности системы удаленно;
- Чтение сетевых ресурсов для файлов журналов;
- Он сможет получить доступ к мониторингу Active Directory, если будет выбран этот пункт.

Затем инструмент попросит пользователя выбрать приложения или файлы журналов, которые он желает переслать в Splunk Enterprise или Receiver, а после перейти к следующему параметру, как показано ниже.

В следующем диалоговом окне он попросит пользователя создать учетные данные для учетной записи администратора для шифрования всех файлов в Splunk Enterprise.

В следующем диалоговом окне можно будет (необязательно) сконфигурировать форвардер в качестве сервера развертывания, если человек выберет его, а затем ввести имя хоста или IP-адрес и порт управления для сервера развертывания.
В данном случае это поле останется пустым.
В следующем диалоговом окне нужно настроить приемный индексатор, введя имя хоста или IP-адрес и порт, как показано ниже.

И затем, наконец, выбрать опцию установки, после чего и будет установлен Splunk Forwarder на Windows.

После этого следует завершить процесс установки.

Нужно проверить файл output.conf для того, чтобы понять, переадресован ли он получателю или нет.
Для этого выполняются следующие действия.
Человек переходит в файловый менеджер и открывает каталог, в котором установлен Splunk Universal Forwarder.

Открывает файл SplunkUniversalForwarder, а затем output.conf, который будет найден в разделе etc > system > local.

Открыв его, человек может убедиться, что файл либо перенаправлен на правильный IP-адрес, либо нет, как это было описано в процессе установки, если нет, то можно внести изменения, отредактировав содержимое.

Настройка программы для отправки данных в Splunk Enterprise
Нужно открыть CMD от имени администратора и выполнить описанные ниже команды:
cd c:Program FilesSplunkUniversalForwarder
cd bin
splunk add-forward-server 192.168.0.196:9997
splunk enable eventlog system
splunk restart
Ура! Пользователь успешно добавил Windows в качестве клиента.
Стоит проверить, что происходит с графическим интерфейсом Splunk, добавлен он или нет.

Как видно, клиент успешно добавлен.
Теперь нужно найти его в приложении поиска и отчетности, просто запустив запрос index=”main”.

Мониторинг журналов Windows
Стоит проверить, есть ли подозрительная активность на клиентской конечной точке.
Для этого нужно получить сеанс RDP своего клиента.

Сейчас в RDP сессии есть клиент пользователя. Стоит понять, что происходит в Splunk web.

Все работает. Это прекрасно!
Теперь читатели могут копать глубже с помощью запущенных поисковых запросов.
Мониторинг угроз
Надо проследить, какие незаконные или подозрительные действия происходят на клиентской конечной точке или сервере.
Для этого следует выполнить атаку брут-форс с помощью атакующей машины: Kali Linux.
Для выполнения этой атаки нужно ввести следующую команду ниже:
hydra -L user.txt -P pass.txt 192.168.0.196 sshЗдесь IP-сервера клиента — 192.168.0.196.

Стоит проверить, что происходит в Splunk Web. Запускается запрос в приложении поиска и отчетности “sshd: session», а затем он просматривается.

Как видно, есть несколько попыток входа в систему пользователя.
Теперь человек может контролировать состояние системы, используя приведенные выше шаги.
Автор переведенной статьи: Vijay.
Intro
Without exception, if you are an experienced security analyst, then you know the importance of firewall logs and the invaluable network traffic related data that they provide. Many of the key strategies of information security revolve around the network traffic of an organization and the rules that govern it. No matter the type of firewall, whether it is a hardware appliance or a software/OS level firewall, it should be logged for security and auditing purposes.
Given the significance of the firewall logs themselves, it is easy to see the importance of monitoring for configuration changes to firewalls. If an ill-intentioned person were to modify the configuration of a firewall, they could easily introduce security weaknesses into a network.
In today’s blog we will explore a method designed to provide robust auditing and logging of modifications to Windows Firewalls.
Requirements
The information and instructions provided here pertain to Windows Server 2008 R2, Windows Server 2012, and Windows Server 2012 R2.
Implementation
Windows Firewall Audit Settings
In order to ensure proper logging of all relevant modifications to the Windows Firewall, certain audit policy settings need to be enabled. Like all other audit settings, they can be enabled via updates pushed out through a GPO (Group Policy Object) or locally via edits to the Local Security Policy.
The location within Local Security Policy for these specific audit settings is as follows (see screenshot):
Security Settings: Advanced Audit Policy Configuration
Category: Policy Change
— MPSSVC Rule-Level Policy Change
— Filtering Platform Policy Change
Modification to the Splunk Add-on for Microsoft Windows
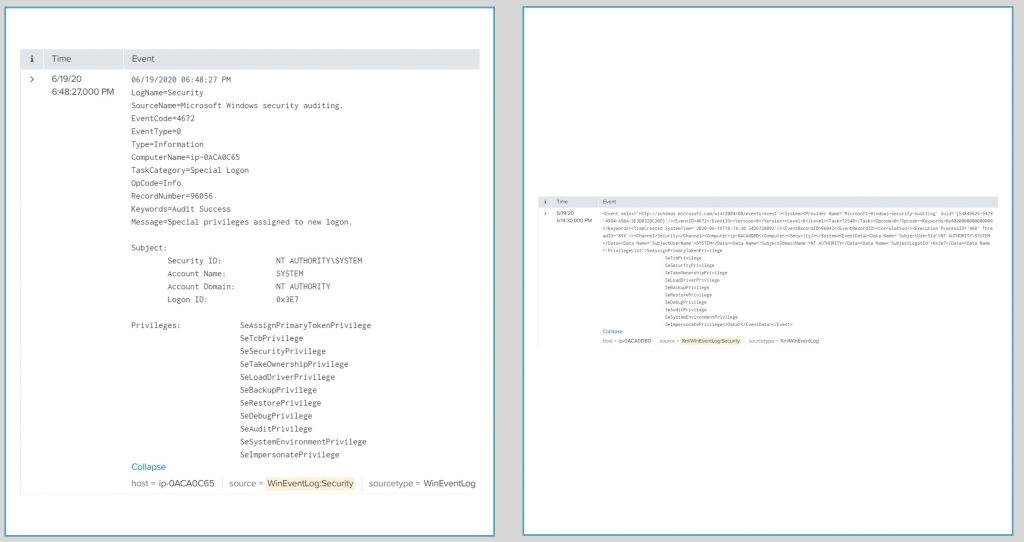
Once you have enabled the audit settings on your Windows server, the next step is to enable logging of these new events within Splunk. By default, Windows will now start recording firewall modifications within WinEventLog:Security (security.evtx). Assuming that you have the Splunk Add-on for Microsoft Windows installed on your servers and have the WinEventLog:Security input enabled, then you will start receiving some of these related without any further configuration. While this is a good start, the events that are generated here do not provide as much detail as those that are recorded within the Windows Firewall With Advanced Security log.
Here is an example event where I added a new firewall rule. When the event is sent to Splunk via the standard WinEventLog:Security log it looks like this (see screenshot):
Here is the same event in the Windows Firewall With Advanced Security log (see screenshot):
As you can see, the second event provides much more detail regarding the specific firewall rule that was added to the server. These additional details can be of great help for more advanced reporting and alerting within Splunk and the Enterprise Security app.
Here are the modifications to inputs.conf within Splunk_TA_windows that are required to capture the firewall log. Of course feel free to modify the settings as needed for your environment.
[WinEventLog://Microsoft-Windows-Windows Firewall With Advanced Security/Firewall]
disabled = 0
start_from = oldest
current_only = 0
checkpointInterval = 5
index = windows
What’s Next?
Once you have the firewall events in Splunk, take some time to examine the automatically extracted fields. With this data you should have no problem moving forward building useful dashboards, reports and alerts.
From personal experience, I found it very useful to map these events to the Change Analysis data model. I chose to utilize the Endpoint Changes sub-node of the data model. From there I was able to build custom searches against the accelerated data and save them as correlation searches within the Splunk App for Enterprise Security. As a result, now I see a notable event generated within ES for every modification to a Windows Firewall within the network.
Thanks for reading and please leave a comment or email us at info@function1.com with any questions. Happy Splunking!
At Octamis we love Splunk, and we love to share our knowledge and experience, so let’s study some tips on Windows monitoring with Splunk !
PREPARING YOUR SPLUNK
Let’s proceed in the order, we want first to get Splunk ready to receive Windows performance data.
This is quite simple and relies on deploying the Windows technical add-on built by Splunk:
https://splunkbase.splunk.com/app/742/
Depending on your Splunk architecture, ensure to deploy the technical add-on everywhere it is required:
- Indexers (clustered or standalone)
- Search heads
- Intermediate forwarder on the path to your indexers, if any
The add-on has no inputs activated by default, at this point there are no modification required.
Indexes creation:
The Windows technical add-on contains the embedded definition for a few indexes:
- perform: dedicated index for Windows monitoring data using the perfmon
- windows: dedicated index for various log data and monitoring not related to perfmon data
- wineventlog: security and log data
If you are running a standalone server then you have nothing else to do as the indexes have created for you by the add-on.
If you are running Splunk with clustered indexers, be sure to declare those indexes properly before continuing the setup.
DEPLOYING AND CONFIGURING THE ADD-ON
For the demonstration purpose, we will assume that:
- You already have servers running with the Splunk Universal Forwarder
- The servers are connected to your Splunk indexer(s) and properly configured for Splunk indexing
- The servers are connected to a Splunk deployment server (recommended) or you use your deployment solution
Deploy the technical add-on as usual and continue the setup.
COLLECTING PERFORMANCE DATA
Let’s have a look at the default “inputs.conf” file provided within the technical add-on, since we focus on performance metric, we are only interested for now in the “perfmon” stanzas.
For the the demonstration purposes, let’s have a look at CPU and memory metrics:
Splunk_TA_windows/default/inputs.conf
## CPU
[perfmon://CPU]
counters = % Processor Time; % User Time; % Privileged Time; Interrupts/sec; % DPC Time; % Interrupt Time; DPCs Queued/sec; DPC Rate; % Idle Time; % C1 Time; % C2 Time; % C3 Time; C1 Transitions/sec; C2 Transitions/sec; C3 Transitions/sec
disabled = 1
instances = *
interval = 10
object = Processor
useEnglishOnly=true
index = perfmon

## Memory
[perfmon://Memory]
counters = Page Faults/sec; Available Bytes; Committed Bytes; Commit Limit; Write Copies/sec; Transition Faults/sec; Cache Faults/sec; Demand Zero Faults/sec; Pages/sec; Pages Input/sec; Page Reads/sec; Pages Output/sec; Pool Paged Bytes; Pool Nonpaged Bytes; Page Writes/sec; Pool Paged Allocs; Pool Nonpaged Allocs; Free System Page Table Entries; Cache Bytes; Cache Bytes Peak; Pool Paged Resident Bytes; System Code Total Bytes; System Code Resident Bytes; System Driver Total Bytes; System Driver Resident Bytes; System Cache Resident Bytes; % Committed Bytes In Use; Available KBytes; Available MBytes; Transition Pages RePurposed/sec; Free & Zero Page List Bytes; Modified Page List Bytes; Standby Cache Reserve Bytes; Standby Cache Normal Priority Bytes; Standby Cache Core Bytes; Long-Term Average Standby Cache Lifetime (s)
disabled = 1
interval = 10
object = Memory
useEnglishOnly=true
index = perfmon
Things you will (should) probably want to customise:
- “interval” : this is the time in seconds between 2 performance collections, and will influence the volume of data to be generated. 10 seconds is probably quite high, 30 or 60 seconds are good values that save license, bandwidth and CPU footprint on the servers
- “mode = multikv” : this is a great option introduced years ago (see: https://www.splunk.com/blog/2013/10/28/new-features-for-perfmon-in-splunk-6), this is smart, it saves license, storage and bandwidth
- “disabled = 1”: This deactivates the input which is the case by default but you need to explicitly activate each input
Let’s with the following configuration, as always do never modify a default file, create a local file and copy only the stanzas you are interested in:
Splunk_TA_windows/local/inputs.conf
## CPU
[perfmon://CPU]
counters = % Processor Time; % User Time; % Privileged Time; Interrupts/sec; % DPC Time; % Interrupt Time; DPCs Queued/sec; DPC Rate; % Idle Time; % C1 Time; % C2 Time; % C3 Time; C1 Transitions/sec; C2 Transitions/sec; C3 Transitions/sec
disabled = 0
instances = *
interval = 30
object = Processor
useEnglishOnly=true
index = perfmon
mode = multikv

## Memory
[perfmon://Memory]
counters = Page Faults/sec; Available Bytes; Committed Bytes; Commit Limit; Write Copies/sec; Transition Faults/sec; Cache Faults/sec; Demand Zero Faults/sec; Pages/sec; Pages Input/sec; Page Reads/sec; Pages Output/sec; Pool Paged Bytes; Pool Nonpaged Bytes; Page Writes/sec; Pool Paged Allocs; Pool Nonpaged Allocs; Free System Page Table Entries; Cache Bytes; Cache Bytes Peak; Pool Paged Resident Bytes; System Code Total Bytes; System Code Resident Bytes; System Driver Total Bytes; System Driver Resident Bytes; System Cache Resident Bytes; % Committed Bytes In Use; Available KBytes; Available MBytes; Transition Pages RePurposed/sec; Free & Zero Page List Bytes; Modified Page List Bytes; Standby Cache Reserve Bytes; Standby Cache Normal Priority Bytes; Standby Cache Core Bytes; Long-Term Average Standby Cache Lifetime (s)
disabled = 0
interval = 30
object = Memory
useEnglishOnly=true
index = perfmon
mode = multikv
Deploy this configuration to your Windows servers, and if you use Splunk deployment server, ensure you check “restart splunkd”.
CHECKING DATA COMING IN
Next step, let’s check for some data coming in:
index=perfmon

Depending on the mode (multikv or not), the data will be available in:
CPU statistics:
- standard mode: index=perfmon sourcetype=”Perfmon:cpu”
- multikv mode: index=perfmon sourcetype=”PerfmonMk:cpu”
Memory statistics:
- index=perfmon sourcetype=”Perfmon:Memory”
- index=perfmon sourcetype=”PerfmonMk:Memory”
In this article, we will go will the multikv mode.
ANALYSING CPU STATISTICS
Let’s get some CPU statistics:
Per host average CPU usage over time:
index=perfmon sourcetype="PerfmonMk:CPU" instance=_Total
| timechart avg(%_Processor_Time) as cpu_usage by host

Very simple.
WHERE IS MY PERCENTAGE OF MEMORY UTILISATION ?
If you are “like me”, when looking at memory statistics, the first (and potentially the only) metric you want to be able to retrieve is the percentage of memory being used, or eventually memory free.
So what’s the problem then ? Well, “as it” although we have dozens of various metrics, the percentage of utilisation is not available with perfmon data.
What ???

Hopefully, we can calculate it ! Using Splunk power and features, we can correlate between the inventory data which contains the amount of physical memory available, and the memory metrics available in perfmon.
The following search reports the amount of physical memory in KB:
index=windows sourcetype=WinHostMon
| stats latest(TotalPhysicalMemoryKB) as TotalPhysicalMemoryKB, latest(TotalVirtualMemoryKB) as TotalVirtualMemoryKB by host | sort 0 host
Notes:
This requires the input “OperatingSystem” to be activated in your deployment, using:
[WinHostMon://OperatingSystem]
interval = 600
disabled = 1
type = OperatingSystem
index = windows
For the demonstration, let’s store this result in a temporarily lookup csv file:
index=windows sourcetype=WinHostMon
| stats latest(TotalPhysicalMemoryKB) as TotalPhysicalMemoryKB, latest(TotalVirtualMemoryKB) as TotalVirtualMemoryKB by host | sort 0 host
| outputlookup windows_memory_inventory.csv
Then, looking at the memory statistics, we have the amount of currently used volume of memory in KB, let’s map this with the inventory data and use some easy calculation:
index=perfmon sourcetype="PerfmonMk:Memory"
| eval used_memory_KB=coalesce('Available_KBytes', Value)
| lookup windows_memory_inventory.csv host as host OUTPUTNEW TotalPhysicalMemoryKB
| eval free_memory_pct=((used_memory_KB/TotalPhysicalMemoryKB)*100), used_memory_pct=(100-free_memory_pct)
| timechart avg(used_memory_pct) as used_memory_pct by host

There you go!
Resilient solution:
- create a KVstore based lookup table to store our Windows configuration inventory data
- schedule a report to update the lookup table on a regular basis (per day basis for example)
- create an auto lookup configuration such that it is not necessary to perform the lookup command manually
WHAT ABOUT PROCESSES ?
Understanding a system CPU load requires knowing what and when the processes consumes resources, the perfmon provides processes related data with the “[perfmon://Process]” stanza.
However, for some reasons the perfmon data is not accurate on multi core systems, a nice article gave me the answer I was looking for:
Windows CPU monitoring with Splunk
Based on this great article, let’s add our WMI input to generate accurate processes CPU statistics: (caution: this is a “wmi.conf” and not “inputs.conf”)
Splunk_TA_windows/local/wmi.conf
[WMI:process]
index = windows
disabled = 0
interval = 30
wql = Select IDProcess,Name,PercentProcessorTime,TimeStamp_Sys100NS from Win32_PerfRawData_PerfProc_Process
Once deployed, let’s use some magic searches and start analysing processes activity:
index=windows sourcetype="WMI:process" Name!=_Total Name!=Idle
| reverse | streamstats current=f last(PercentProcessorTime) as last_PercentProcessorTime last(Timestamp_Sys100NS) as last_Timestamp_Sys100NS by Name
| eval cputime = 100 * (PercentProcessorTime - last_PercentProcessorTime) / (Timestamp_Sys100NS - last_Timestamp_Sys100NS)
| search cputime > 0
| timechart limit=50 useother=f avg(cputime) by Name

Since Windows will create a new process for a given program able to run in multi core mode, we can improve this search and aggregate a per command invocation basis:
index=windows sourcetype="WMI:process" Name!=_Total Name!=Idle
| reverse | streamstats current=f last(PercentProcessorTime) as last_PercentProcessorTime last(Timestamp_Sys100NS) as last_Timestamp_Sys100NS by Name
| eval cputime = 100 * (PercentProcessorTime - last_PercentProcessorTime) / (Timestamp_Sys100NS - last_Timestamp_Sys100NS)
| search cputime > 0
| stats avg(cputime) as cputime by _time,host,Name
| rex field=Name "(?[^#]*)#{0,}"
| stats sum(cputime) as cputime by _time,host,Command
| timechart limit=50 useother=f avg(cputime) as cputime by Command

Et voila !
You now have all the main pieces of work to start analysing Windows performance with accuracy, enjoy.

Microsoft has a lot of options to view Azure log data in one
form or another. There is the Security Center, Azure Sentinel, Log Analytics,
and Insights. This is fine for an Azure centric
organization, but many organizations already have log collection systems in
place such as Splunk, and using multiple logging platforms is not efficient. This article walks through sending Azure AD
and Office 365 logs to Splunk.
Splunk is a leading log management solution used by many
organizations. This article and accompanying
video explain how to send log data from Azure AD and O365 to Splunk. The log data includes Azure AD Audit and
Login activity, Exchange Online, SharePoint, Teams, and OneDrive.
This article uses the Splunk Add-on for Microsoft Office 365
to collect log data from Azure AD and O365.
Once that’s in place, the Microsoft 365 App for Splunk is used to visualize
the log data.
The steps to send O365 log data to Splunk include:
- Add the Splunk Add-on for Microsoft Office 365
- Turn on Office 365 Audit Logging
- Create the Application in Azure AD
- Configure the Splunk Add-on for Microsoft Office 365
- Verify Logging
- Add the Microsoft 365 App for Splunk Add-on
Add the Splunk Add-on for Microsoft Office 365
I start with a clean install of Splunk for this
example. I’m using the free download options
available at Splunk.com. If you are following along with a new install,
remember to open port 8000 on the server firewall to access the admin web page
from other computers.
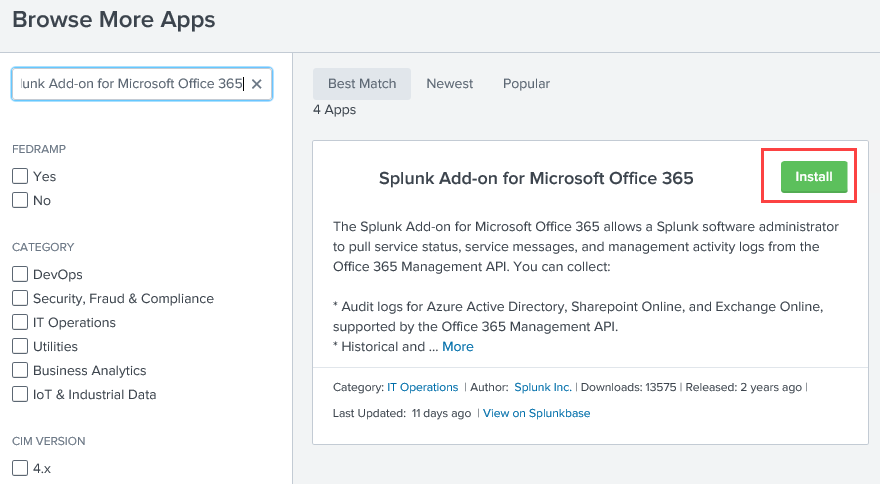
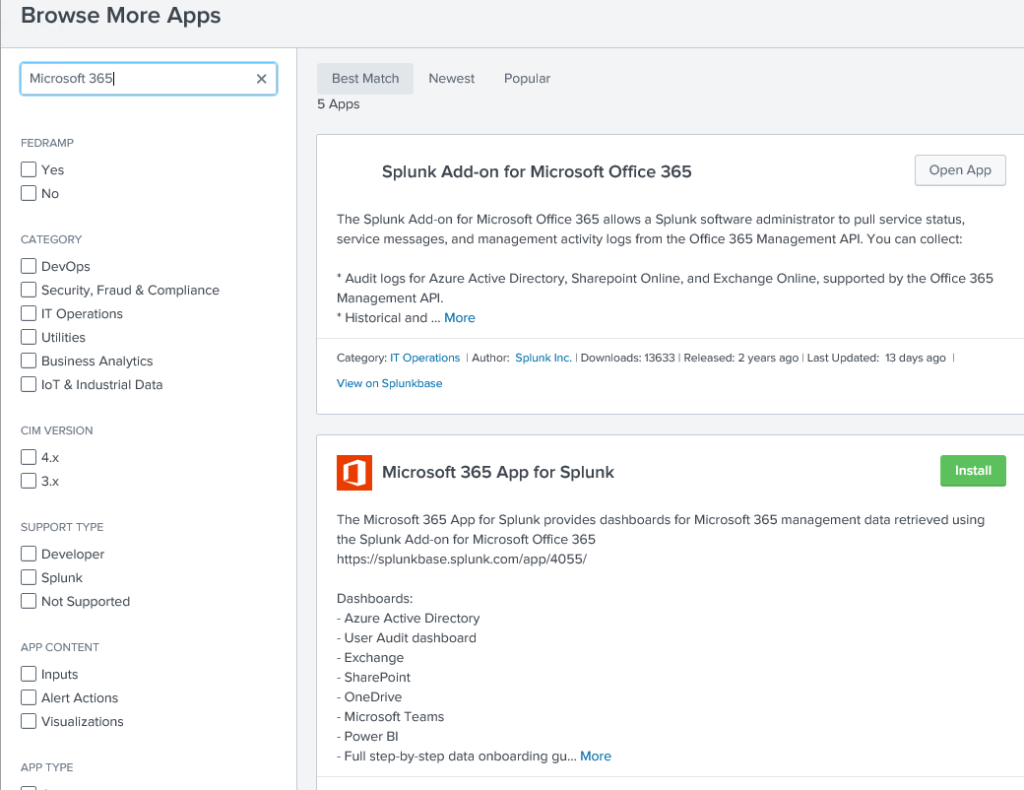
From the Splunk admin page, go to +Find More Apps

Search for Splunk Add-on for Microsoft Office 365 and click Install
to install the Add-on
Enter your Splunk.com username and password to install the add-on. When prompted, restart the Splunk application. It will take a couple of minutes for the service to restart.

Log back in and go to the home screen. You should see a new App called Splunk Add-on
for Microsoft Office 365. Click on that
to view the settings.
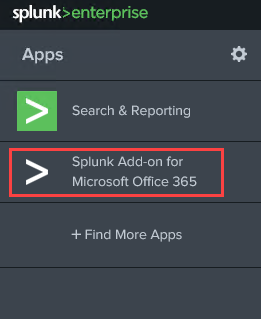
From inside the new App, click on Tenant, and Add
Tenant to view the required settings.

Notice this page requires the Tenant ID, Client ID, and a
Client Secret. We will get this
information in a couple of steps. First,
let’s make sure logging is configure on the tenant.
Turn on Office 365 Audit Logging
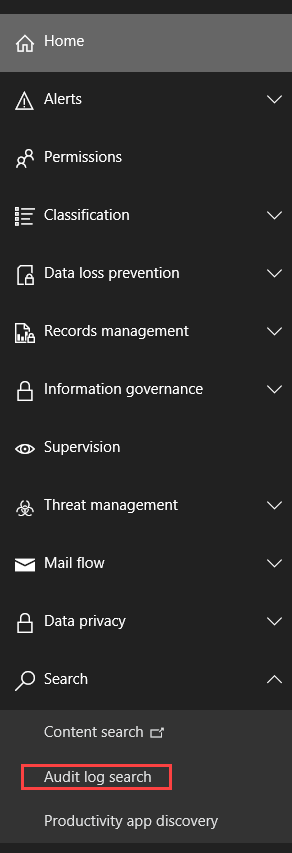
Office 365 logging is not always enabled by default on a tenant. To verify it’s enabled, log into the Office 365 Admin portal at https://admin.microsoft.com as a Global Administrator. Expand Show all to view all the services.
Select Security to go to the Security and Compliance
Center. Next, expand Search
and click on Audit Log Search.
If you see an image like the one below, click Turn on
Auditing to enable audit log collection.
If you don’t see an image like the one below, audit logging is already enabled.

Close the Office Portals when finished.
Create the Application in Azure AD
In this step, we create the Azure AD Application. An Azure
AD Application is not what you would traditionally think of as an application. It’s the representation of an application that
will access Azure AD. It’s similar to a
Service Account in Windows.
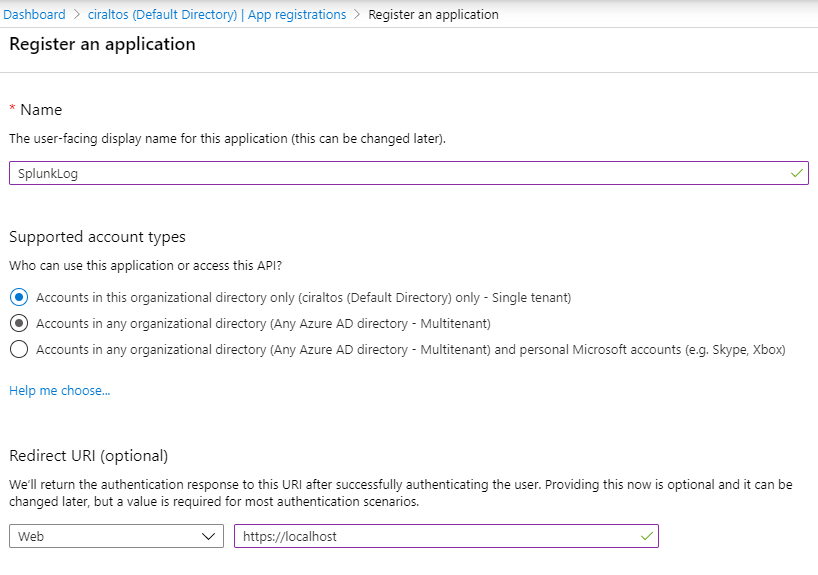
Go to the Azure portal and go to Azure AD, App
Registrations, and click New Registration.

Give the App a name and add a Redirect URI. The URI is not used can point to https://localhost.
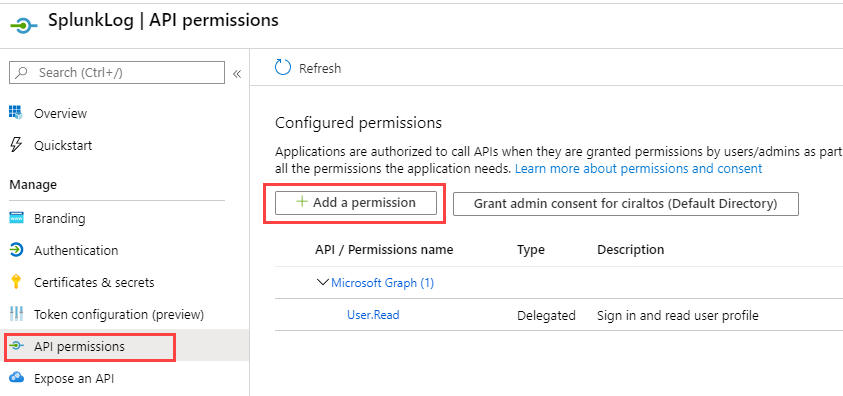
Next, go to API Permissions and Add a Permission to
configure access to the API.
Click on the Office 365 Management APIs box.

Go to Application Permissions.
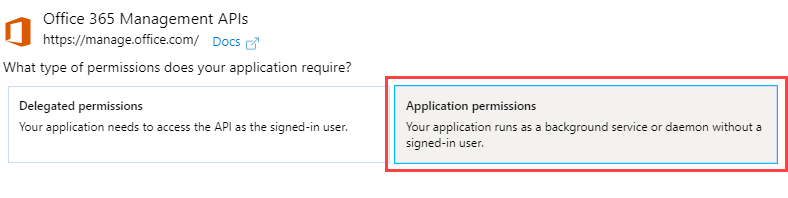
Expand and select each permission. This gives the App read permission to all the
log files Splunk will collect. Click Add Permissions when finished.

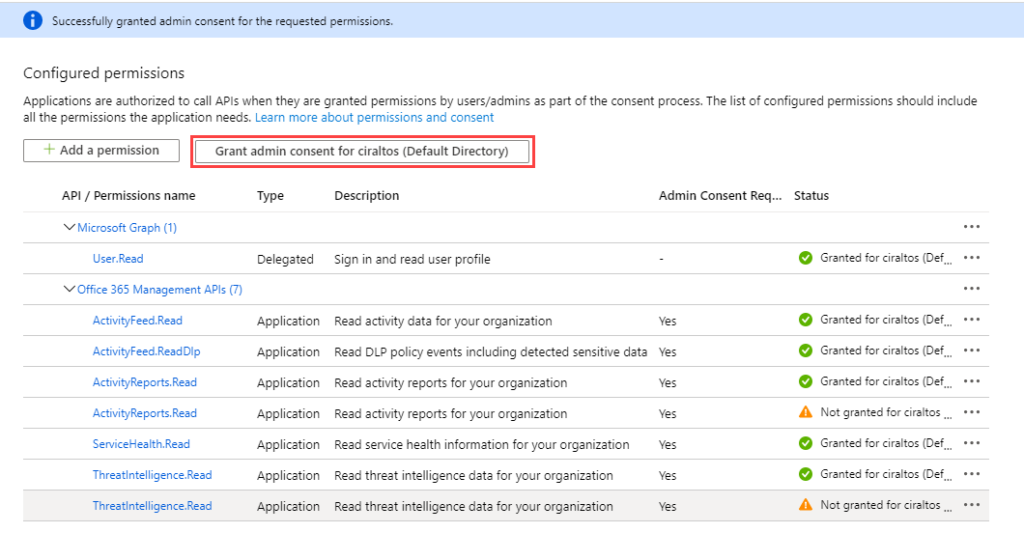
The permissions require admin consent to take effect. Click Grant Admin consent for “Tenant”
to continue. Notice that some permissions
have the status of not granted. These are
duplicate, log collection will work with the permissions granted
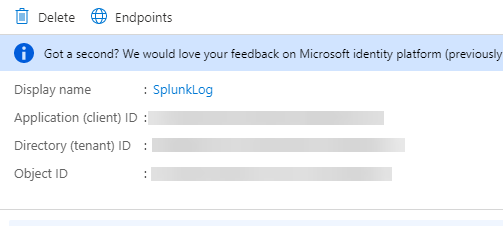
Next, go to Overview in the App Registration. Make a note of the Application (Client) ID
and Directory (Tenant) ID. Both these ID’s
are needed to configure Splunk in an upcoming step.
The Splunk Add-on also needs a secret to authenticate the
App to Azure AD. Go to Certificates
& Secrets and click on New Client Secret.
Select the desired expiration for the secret and add a description. Note that log collection will stop when the password expires and a new secret will need to be created. Click Add when finished.

A value for the new secret displays. Copy this value and keep is someplace safe. You will not be able to access this value
after exiting the window. You can create
another, but not view existing.

Configure the Splunk Add-on for Microsoft Office 365
Now that the App Registration is set up and we have the
values needed, we can configure the Splunk Add-on for Microsoft Office
365.
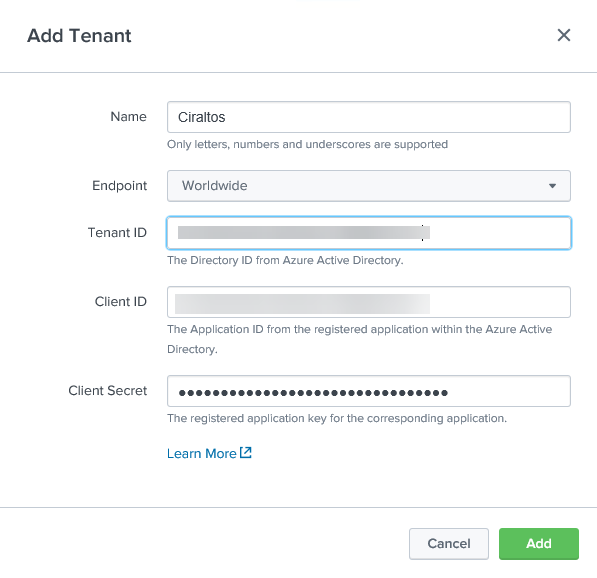
From Splunk, go to the Splunk Add-on for Microsoft Office
365, Tenant, and select Add Tenant.
You will see the Add Tenant box, as shown below. Add a Name, Select the Endpoint,
Government or Worldwide, and add the Tenant ID, Client ID, and Client
Secret from the previous step. Click
Add when finished
The Tenant tab should look like below when finished.

Once that’s finished, go to Input. This configures the logs that are collected
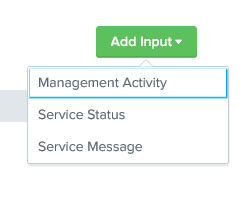
by Splunk. Go to Add Input and
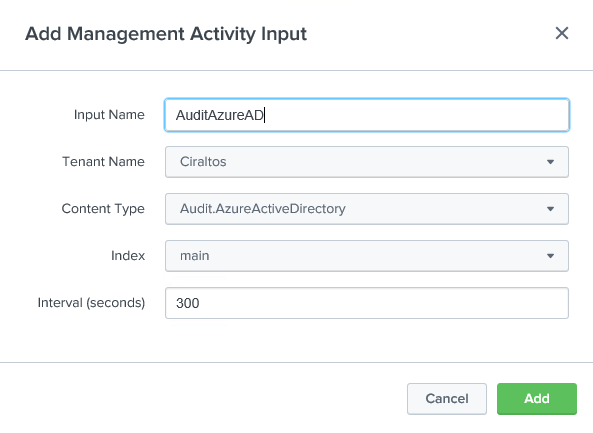
start with Management Activity.
Give the log a name, select the Tenant that was configured in the previous step, the content type, and set the index to Main. Once finished, click Add.
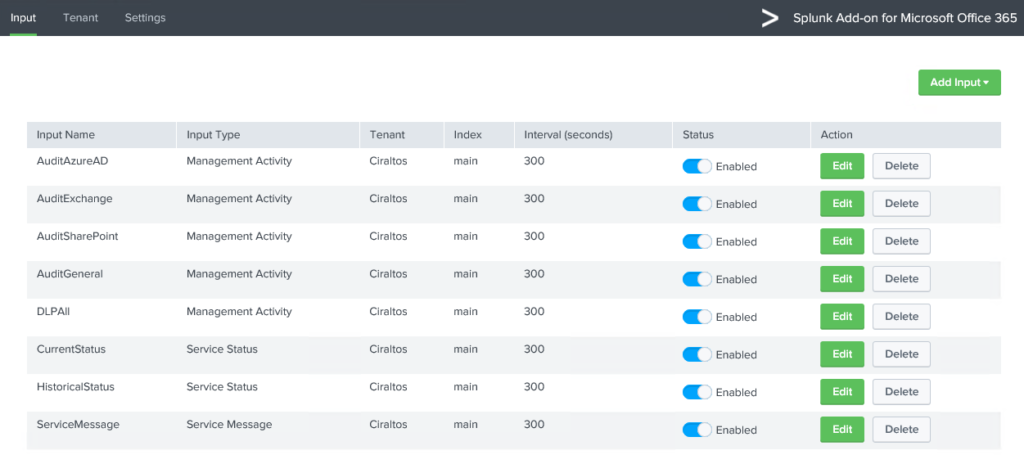
Repeat the above step for each Input type and content
type. Skip log files if they are not
needed. Once finished, the Input screen
will look similar to below.
Verify logging
Log data will become available shortly after configuring the
tenant and Inputs. Go to the Splunk home
page and go to Search & Reporting.
I have limited experience with searching in Splunk, but the two commands
below should return Azure AD Data if log collection is set up correctly.
Return everything from the “Main” index:
index="main"
The above command returns a lot of data. Use the command below to filter out some of
the noise and format the return into an easier format to read.
index="main" sourcetype="o365:management:activity" | search Operation!="UserLoggedIn" AND Operation!="TeamsSessionStarted"| table CreationTime,Operation,Workload
Notice that the Operations and Workload column indicates
multiple event types and log source files.
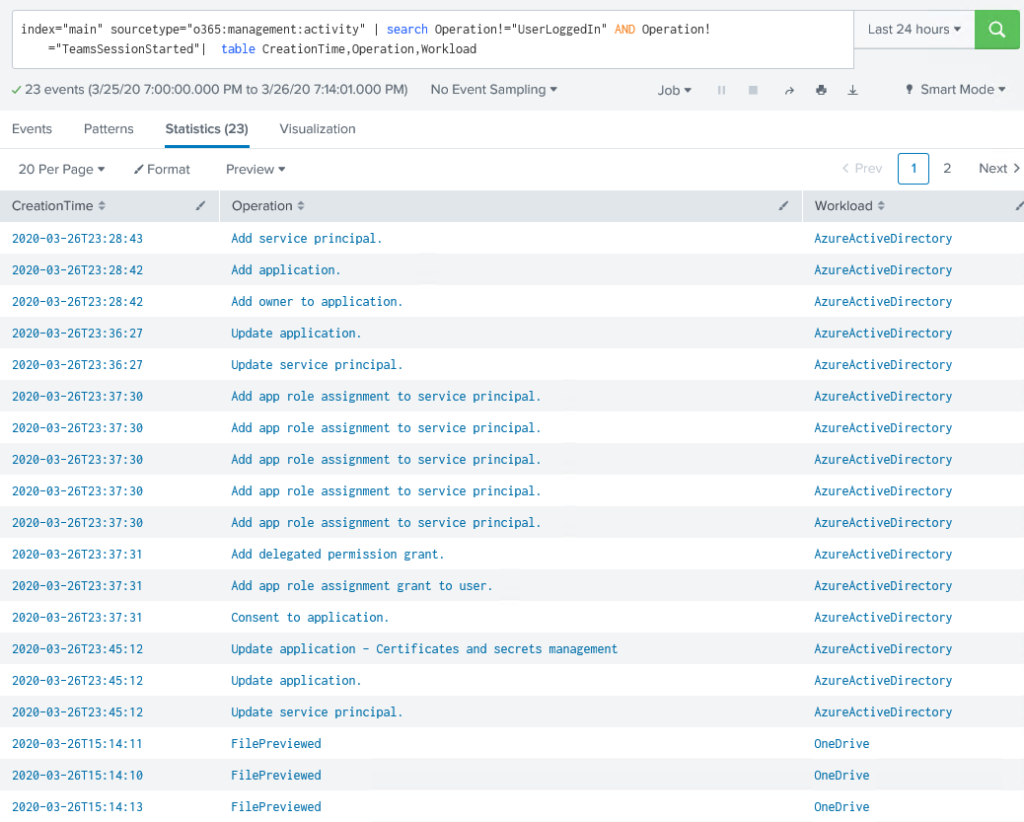
At this point, logging from Azure AD and O365 to Splunk is working. Log collection is not real-time. It can take 20 minutes or longer for data to show in the results.
Add the Microsoft 365 App for Splunk Add-on
The last item is to add the Microsoft 365 App for
Splunk. Go to the Splunk home page and click
on +Find More Apps. Search for Microsoft
365. Click Install for the
Microsoft 365 App for Splunk.
Click Done once finished. The Microsoft 356 App for Splunk requires three other add-ons listed below to function correctly. Visit this link for details. https://splunkbase.splunk.com/app/3786/#/details
Search and add the three add-ons to finish the Microsoft 365
app for Splunk install.
- Sankey Diagram
- Timeline
- Semicircle Donut
Once finished, go to the Microsoft 365 App for Slunk from
the Splunk home page. From here, navigate
to find different visualizations of your organizational data.

I hope this was helpful.
Thanks for visiting my blog!
The Visual Studio Code Extension for Splunk helps developers create, test, and debug Splunk Enterprise apps, add-ons, custom commands, REST handlers, etc. The extension helps Splunk administrators edit Splunk .conf files by providing stanza and setting completions as well as setting checking. For individuals living in Visual Studio Code, integrations are built in to run Splunk searches and display Splunk visualizations in Visual Studio Code.
Working with .conf files
- Syntax highlighting for .conf files
- IntelliSense for stanzas and parameters
- Stanza folding
- Linting
Running Saved Searches
Visual Studio Code communicates with the Splunk REST API to enumerate saved searches and displays the reports in the editor.
Viewing Reports
Visual Studio Code communicates with the Splunk REST API to enumerate reports and displays the reports in the editor.
This extension also provides capabilities for debugging user-generated Python code run by Splunk Enterprise (local or remote):
- Debug configurations
- Breakpoints
- Step into/over
- Variable inspection
Splunk Enterprise can be running on the same machine as Visual Studio Code, on a remote machine, or in a public cloud provider.
Documentation
Documentation can be found in the wiki hosted on the public repository.
https://github.com/splunk/vscode-extension-splunk/wiki
Support
This software is released as-is. Splunk provides no warranty and no support on this software.
If you have any issues with the software, please file an issue on the repository.
Azure Monitor Add-on for Splunk
NOTES
This Splunk TA (add-on) is Open Source and not an officially support Microsoft product. Support is best effort. Members of the community (you) are encouraged to participate so that this popular TA can get the support its users richly deserve.
Splunk updated their Python requirement to v3.x a few months ago. This TA still takes a dependency on Python 2.7.
The repo is archived due to lack of resources to keep it up to date.
Overview
This add-on is built using Node.js and Python 2.7 and has been tested on Ubuntu 14.04, Windows 10 and RHEL 7.
It consumes Metrics, Resource Diagnostic Logs, and Tenant Diagnostic Logs (AAD Activity Log) and the Azure Activity Log according to the techniques defined by Azure Monitor, which provides highly granular and real-time monitoring data for Azure resources, and passes those selected by the user’s configuration along to Splunk.
Here are a few resources if you want to learn more about Azure Monitor:
- Overview of Azure Monitor
- Overview of Azure Diagnostic Logs
- Overview of the Azure Activity Log
- Overview of Azure Active Directory Activity Logs, known in Azure Monitor as Tenant Diagnostic Logs.
- Overview of Metrics in Microsoft Azure
- Stream Azure monitoring data to an event hub for consumption by an external tool
Installation and Configuration
This add-on requires an Azure Event Hub, Key Vault, Azure AD Service Principal and other configurations to properly integrate Splunk with Azure. Creating and configuring the Azure resources can be accomplished using one of the scripts available in the .scripts folder as shown here:
MSI authentication
If you are planning to use MSI authentication instead of Service Principal (SPN), first ensure that you VM is up and running within your Azure subscription.
- Windows users can use the PowerShell script
.scriptsazure-setup.ps1. Proceed to the section Azure configuration for Windows users. - Linux and Mac users can use the Bash script
.scriptsazure-setup.sh. Proceed to the section Azure configuration for Linux / Mac users.
Azure configuration for Windows users
Requirements
- Azure PowerShell, which you can download from here. The script was tested with version 5.7.0 of the Azure PowerShell cmdlets running on Windows Server 2016.
- The following resource providers must be registered in your Azure subscription. You can find out which resouce providers are registered in your subscription using the command
Get-AzureRmResourceProvider | Where-Object { $_.RegistrationState -eq "Registered" } | Select ProviderNamespace.- Microsoft.Authorization
- Microsoft.EventHub
- Microsoft.KeyVault
- Microsoft.Storage
- microsoft.insights
Configuration Steps
-
Open
.scriptsazure-setup.ps1. Replace the variables at the top of the script with values from your environment.$subscriptionId: Your Azure subscription Id.$tenantId: The tenant / directory Id for your Azure subscription.$splunkResourceGroupName: The name of the resource group to deploy the cluster into. This can be a new or existing resource group.$splunkResourceGroupLocation: The location you want to deploy the cluster in. For example, eastus, westus, etc.
An example showing the variables populated is shown here:

-
Run the script. The script will prompt you to authenticate to your Azure subscription. The output for the script will look similar to the output shown here:
Proceed to the section Splunk Enterprise configuration.


Azure configuration for Linux / Mac users
Requirements
- Azure command-line interface (CLI), which you can download from here. The script was tested with version 2.0.42 of the Azure CLI running on Ubuntu 18.04 LTS.
- The following resource providers must be registered in your Azure subscription. You can find out which resouce providers are registered in your subscription using the command
az provider list --query '[?registrationState==`Registered`].namespace'.- Microsoft.Authorization
- Microsoft.EventHub
- Microsoft.KeyVault
- Microsoft.Storage
- microsoft.insights
Configuration Steps
-
Open a terminal window and navigate to the
.scriptsfolder. The bash script requires four parameters as shown here:usage: azure-setup.sh [options] options: -l <location> : [Required] Location to provision resources in. Ex. westus, eastus, etc. -r <resource group name> : [Required] Resource group to deploy resources into. -s <subscription id> : [Required] Azure subscription Id. -t <tenant id> : [Required] Azure Active Directory / Tenant Id. -m <vm name> : [Optional] VM name of VM that has MSI enabled. This will skip SPN setup and assign RBAC access for the VM.
-
Run the script. The script will prompt you to authenticate to your Azure subscription. The output for the script will look similar to the output shown here:
Proceed to the section Splunk Enterprise configuration.

Splunk Enterprise configuration
-
Install the add-on in Splunk Enterprise using the latest package file from the github releases page.
-
In Splunk, open the apps manager page by clicking on the gear icon.
-
Click on the button labeled Install app from file.
-
In the dialog window, click the Browse… button and select the downloaded
.splfile. Next, click the Upload button. -
After uploading the add-on app, the apps manager page should show the application installed in Splunk. An error message may also appear if the indicating the add-on could not initialize. This is typically because dependencies for Python and/or Node.js are not present.
-
To resolve the error message stating Splunk is «Unable to initialize modular input», install Node.js and Python on your Splunk Enterprise instance as described here. An example for an instance running on Ubuntu is shown below:
-
Run the following commands to install the Python and Node.js dependencies:
# Elevate to root user
sudo -i

# Download script to setup Python dependencies
curl -O https://raw.githubusercontent.com/Microsoft/AzureMonitorAddonForSplunk/master/packages/am_depends_ubuntu.sh

# Set the execution attribute on the downloaded script
chmod +x ./am_depends_ubuntu.sh

# Run the script
./am_depends_ubuntu.sh

# Download Node.js and it's dependencies
curl -sL https://deb.nodesource.com/setup_6.x | sudo -E bash -

# Install Node.js
apt-get install nodejs

# Install Nodel modules in the add-on's app folder.
cd /opt/splunk/etc/apps/TA-Azure_Monitor/bin/app
npm install

# Return back to a non-root user
exit
-
Go back to Splunk and click the Disable link for the add-on.
-
Click the Enable link to re-enable the add-on. The add-on should be enabled now without any error messages appearing.
-
-
-
Using the output from either the
.scriptsazure-setup.ps1or.scriptsazure-setup.shabove, configure the add-on’s data inputs.-
In Splunk, click on Settings -> Data Inputs at the top of the page.
-
For each of the add-on’s data inputs, add a new configuration by copying and pasting the settings from the script’s output into the data input’s configuration.
-


Support
If you have encountered difficulties with the add-on, the first thing to do is ensure that all Python and Nodejs dependencies are installed correctly according to the installation instructions in the wiki.
The Activity Log and Diagnostic Log data inputs use AMQP to connect to event hub over TLS using ports 5671 / 5672 as described in the AMQP 1.0 Service Bus and Event Hubs protocol guide. So, if you are having connection/authentication issues, check that these ports are open on your Splunk instance.
The Azure Monitor Metrics data input uses HTTPS to call into the Azure Monitor Metric API. As such, outbound traffic over port 443 needs to be enabled on the server.
If that doesn’t help, the next thing to do is switch logging for ExecProcessor to Debug (Settings / Server Settings / Server Logging in Splunk Web) and recycle the add-on (disable/enable). Then search for ‘azure_monitor’ ERROR and DEBUG messages. There will be a lot of DEBUG messages. If you don’t see anything helpful, open an issue in the repo.
Contributing
This project has adopted the Microsoft Open Source Code of Conduct. For more information see the Code of Conduct FAQ or contact opencode@microsoft.com with any additional questions or comments.
Generating the Splunk package file
To test changes, you will need to generate a version specific package file that includes your changes, such as .packagesTA-Azure_Monitor_1_2_7.spl. Follow the steps below to generate the version specific package file.
Note: The Windows script package.cmd requires 7-Zip to build the the file structure and contents. So, make sure you have this installed on your computer and that 7z can be run from a command/shell prompt. On Mac and Linux, package.sh will use tar if 7-zip is not installed.
-
Open
.defaultapp.confand bump the version property in the [launcher] section. -
This step generates the version specific package file. If you are running Windows, then you will use the
.deploymentpackage.cmdscript. If you are running Mac or Linux, use the.deploymentpackage.shscript. Open a command/shell prompt and change to the.deploymentdirectory. Execute the script, passing in the version specific string as shown below. Notice the use of underscores in the string.Windows
Mac or Linux
The version specific package file will be in the
.packagesfolder, as shown below. -
The version specific package file should be committed to the repository with your code changes. It is tradition to remove the oldest version specific package file when creating a new one.

Introduction
Splunk is a highly versatile software platform renowned for processing and visualizing sizeable real-time data quantities. To unlock its full potential and tailor it to your specific needs, you may install Splunk add-ons, modules designed to augment Splunk’s capabilities with additional features and functionalities. Do note that special permissions are required to install add-ons. Furthermore, each add-on has its own distinct installation and configuration procedures. Reading the add-on’s documentation is advisable to comprehend its usage and configuration.
Affiliate: Experience limitless no-code automation, streamline your workflows, and effortlessly transfer data between apps with Make.com.
Method 1: Using the ‘Find More Apps’ Feature to Install Splunk Add-Ons
This method requires an internet connection on the Splunk Server. To install a Splunk add-on through the Splunk Web interface, please follow the steps provided below:
1. Access your Splunk instance. Start your Splunk server and then access Splunk Web on your web browser. You will be required to log in using your user credentials. Usually, it’s at
http://localhost:8000
if you’re on the same machine as your Splunk server.
2. Locate the [Apps] button in the interface’s upper left corner. Proceed by selecting [Find More Apps]. This action will redirect you to Splunkbase, the marketplace for all Splunk apps and add-ons.
3. Utilize the search function to find the specific add-on you desire. When located, click the [Install] button associated with the add-on.
4. Subsequently, you will be requested to provide your Splunk.com credentials. Please enter the necessary information and proceed by clicking “Login and Install.”
5. A prompt will appear, asking for your consent to restart Splunk. Please choose “Restart Now” to proceed. If not, note that you can choose to “restart” later. However, the installed add-on will only be available for use after the restart has taken place.
Method 2: Install Splunk Add-On from the Splunkbase site
This method doesn’t require an internet connection on the Splunk server. You will need to download the file on an external computer that does and transfer the file to the Splunk server for installation.
How to download the add-on on a computer with an internet connection
1. Open a web browser and navigate to Splunkbase at
https://splunkbase.splunk.com/
2. Once on the site, use the search bar at the top to search for the specific add-on you want. You can also browse through the available add-ons by category if you prefer.
3. Click on the add-on’s name in the search results to go to its specific page. This page contains details about the add-on, including its description, version information, and any specific installation instructions or requirements.
4. Look for the “Download” button on the page’s right side. Click this button to download the add-on. You can install the add-on directly into your Splunk Enterprise instance by downloading the .spl or .tgz file and installing it. Please make sure to take note of where the file is being saved on your local machine to access it easily in the future.
5. Sometimes, you may be required to log into your Splunk account before downloading the add-on. If prompted, enter your credentials to continue with the download.
6. Move the downloaded file from the computer to the Splunk server. Mind where you put the file on the server.
How to install Splunk add-on on Splunk server without an internet connection
1. Access Splunk Enterprise: Next, you must sign in to your Splunk instance using your login details through the web interface.
2. Click the “Apps” menu on the home page’s upper left side, then select “Manage Apps.”
3. select “Install the app from file ” once on the apps page.”
4. A dialog box titled “Upload app” will pop up. Here, you must click “Choose File.”
5. Navigate to the location of the .spl or .tgz file you downloaded earlier and select it.
6. Click “Upload” to install the Splunk add-on.
7. You might need to restart your Splunk instance for the add-on to work correctly.
8. After installing your add-on, you may need to perform additional setup depending on your chosen add-on. You can find detailed instructions for this in the specific documentation of the add-on.
9. You can check if the Splunk add-on was installed correctly by returning to the “Manage Apps” page. The add-on should be there.
Method 3: Install Splunk add-on manually
This approach also doesn’t necessitate online access for the Splunk server. Instead, you’ll have to download the requisite file using a separate computer with internet capabilities and then move this file to the Splunk server to proceed with the installation.
For example, we will use the Splunk add-on “Python for Scientific Computing (for Windows 64-bit)”. This method is relevant mainly to the users that would get an error message:
failed to extract the app from C:\Program Files\Splunk\var\runq2aw1qa2w1q2.tar.gz
to C:\Program Files\Splunk\var\run\splunk\bundle_tmp8s7d6f8s7d6f8s7d6f: The system cannot find the path specified.
Such an issue arises primarily with larger files, like this add-on, which has a size of around 450MB.
Follow the steps in “How to download Splunk add-on on the computer with an internet connection” from the previous method to download the add-on file. Then continue executing the steps in this method:
1. Download the “Python for Scientific Computing (for Windows 64-bit)” add-on.
2. Once the download completes, transfer this file to your Windows computer that hosts the Splunk Enterprise server.
3. Unarchive the downloaded archive using a tool like WinRar. Right-click the archived file and choose “Extract Here.”
4. Locate the Extracted Folder. Post extraction, identify the resultant folder:
Splunk_SA_Scientific_Python_windows_x86_64
5. Navigate to the “apps” directory of your Splunk installation, typically located at:
C:\Program Files\Splunk\etc\apps
6: Move the extracted folder into the apps directory, resulting in the following path:
C:\Program Files\Splunk\etc\apps\Splunk_SA_Scientific_Python_windows_x86_64
7. To apply the changes, you need to restart Splunk.
8. After restarting, log in to the Splunk web console.
9. choose [Apps] and then [Manage Apps] from the top menu.
10. Finally, check that the “Python for Scientific Computing” add-on is in the installed apps list and visible in the [Apps] menu. Successful visibility confirms a successful installation. If the add-on is absent, try repeating the process or contact Splunk support for further assistance.