Где скачать и как установить Debugging Tools for Windows
Решение написать данный пост появилось из-за того, что разобраться в том, где скачать Debugging Tools for Windows, не так то просто.
Так как следующую статью планируется написать на тему анализа дампов, то необходимо было облегчить для нашего читателя задачу скачивания и установки необходимого для анализа инструментария. В данном случае это только официальный отладчик Debugging Tools for Windows.
Как скачать и установить отладчик WinDbg?
Отладчик Debugging Tools for Windows содержится в пакете SDK (от англ. software development kit). SDK (от англ. software development kit) — набор средств разработки, который позволяет специалистам по программному обеспечению создавать приложения для определённого пакета программ, программного обеспечения базовых средств разработки, аппаратной платформы, компьютерной системы, игровых консолей, операционных систем и прочих платформ.
Источник: WikipediaПри скачивании пакета можно выбрать только нужный вам софт отцепив всё лишнее.
Скачиваем пакет SDK.
Для каждой версии Windows имеется своя версия пакета SDK. Скачать загрузчик для скачивания пакета SDK Windows 10 можно по этой ссылке. Для остальных версий Windows загрузчик можно скачать на странице архивов Microsoft. Самая старая версия ОС здесь — Windows 7.
Про иные способы скачивания пакета можете почитать на этой странице (если конечно владеете английским языком 🙂 )
Устанавливаем Debugging Tools for Windows из пакета SDK на Windows 10.
Нажав на ссылку Скачать программу установки > вы получите файл загрузчика пакета SDK — winsdksetup.exe.
- Запустите файл загрузчика winsdksetup.exe.
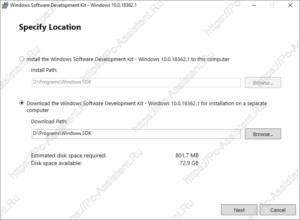
- Загрузчик предложит 2 способа доставки пакета. В первом случае (Install the Windows SDK to this computer — в переводе: Установите Windows SDK на этот компьютер) выбранный софт из пакета SDK сразу устанавливается в систему. Во втором (Download the Windows SDK for installation on a separate computer — в переводе Загрузите Windows SDK для установки на отдельный компьютер) дистрибутивы для установки выбранного софта будут скачаны в указанную вами папку.
 Здесь рекомендую вам выбрать второй вариант, так как скачанный отладчик, можно будет потом установить и на любой другой компьютер. Тут же рекомендую сменить папку куда будет загружен пакет.
 - На следующем шаге вас спросят разрешения отправить анонимную информацию об установке на серверы Microsoft или нет. Здесь выбирать вам
- Далее необходимо выбрать, что вы хотите установить из списка программ. Чтоб не устанавливать лишние программы снимаем все галочки и оставляем только одну Debugging Tools for Windows и жмем кнопку Download.
 Здесь рекомендую вам выбрать второй вариант, так как скачанный отладчик, можно будет потом установить и на любой другой компьютер. Тут же рекомендую сменить папку куда будет загружен пакет.
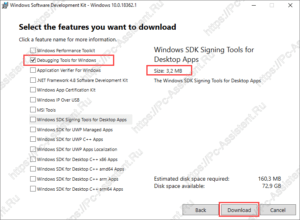
Будет загружена папка Installers, где находим файлы:
► X64 Debuggers And Tools-x86_en-us
► X64 Debuggers And Tools-x64_en-us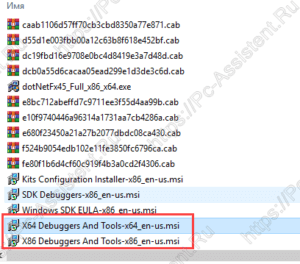
Прежде чем начать установку узнайте разрядность операционной системы и затем уже выберите правильную версию.
Запустив файл установки нужной версии, останется чуток подождать и Debugging Tools for Windows будет установлен. Запустить его можно через кнопку Пуск.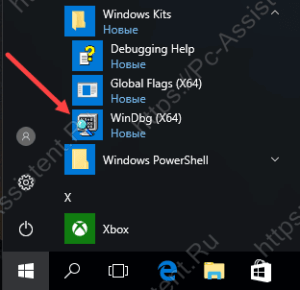
Теперь, когда вы знаете где скачать отладчик, можно смело приступать к анализу файла дампа. Об этом как раз и будет следующая статья на сайте.
Если вам понравилась эта статья, то пожалуйста, оцените её и поделитесь ею со своими друзьями на своей странице в социальной сети.

 (4 оценок, среднее: 4,75 из 5)
![]() Загрузка…
Загрузка…
С помощью программы пользователи могут выполнять отладку приложений и анализировать причины системных сбоев. Доступна возможность создавать сценарии на JavaScript.
Дата обновления:
14.12.2020
Разработчик:
Microsoft Corporation
Версия Windows:
Windows 10
WinDbg – приложение для Windows, позволяющее выполнять отладку программ, драйверов и системных компонентов. Утилита предназначена для разработчиков и позволяет найти ошибки, возникающие в ходе выполнения программного кода. Пользователи могут создавать сценарии для автоматизации процесса. Также поддерживается работа с виртуальными машинами VMware и VirtualBox.
Анализ
Программа позволяет найти причину ошибки, возникшей при запуске или в процессе работы определенного приложения. Для этого необходимо загрузить дамп памяти, созданный операционной системой. Далее утилита выполнит его анализ и отобразит на экране причину сбоя.
Есть возможность запускать скрипты для более глубокого анализа отдельных компонентов. Также программа позволяет увидеть цепочку вызовов потока, в которой отражены все стадии выполнения приложения.
Отладка
Еще одной функцией отладчика является тестирование программного кода с целью поиска ошибок. Поддерживается режим Time travel debugging, суть которого заключается в том, что пользователи могут прерывать процесс выполнения и отслеживать текущее состояние программы. Есть возможность изменить исходный код на основе полученной информации.
Утилита позволяет загружать DLL библиотеки, которые требуется для отладки определенных сценариев.
Особенности
- приложение можно скачать и использовать бесплатно;
- утилита представляет собой отладчик, позволяющий найти ошибки в программном коде;
- есть возможность анализировать дампы памяти;
- пользователи могут загружать динамически подключаемые библиотеки;
- доступна функция создания скриптов;
- программа совместима с актуальными версиями Windows.
121,1 Мб (скачиваний: 1289)
![]() Xiaomi Kite
Xiaomi Kite
Windows XP, Windows Vista, Windows 7, Windows 8, Windows 8.1, Windows 10 Бесплатно
Приложение разработано специально для геймеров и позволяет оценить производительность смартфона в играх. Есть возможность отслеживать температуру и частоту кадров.
ver 1.5.5
![]() PingPlotter
PingPlotter
Windows 7, Windows 8, Windows 8.1, Windows 10 Бесплатная
С помощью приложения можно определить доступность сетевого узла и выполнить трассировку. Результаты диагностики отображаются в виде наглядных диаграмм.
ver 5.19.2.8428
![]() WhoCrashed
WhoCrashed
Windows XP, Windows Vista, Windows 7, Windows 8, Windows 8.1, Windows 10 Бесплатная
Приложение используется в качестве инструмента для диагностики операционной системы. С помощью утилиты пользователи могут найти ошибки в работе драйверов.
ver 6.70
![]() WinMTR
WinMTR
Windows XP, Windows Vista, Windows 7, Windows 8, Windows 8.1, Windows 10 Бесплатная
С помощью утилиты можно определить маршрут, по которому передаются сетевые пакеты до исследуемого узла. Доступна информация о задержках и потерях данных.
ver 1.00
![]() Files Inspector
Files Inspector
Windows Vista, Windows 7, Windows 8, Windows 8.1, Windows 10 Бесплатная
Утилита представляет собой анализатор файлов и папок. С ее помощью пользователи могут освободить место на жестком диске, удалив ненужные данные и приложения.
ver 3.01
![]() RAMMap
RAMMap
Windows Vista, Windows 7, Windows 8, Windows 8.1, Windows 10 Бесплатная
С помощью программы пользователи могут узнать, какое количество оперативной памяти потребляют запущенные процессы. Доступен полный список активных служб.
ver 1.60
![]() SecurAble
SecurAble
Windows XP, Windows Vista, Windows 7, Windows 8, Windows 8.1, Windows 10 Бесплатная
Приложение предназначено для проверки возможностей центрального процессора. С помощью утилиты можно определить наличие поддержки аппаратной виртуализации.
ver 1.0.2570.1
![]() WizTree
WizTree
Windows XP, Windows Vista, Windows 7, Windows 8, Windows 8.1, Windows 10 Бесплатная
Утилита предназначена для анализа структуры папок и файлов, хранящихся на жестких дисках. С помощью программы можно найти данные, занимающие много места.
ver 3.37
![]() MSI Afterburner 4.6.5
MSI Afterburner 4.6.5
MSI Afterburner — настоящая находка для истинного оверклокера, с помощью которой можно…
![]() SpeedFan 4.52
SpeedFan 4.52
SpeedFan — бесплатный и удобный в использовании инструмент для контроля за температурой и…
![]() Speccy 1.32.803
Speccy 1.32.803
Speccy — небольшая бесплатная программа, позволяющая узнать массу полезной информации об…
![]() BlueScreenView 1.55
BlueScreenView 1.55
BlueScreenView — небольшая бесплатная утилита, которая сканирует все файлы аварийных дампов…
![]() FPS Monitor 5440
FPS Monitor 5440
Приложение отслеживает состояние компонентов ПК и отображает информацию поверх экрана…
Having an optimal PC is important to extend its lifespan
by Ivan Jenic
Passionate about all elements related to Windows and combined with his innate curiosity, Ivan has delved deep into understanding this operating system, with a specialization in drivers and… read more
Updated on
- Windows is a very complex OS, so you may need to do debugging often.
- That is where debugging software can come in handy, and we will list some of the best below.
This guide brings you a compilation of the best debugging software for Windows. So, if you own a Windows PC and need debugging software, this piece will inform you adequately on the most suitable one.
Debugging is the process of searching for and fixing errors or other problems to avoid improper execution of a piece of software or an entire system.
- If you wonder how to debug a computer, first access the link of the software provided by us below, then hit the Download button.
- Then double-click the downloaded file in order to install it. That’s it!
So now, let us introduce you to some great options:
- Fortect– Best debugging software overall
- WinDbg – Specialized in Windows debugging
- Visual Studio Debugger – Robust debugging features
- OllyDbg – Best for 32-bit Windows
- GNU Debugger – Great portable debugger
- Syser Debugger – Top kerdel-mode debugger
What is the best debug software for Windows?
- How do I install debug tools on Windows 10?
- What is the best debug software for Windows?
- Fortect — Best debugging software overall
- WinDbg — Specialized in Windows debugging
- Visual Studio Debugger — Robust debugging features
- OllyDbg — Best for 32-bit Windows
- GNU Debugger — Great portable debugger
- Syser Debugger — Top kerdel-mode debugger
- What are debugger tools?
Fortect – Best debugging software overall
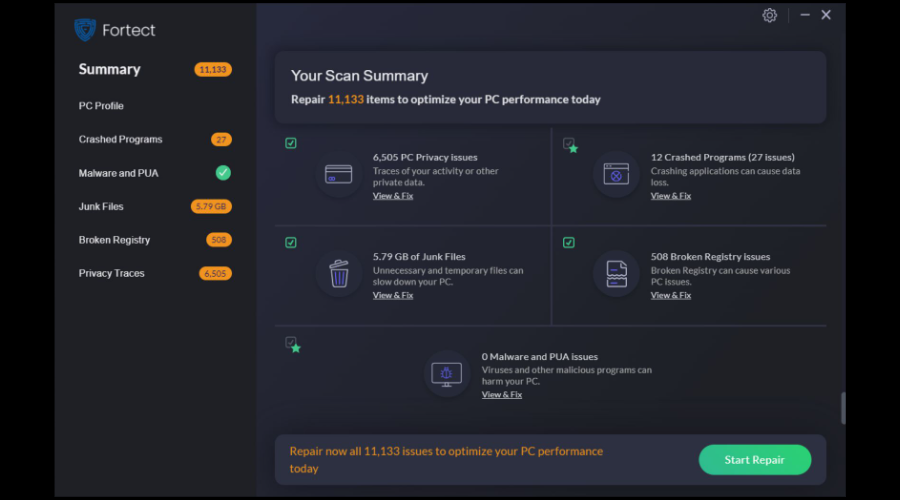
Debugging and fixing some common issues in Windows 10 involves cleaning and fixing damaged system files, registries, and DLL.
Fortect is an excellent alternative when dealing with such issues. While other third-party tools may do a similar job, Fortect has proven to be the most efficient among them.
It features a lightweight UI, and the debugging process is quite automated. Therefore, you don’t have to click too many buttons or configure too many settings to get your PC to a pristine condition.
Finally, not only will it clean your registries, but it will also clean and fix your DLLs and remove the damage caused by malware, all within a single scan spanning a couple of minutes.
Important features:
- Repairing virus damage
- Hardware repair
- Finding stability issues
- Junk cleaning

Fortect
Third-party tools may not seem like the go-to solution in this case, but Fortect can get the job done right.
WinDbg – Specialized in Windows debugging
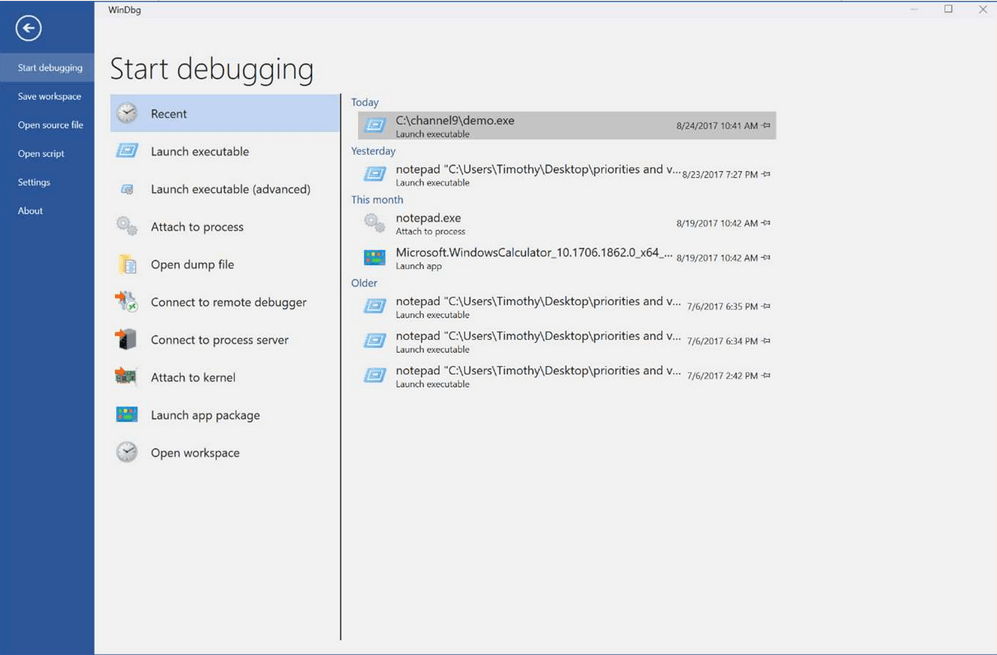
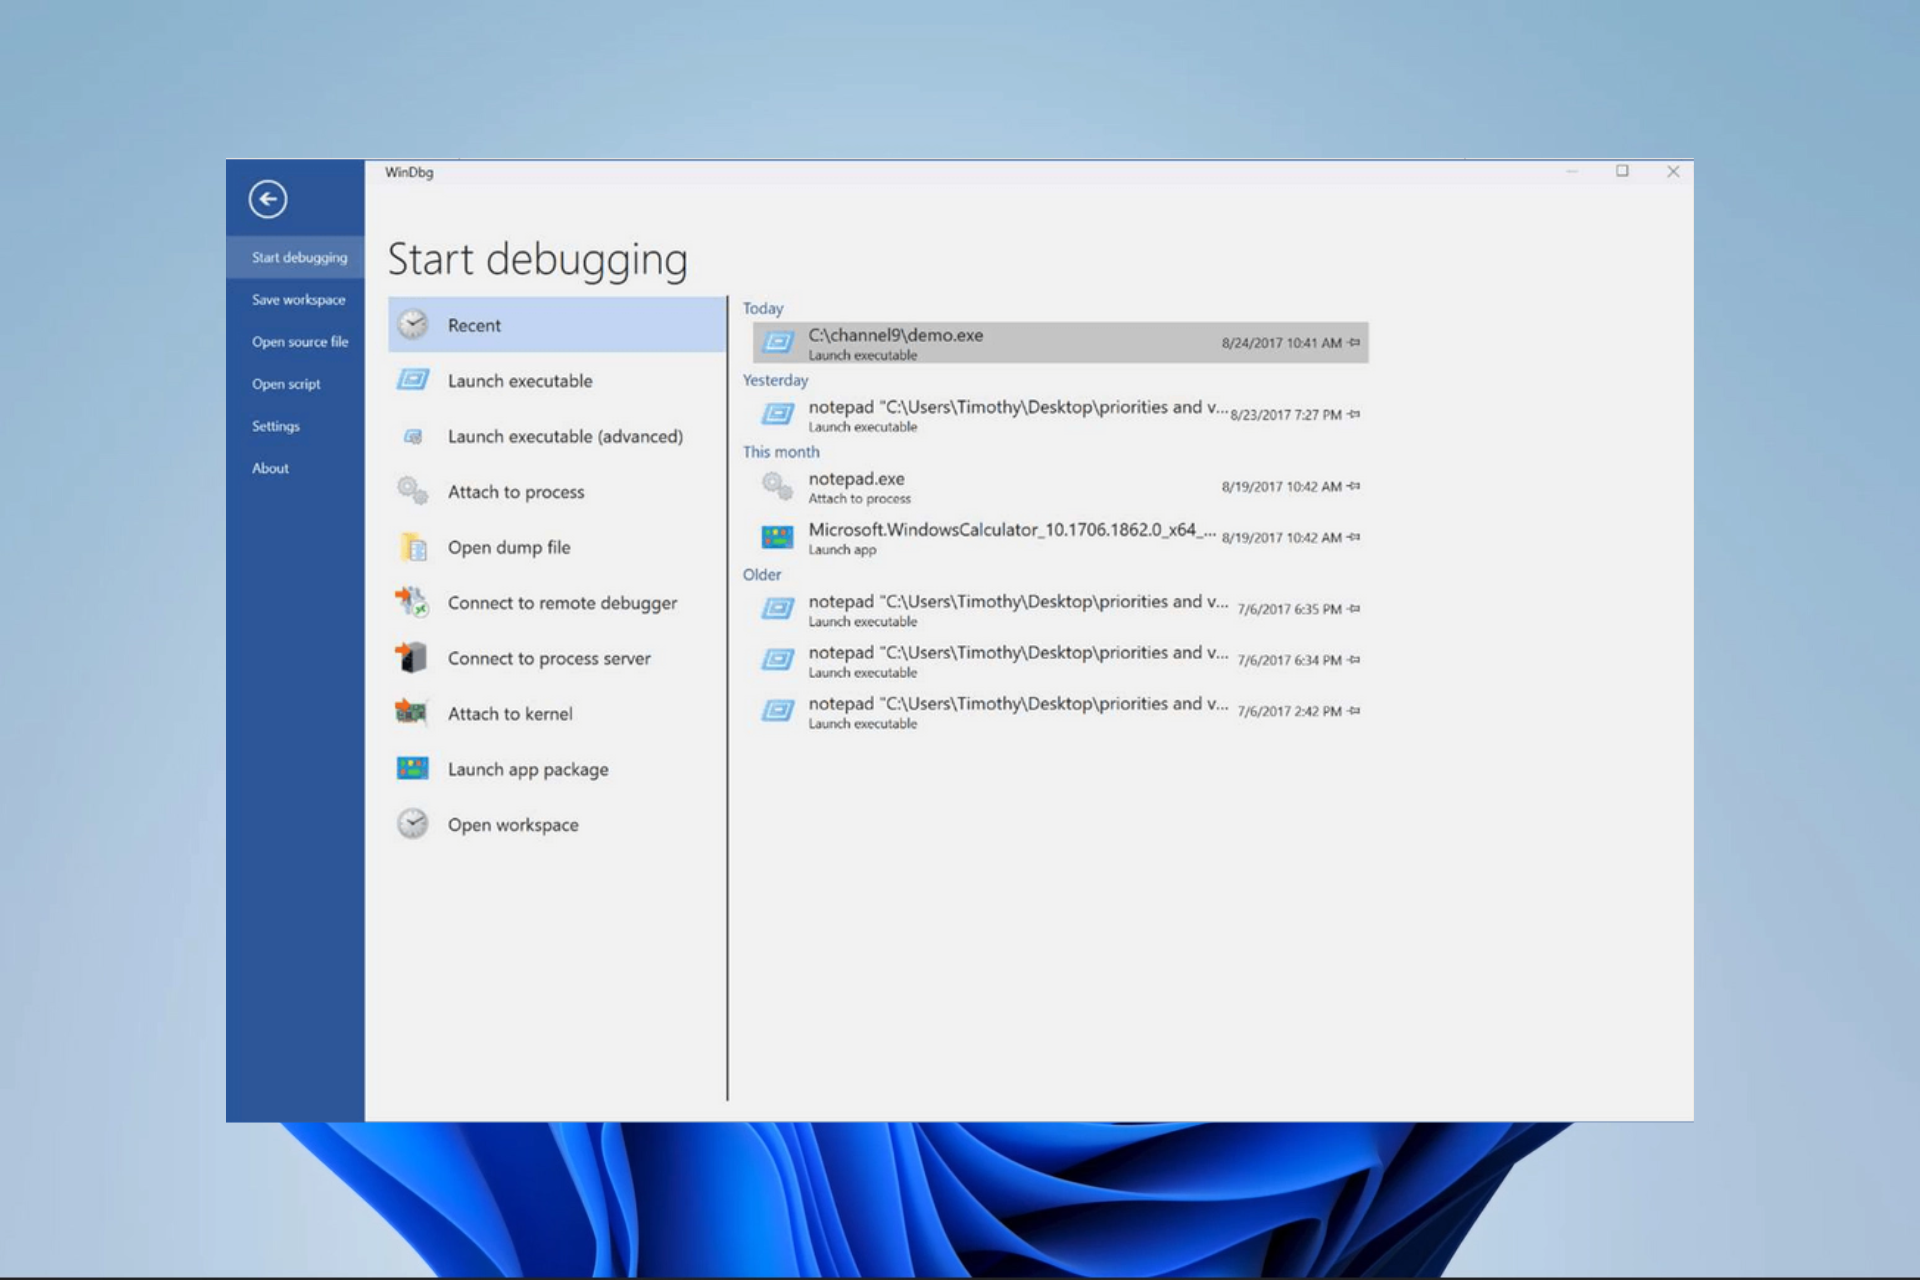
Windows Debugger (WinDbg) is the standard debugging software for Windows. It is the official debugging tool from Windows’ developer – Microsoft. The software requires two interlinked computer systems to function at optimum capacity.
WinDbg can debug Windows OS (in kernel mode) and applications (in user mode). It also can analyze crash dumps and examine processor registers. The software is the ultimate tool for fixing any form of bug attack on a Windows PC.
Furthermore, Windows Debugger (WinDbg) supports operating systems on virtual engines. To do this, you need a durable VirtualCOM port to facilitate debugging of operating systems on virtual machines.
At times, debugging (via WinDbg) could be faster on virtual engines (especially VMWare) than on the original OS.
How we test, review and rate?
We have worked for the past 6 months on building a new review system on how we produce content. Using it, we have subsequently redone most of our articles to provide actual hands-on expertise on the guides we made.
For more details you can read how we test, review, and rate at WindowsReport.
Important features:
- Automatic processor detection engine
- Integrated TTD (Time Travel Debugging)
- Single-Click app debugging
- Command windows
- Powerful GUI
⇒ Get WinDbg
Visual Studio Debugger – Robust debugging features
Visual Studio is another top-rated debugging software from Microsoft. Just like WinDbg, Visual Studio Debugger hosts exclusive support for Windows PC. Additionally, it comes preinstalled on all versions of Visual Studio, an IDE (app development) program from Microsoft.
This debugger is commonly used to debug Windows apps, as it is designed to run in debugger mode i.e. it operates in sync with any app you want to debug. Furthermore, to debug an app, you need to set the breakpoints, and you can start debugging.
Visual Studio is similar to WinDbg in terms of ease of usage and operability. However, unlike WinDbg, it cannot run kernel-mode coding (to debug a Windows OS).
As such, its functionality makes it excellent for debugging system programs and installed applications.
Important features:
- CodeView
- Symbol & Source Integration
- Remote debugging,
- Edit & Continue (live configuration)
⇒ Get Visual Studio Debugger
OllyDbg – Best for 32-bit Windows
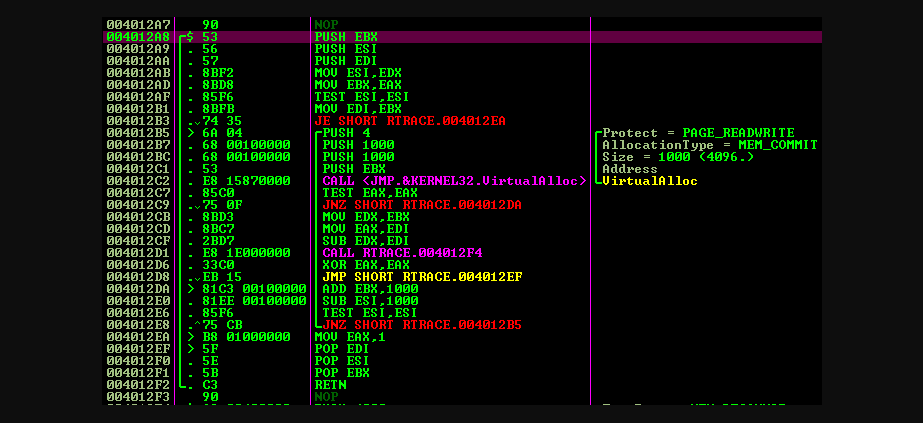
OllyDbg is another top-rated x86 debugging software specially designed for all 32-bit Microsoft Windows NT versions. It is reverse engineering software that is often used to crack systems and install apps on Windows PCs.
OllyDbg is optimized to run binary analysis, in contrast to the conventional coding setup. Furthermore, it hosts an intuitive UI whose functions can easily be extended by plug-ins.
Additionally, it comes with Open architecture, a customizable/extensible platform, unicode support, and a customizable disassembler.
Lastly, OllyDbg is freeware, which means it is available for free download. However, there is an advanced version, which requires a paid license.
Important features:
- Software cracking
- Real-time editing (of bitcode)
- Malware and code analysis
- DLLs debugging
⇒ Get OllyDbg
GNU Debugger – Great portable debugger
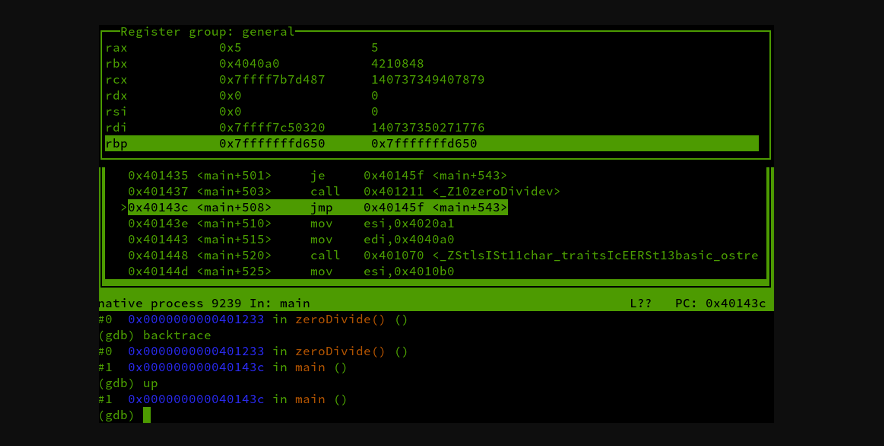
GNU Debugger, GDB, is one of the best debugging software for Windows. It is a portable computer debugger that operates on multiple programming languages.
Additionally, it hosts cross-compatible support for Windows and Unix-like (multipurpose) operating systems.
GDB is program-specific, designed to identify, modify, suspend, terminate, and fix bugs on a specific application hosted on a PC. Essentially, it can examine a target application’s operational behavior, revealing all inherent elements that could cause damage.
This tool offers Python scripting support, Memory leak detectors, Watchpoints, Breakpoints, and Debugging registers.
Lastly, GDB is licensed under the GNU’s General Public License (GPL), which means it is available free of charge.
Important features:
- 12+ programming language support
- Remote debugging
- Reversible debugging
- Multi-CPU support
⇒ Get GDB Free
- GitHub Copilot for Business: How to Set Up & Use
- 8 Best Ethernet Cable Tester Tools [Hardware & Software]
- Fix: DTS Audio Processing Settings are Unavailable
- OS Imaging & Deployment Software: 5 Best Picks for 2023
- Windows Software Development Kit: Everything You Need to Know
Syser Debugger – Top kerdel-mode debugger
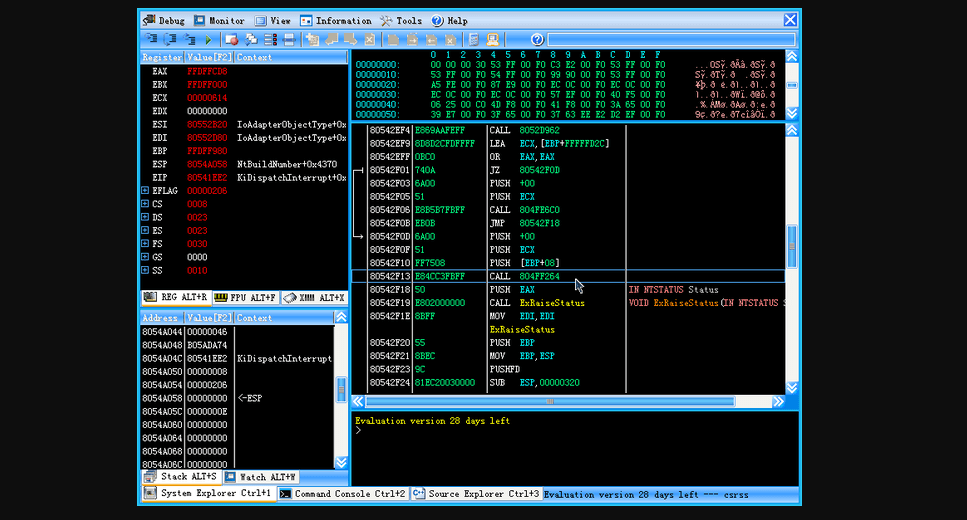
Syser Debugger is a kernel-mode debugger that serves as an operating system analyzer and a driver developer for Windows computer systems. It stands out as one of the best debugging software for Windows.
The software is a 32-bit x86 debugger for Windows NT operating systems. Additionally, it is great for monitoring all Windows commands at any point in time, and it aptly detects bugs at an early stage.
Additionally, it is durable enough to run on virtual engines like VMWare without worrying about system crashes.
Lastly, Syser Debugger’s service license fee is $198.00.
Important features:
- Source code & assembly debugging
- Color disassembly
- Syntax coloring
- Multi-CPU support
⇒ Get Syser Kernel Debugger
What are debugger tools?
A debugger app is a tool that can aid in software development by spotting code problems at different stages of creating an OS or an application. Some debuggers examine a test run to determine which lines of code were skipped.
You should note that debugging software may come in various forms, including:
- Resource monitor tools – These tools may diagnose performance issues and monitor PC resource use.
- Web debugging tools – These may be cross-browser testing tools in some cases.
- Specific language debugging tools – For example, there are debugging tools for c++, Java, C#, etc.
- Native OS debuggers – In Windows 10, for example, users may use the built-in WinDbg to debug both kernel-mode and user-mode code, as well as study crash dumps and look into the registers of the CPU while the code is running.
Debugging is an essential computer process that facilitates the swift identification and repair (or removal) of various forms of bugs on computer systems.
Numerous debugging software exists, many of which are either substandard or incompatible with Windows.
Therefore, this article has compiled a list of Windows’s best debugging software to inform better your decision on which one to employ.
![]()
Microsoft.WinDbg, Release version: 1.2306.12001.0
Command Line
Download Links For Version 1.2306.12001.0
Info
last updated 7/2/2023 9:04:52 PM
Publisher:
License:
Dependencies
No dependency information