Время на прочтение
6 мин
Количество просмотров 43K
Задача по централизованой обработке логов достаточно просто формулируется и возникает, когда требуется отслеживать работу большого количества серверов. Думаю, не стоит упоминать о том, что из логов можно получать массу информации о жизнедеятельности и самочувствии систем. О том, что писать и читать логи столь же важно как и уметь писать программы.
Соответственно для реализации такой системы перед администратором ставятся задачи: во-первых, каким образом эти логи собирать, во-вторых, каким образом с ними удобно и централизованно работать. Благодаря достаточно развитой связке ELK (Elasticsearch + Logstash + Kibana), уже не раз описанной на Хабре, у администратора имеются инструменты для удобного поиска и отображения всей присутствующей в логах информации. Поэтому ответ на вторую задачу имеется изначально, и остается лишь решить задачу по сбору логов.
Так как в моем случае требованием к системе было отсутствие клиента на серверах, и то, что логи требовалось вытаскивать с Windows-серверов, то в качестве инструмента сбора был выбран родной для Windows — powershell.
Исходя из этого была составлена следующая модель сбора и отображения информации из логов: логи удаленно собираются с серверов powershell-скриптом, после чего складываются в виде файлов на хранилище, далее средствами ELK (Elasticsearch + Logstash + Kibana) происходит их обработка и отображение.
Пример работы всей связки представлен на изображении:

Упреждая критику, опишу, что данная система не ставит задачи сбора логов в реалтайме, целью является лишь статистика, которая собирается за определенный промежуток времени, а затем отображается на dashboard-е. Применяется она с целью прийти с утра, посмотреть как себя вели сервера ночью, и сравнить с результатами, полученными, допустим, на прошлой неделе. В предлагаемой системе логи собираются раз в час, соответственно, отставание между текущими логами и тем, что выводятся (если быть точным, отображаются и выводятся по запросу) на dashboard-е может составлять порядка часа.
В настоящий момент в powershell имеется два способа получения логов с удаленного компьютера:
- родная команда powershell: Get-EventLog -ComputerName $computer –LogName System
- получение логов через WMI-запрос: Get-WmiObject -Class win32_NTLogEvent -filter «logfile = ‘System’» -ComputerName $computer
Но в первом случае происходит полное перекачивание файла с event-логами системы и лишь затем осуществляется их обработка на компьютере, где выполняется скрипт. Как следствие, такие запросы обрабатываются неоправданно долго. Возможность выборки логов (например, лишь за последние сутки) здесь не особо отрабатывает, так как изначально вытаскивается весь файл и лишь затем с ним ведется какая-то работа.
Во втором случае серверу отсылается WMI запрос, обработка происходит на стороне сервера и ключевой момент здесь в том, что появляется возможность ограничить промежуток интересующих нас логов уже на этапе запроса (в приведенном ниже примере промежуток выставлен в 1 час). Так как данная комманда отрабатывает намного быстрее первой, а время выполнения запроса напрямую зависит от запрашиваемого промежутка логов, то выбар пал на Get-WmiObject.
В представленном ниже скрипте имеются несколько неочевидных и сложных моментов:
Сначала описана логика по ограничению промежутка времени для выборки логов, когда требуются логи за последний час, но за час не с момента запроса, а за последний полный час, т.е. начиная с 00 мин. и заканчивая 59 мин.
Второй момент — то, что время в формате WMI отличается от привычного формата, поэтому постоянно требуется конвертация в WMI формат времени и обратно.
ServersEventLogs.ps1
Clear-Host

# импортируем список серверов из Active Directory (для этого в powershell должен быть дополнительно установлен модуль для Active Directory)
import-module activedirectory
$computers = Get-ADComputer -SearchBase "OU=Servers,DC=domain,DC=ru" -Filter * | ForEach-Object {$_.Name} | Sort-Object

# определяем директорию для логирования
$logdir = "\\storage\Logs\ServersLog\" + $(Get-Date -UFormat "%Y_%m")
# если директория отсутствует, то создаем
if((Test-Path $logdir) -eq 0) {
	New-Item -ItemType directory $logdir -Force
}

# указываем данные пользователя под которым будут выполнятся команды
$domain = "domain"
$username = "username"
$password = 'password'

$account = "$domain"+"\"+$($username)
$accountpwd = ConvertTo-SecureString $password -AsPlainText -Force
$credential = New-Object System.Management.Automation.PsCredential($account, $accountpwd)

# для того, чтобы делать выгрузку за предыдущий час, нужно ограничить время за которое лог был сформирован следующим образом: верхний предел - минус час, нижний предел - начало текущего часа.
# получается примерно следующее:
# BiginDate = 08/26/2014 12:00:00
# EndDate = 08/26/2014 13:00:00
# в результате будет выгружен лог созданый в пределах от BiginDate = 08/26/2014 12:00:00 до EndDate = 08/26/2014 13:00:00

$date = Get-Date
Write-Host "Date = $date"
$m = $date.Minute
$s = $date.Second
$begindate = (($date.AddSeconds(-$s)).AddMinutes(-$m)).addHours(-1)
Write-Host "BiginDate = $begindate"
$enddate = ($date.AddSeconds(-$s)).AddMinutes(-$m)
Write-Host "EndDate = $enddate"

# перевод времени в формат WMI
$wmibegindate=[System.Management.ManagementDateTimeConverter]::ToDMTFDateTime($begindate)
Write-Host "WMIBiginDate = $wmibegindate"
$wmienddate=[System.Management.ManagementDateTimeConverter]::ToDMTFDateTime($enddate)
Write-Host "WMIEndDate = $wmienddate"

$logjournals = "System", "Application", "Security"

foreach ($computer in $computers) {
	Write-Host "Processing computer: $computer"
	foreach ($logjournal in $logjournals) {
		Write-Host "Processing log: $logjournal"
		$systemlog = Get-WmiObject -Class win32_NTLogEvent -filter "logfile = '$logjournal' AND (TimeWritten>='$wmibegindate') AND (TimeWritten<'$wmienddate')" -computerName $computer -Credential $credential -ErrorAction SilentlyContinue

        foreach ($logstring in $systemlog) {
			$wmitime = $logstring.TimeGenerated
			$time = [System.Management.ManagementDateTimeconverter]::ToDateTime("$wmitime")
			#Write-Host $logtime

			$level = $logstring.Type
			#Write-Host "$level"

			$journal = $logstring.LogFile
			#Write-Host "$journal"

			$category = $logstring.CategoryString
			#Write-Host "$category"

			$source = $logstring.SourceName
			#Write-Host "$source"

			$message = $logstring.Message
			#Write-Host "$message"

			$code = $logstring.EventCode
			#Write-Host "$code"

            @{Server="$computer";Time="$time";Level="$level";Journal="$journal";Category="$category";Source="$source";Message="$message";Code="$code"} | ConvertTo-Json -depth 10 -Compress | Out-File "$logdir\$computer-$logjournal.json" -Encoding utf8 -Append
		}
	}
}
По завершении действия скрипта на выходе получаются файлы вида: ComputerName-JournalName.json.
Формат json несколько не соответствует стандарту (отсутствуют открывающие и закрывающие скобки), но парсер Logstash его нормально переваривает и обрабатывает. Для каждого из серверов создается по три файла: ComputerName-System.json ComputerName-Application.json ComputerName-Security.json Так как файлы имеют одинаковый формат, их обработка идеентична.
Ограничить сбор логов определенным журналом можно простым редактированием строчки: $logjournals = «System», «Application», «Security»
Далее в дело вступает Logstash со следующей конфигурацией:
ServersEventLogs.conf
input {

  file {
    type => "ServersLogs"
    discover_interval => 1800
    path => [ "//storage/Logs/ServersLog/*/*.json" ]
    codec => "json"
  }

}


filter {

  date {
    type => "ServersLogs"
    match => [ "Time", "MM/dd/YYYY HH:mm:ss" ]
    locale => "en"
    target => "Logtimestamp"
  }

  mutate {
    gsub => [ "Level", "[ -]", "_" ]
    gsub => [ "Source", "[ -]", "_" ]
    gsub => [ "Server", "[ -]", "_" ]
    remove_field => ["message"]
    remove_field => ["host"]
  }

}


output {

  elasticsearch {
    embedded => false
    host => "logserver"
    protocol => "http"
    cluster => "windowseventlogs"
    codec => "plain"
    index => "windowseventlogs-%{+YYYY.MM.dd}"
  }

}
Данные заносятся в Elasticsearch, откуда в дальнейшем отображаются с помощью Kibana.
В результате на экран выводится информация (в моем случае за последние 2 суток): о самых проблемных серверах, о самых проблемных сервисах; рисуется график, по которому сразу можно увидеть увеличение количества логов или ошибок в определенный момент времени. Всегда можно выполнить поиск по тексту ошибки или имени пользователя, либо произвести сортировку по уровню или id ошибки.
Are you looking for a step-by-step guide on how to configure a syslog server in Windows? If yes, you have come to the right place! In this article, we will walk you through the process of configuring a syslog server in Windows. We will discuss the benefits of using a syslog server, how to set up the server and the configuration settings that are needed for successful deployment. By the end of this article, you will be able to set up and configure your own syslog server in Windows with ease. So let’s get started!
Steps to Configure Syslog Server in Windows:
- Open the Start Menu and search for Event Viewer. In the search results, click on the Event Viewer result.
- In the Event Viewer, expand the Windows Logs option on the left side.
- Right-click on the Application option and select Properties.
- In the Application Properties window, select the General tab.
- In the General tab, under the Logging option, select the Syslog option.
- Now, enter the Syslog server details like IP Address and Port Number.
- After entering all the details, click on the OK button.
Your Syslog Server has been successfully configured in Windows.
Configuring a Syslog Server in Windows
Syslog is a protocol used to send log messages across the network to a centralized server. Configuring a syslog server in Windows can be done using either a third-party syslog agent or the built-in Windows Event Collector service. In this article, we will discuss how to configure a syslog server in Windows using both methods.
Using a Third-Party Syslog Agent
The first step in configuring a syslog server in Windows is to install a third-party syslog agent. There are a number of different syslog agents available, but the most popular ones are syslog-ng and rsyslog. After installing the syslog agent, you need to configure it to listen for incoming syslog messages. This can be done by editing the configuration file for the syslog agent.
Once the syslog agent is configured to listen for incoming messages, you can start sending syslog messages from other devices on the network. To do this, you will need to configure the devices to send their log messages to the IP address of the syslog server.
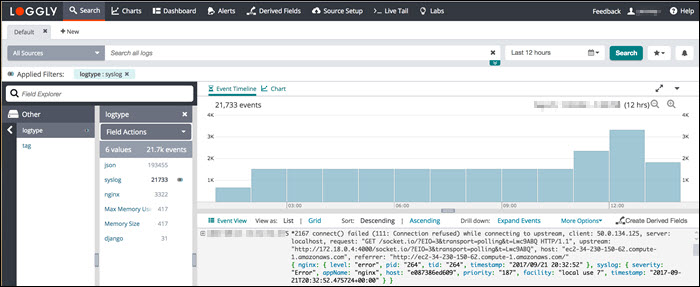
Finally, you can configure the syslog agent to forward the messages it receives to an external log server, such as Splunk or Loggly. This allows you to aggregate all of your log data in one place, making it easier to analyze and troubleshoot.
Using the Windows Event Collector Service
Another way to configure a syslog server in Windows is to use the built-in Windows Event Collector service. This service is included in Windows Server and allows you to collect log messages from other devices on the network and forward them to an external log server.
The first step in configuring the Windows Event Collector service is to enable it on the server. This can be done by using the Services applet in the Control Panel. Once the service is enabled, you can configure it to listen for incoming syslog messages.
Setting Up the Listener
Next, you will need to set up the listener to receive the messages. This can be done by creating a new event subscription in the Windows Event Collector console. Once the subscription is created, you can configure it to specify what types of messages you want to receive and which log server you want to forward them to.
Configuring the Network Devices
Finally, you will need to configure the network devices to send their log messages to the Windows Event Collector service. This can be done by editing the configuration file for each device and specifying the IP address of the Windows Event Collector service as the destination for log messages.
Conclusion
Configuring a syslog server in Windows can be done using either a third-party syslog agent or the built-in Windows Event Collector service. By using either of these methods, you can easily centralize your log data and make it easier to analyze and troubleshoot.
Top 6 Frequently Asked Questions
What is a Syslog Server?
A syslog server is a type of logging server used to collect and store logging information from multiple sources. It is typically used to collect system logs from computers, routers and other network devices, as well as from applications and services running on the network. The syslog server then stores the log data in a central location for easy access and analysis.
What are the Benefits of Configuring a Syslog Server in Windows?
The main benefit of configuring a syslog server in Windows is to centralize log data from multiple sources into one place. This makes it easier to monitor and troubleshoot issues that may arise. In addition, syslog data can be used to generate reports and dashboards, which can provide valuable insight into system performance and security.
How to Configure a Syslog Server in Windows?
Configuring a syslog server in Windows involves installing a syslog server program, configuring the server and then configuring the various network devices and applications to log to the server. First, you need to install a syslog server program such as SolarWinds Log & Event Manager, Syslog-ng, or Kiwi Syslog Server. Once these are installed, you can configure the server, including setting up the logging parameters, security settings, and log storage options. Finally, you will need to configure the various network devices and applications to log to the server.
What are the Common Logging Options for Syslog?
Common logging options for syslog include storing log messages in a text file, sending log messages to a remote server, and emailing log messages. Additionally, there are options to store log messages in a database, send log messages to a SIEM, and forward log messages to a syslog-ng instance.
What Security Measures Should be Taken When Configuring a Syslog Server?
When configuring a syslog server, there are several security measures that should be taken. These include enabling strong encryption for remote log messages, setting up authentication for logging connections, and configuring access control for log messages. Additionally, the system should be monitored for any suspicious activity, and all log data should be backed up regularly.
What are the Best Practices for Managing Syslog Data?
The best practices for managing syslog data include archiving log data regularly, setting up alerts for suspicious activity, and regularly monitoring the system for potential security issues. Additionally, it is important to keep the system up to date with the latest security patches, and to ensure that all log data is backed up regularly. Finally, log data should be analyzed regularly to ensure that any potential issues can be addressed promptly.
How to Configure Syslog Server and Forwarder for Windows Event Kiwi Syslog Server
Configuring a Syslog Server in Windows is a simple and straightforward process. By following the steps outlined in this article, you can quickly and easily configure a Syslog Server in Windows, allowing you to track, monitor, and analyze the data collected from your network environment. With the help of a Syslog Server, you can ensure that your network is running smoothly and efficiently, while also providing you with a valuable source of information.
Introduction
The syslog (system logging) protocol is used for monitoring network devices and sending log messages to a logging server (a syslog server).
The syslog server and syslog protocol work together to facilitate log tracking and management.
In this article, you will learn what a syslog server is, what it is used for, and see the best syslog servers available for Linux and Windows.
What Is a Syslog Server?
A syslog server collects syslog messages from all devices in a single location, whether it is a bare metal server, a virtual machine, or a software service. The syslog server usually consists of a syslog listener, which receives and interprets the incoming data, and a database for storing the data.
The server collects, filters, and displays the collected messages from all devices and operating systems. A syslog server can usually store the logs for a long time.
Advanced syslog servers provide automated notifications and tailored responses to detected issues — i.e., to run a script, filter and forward a message, create and deliver a report, etc.
With all the benefits and features of a syslog server, it is easy to optimize device performance and health after analyzing server data.
What Is a Syslog Server Used For?
A syslog server’s primary purpose is to collect log messages from the connected network devices and store them in a centralized location for monitoring purposes. The server keeps the logs in a consistent format, allowing users to spot performance irregularities easily.
Use a syslog server to improve network monitoring and management by inspecting network specifics and parameters. Automate actions by setting up automatic alerts about a variation in a device’s data log. Some syslog servers come with a message severity level indicator.
The benefits of using a syslog server and logging data are:
- Reduced number of alerts.
- Reduced downtime.
- Fewer business interruptions.
- Preventive troubleshooting.
Finally, syslog servers can store event logs for a long time, enabling access to historical events. Various syslog servers rotate logs and create new files periodically, thus keeping the data organized.
This section lists the most popular and feature-rich Linux and Windows syslog servers. For a comparison of supported platforms and free trial availability, refer to the table below:
| Syslog Server | Supported Platforms | Free Trial |
|---|---|---|
| Kiwi | Unix, Linux, Windows | 14 days |
| PRTG | Windows | 30 days |
| Syslog Watcher | Unix, Linux, Windows | Per request |
| The Dude | Linux, macOS, Windows | / |
| Visual Syslog Server | Unix, Linux | / |
| Datagram | Windows | Unlimited trial version |
| ManageEngine EventLog Analyzer | Linux, Windows | / |
| Icinga | Unix, Linux | / |
| GrayLog | Linux | / |
| WinSyslog | Windows | / |
| Nagios | Linux, Windows | 30 days |
| Splunkbase | Unix, Linux, Windows | 14 days |
| Progress WhatsUp Gold | Windows | 14 days |
| Logstash | Unix, Linux, Windows | 14 days |
| Loggly | Cloud-based | 30 days |
| Site24x7 | Cloud-based | 30 days |
Free Syslog Servers
The following section lists the best free syslog servers:
1. Kiwi Syslog Server
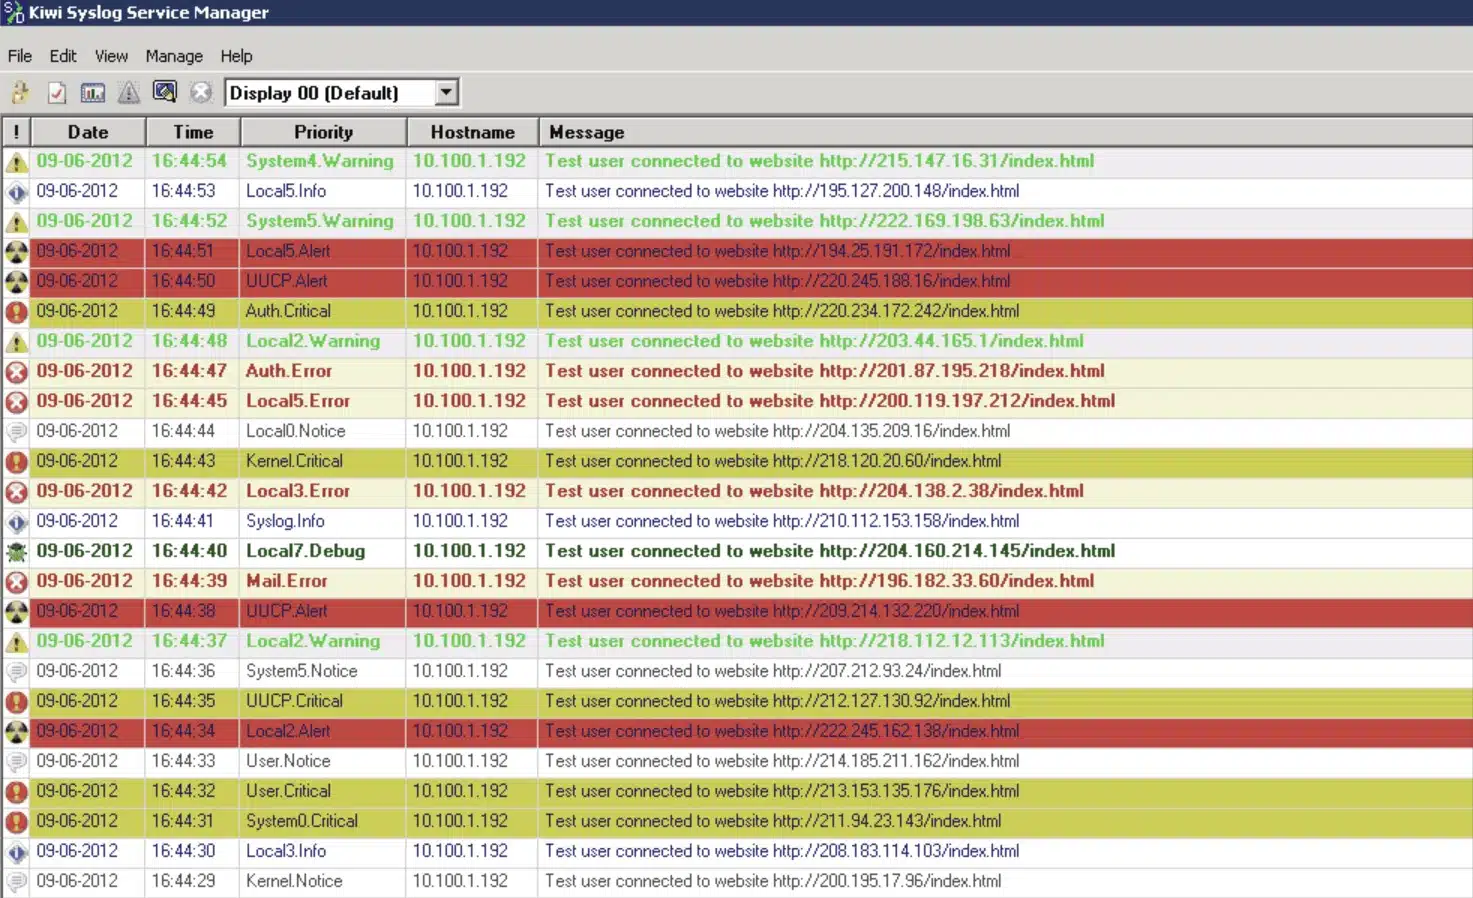
The Kiwi syslog server was created by SolarWinds. It is a comprehensive logging utility that collects syslog events and messages on Unix, Linux, and Windows and generates reports in plain text or HTML.
Kiwi’s GUI allows users to easily and efficiently manage logs in a single place. The tool can create network traffic graphics and, optionally, send daily summary emails.
The free edition collects syslog messages from up to five devices and provides an option to set up alerts for various events, including heavy traffic, login attempts, hardware failures, etc. Additionally, Kiwi offers the possibility of archiving syslog messages or forwarding them to a database. The free version comes with a trial of full functionalities lasting 14 days.
The full version costs $329 and offers automation, allowing you to set up actions that are automatically triggered by specific events and a web-based interface for remote management.
2. PRTG Syslog Server
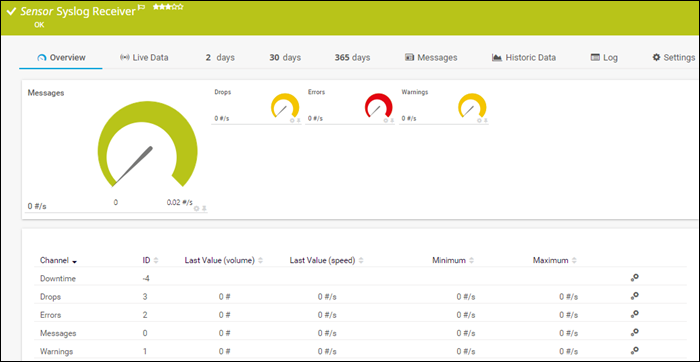
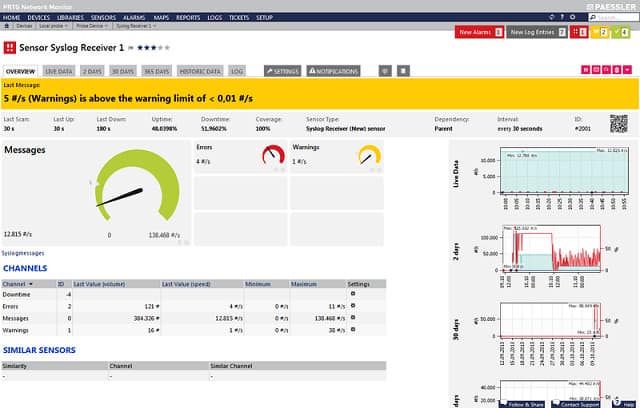
The PRTG syslog server is part of the PRTG Network Monitor application, and it is completely free for up to 100 sensors. The free trial allows users to use more sensors for 30 days but later reverts to the free version. The Syslog Receiver sensor for monitoring and analyzing network traffic doesn’t require additional software installations.
PRTG can receive and process up to 10,000 syslog messages per second from network devices and Windows environments. The number depends on the processing power, storage, and overall system configuration.
PRTG offers an intuitive web interface for viewing, analyzing, and filtering syslog messages by type, severity, etc. It also provides message categorization and further filtering to ensure only relevant messages are displayed.
The server offers automation by sending alerts triggered by errors, warnings, or a high number of messages.
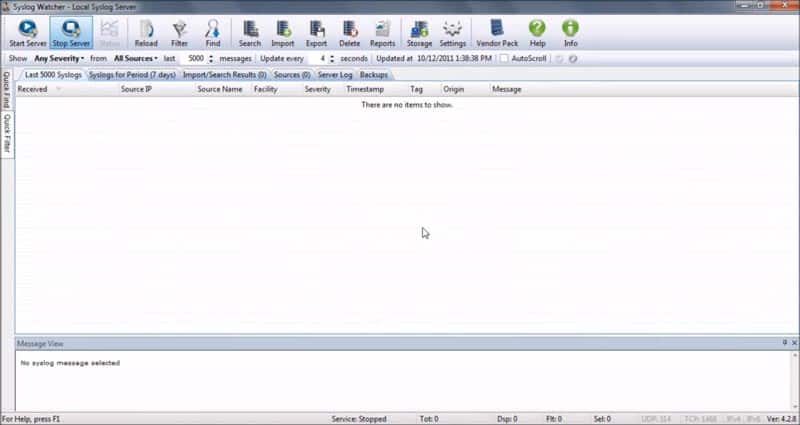
3. Syslog Watcher
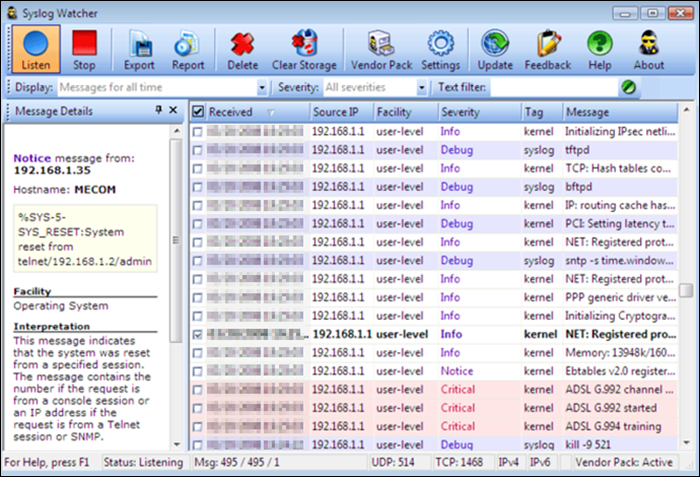
The SNMPSoft Syslog Watcher is a dedicated syslog server compatible with various devices and software that support syslog sending. The tool collects system log events from Unix, Windows or Linux servers.
The free version allows syslog message collection from five sources, while the professional version supports an unlimited number of sources. Depending on the configuration, Syslog Watcher can handle up to 5,000 syslog messages per second.
Syslog Watcher can collect messages over UDP and TCP and supports IPv4 and IPv6 networks. The utility also enables automation by sending email alerts for specific errors, events, or messages.
Message filtering, storing, and customization depend on filters, the message severity level, and the rules set by the user. Syslog Watcher also offers exporting messages to a database, manually or automatically.
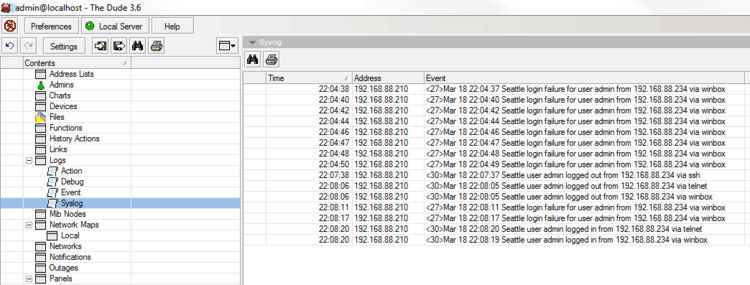
4. The Dude
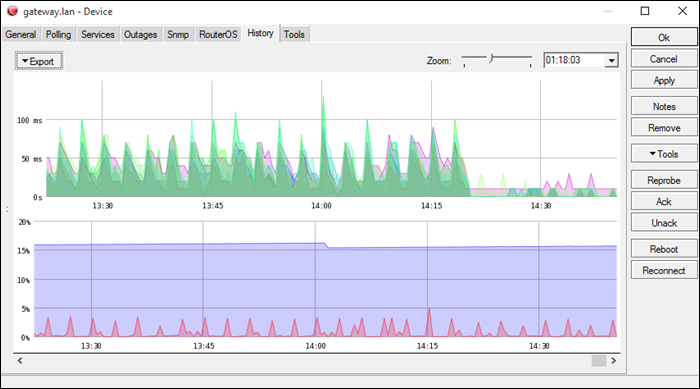
The Dude is a network management application developed by MicroTik, with a free built-in syslog server. The application offers general network management, while the syslog server captures syslog messages from your devices.
The Dude supports remote logging via RouterOS. It is compatible with Windows-based systems, while on Linux or macOS, it runs using Wine/Darwine.
The server automates maintenance by allowing users to create alerts for specific syslog events or messages and filters.
It includes an auto-discovery feature, automatically mapping nearby devices on the network, which facilitates network building.
5. Visual Syslog Server
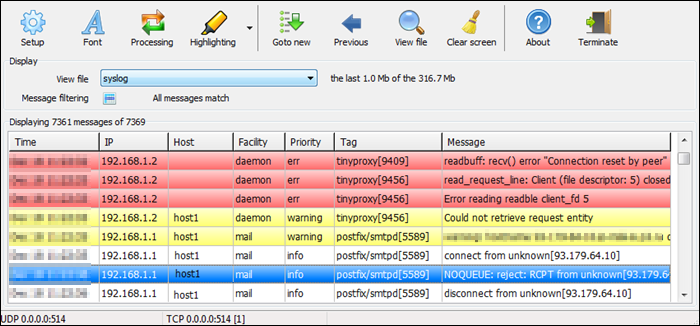
Visual Syslog Server is a free and lightweight Windows-based syslog server that monitors incoming data in real-time. It accepts messages via UDP and TCP and stores them on a disk. Previous syslog messages remain on the disk for future analysis as long as the user specifies.
Message filters include filtering based on the host, source address, priority, facility, or message content. Filtering makes it easy to find an issue when dealing with a large data volume.
Users can also configure thresholds for triggering the execution of scripts, programs, or email notifications. Thus, the tool automates problem-solving and reduces response time for pressing issues.
6. Datagram
The Datagram Syslog Server is part of the Datagram SyslogServer Suite. Its Datagram SyslogAgent is installed as a service on Windows clients and servers, supporting Windows 2000 or newer systems.
The program provides enterprise-level functionality, capable of log collection, message filtering, alerts, database storage, and log viewing.
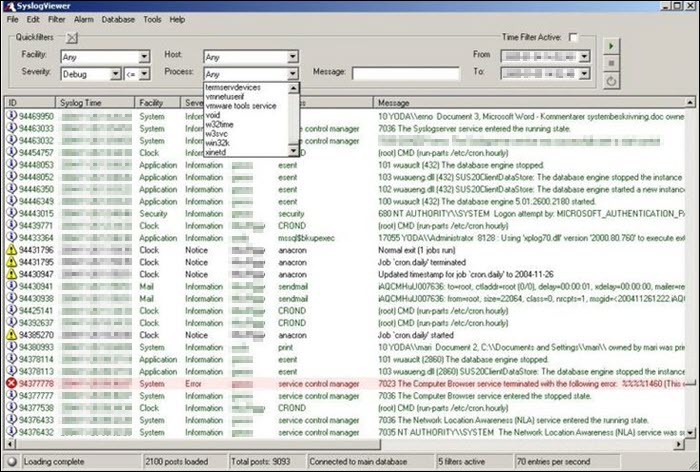
The GUI is intuitive and offers a live network view. The filters include the hostname, process, facility, issue severity, message, or even custom SQL queries.
The trial version is free, supports eight logging IP addresses, but supports the Microsoft Access database only. Entries cannot be backed up or deleted, and there are no email notifications. Users can create ten filters and set up to ten alarms.
On the other hand, the enterprise version costs $200 for 50 IP addresses, $500 for 500, and $900 for 5000 IP addresses. The enterprise version allows users to back up or delete entries, supports MSSQL databases, and sets no limit on creating filters or alarms. It also supports email notifications.
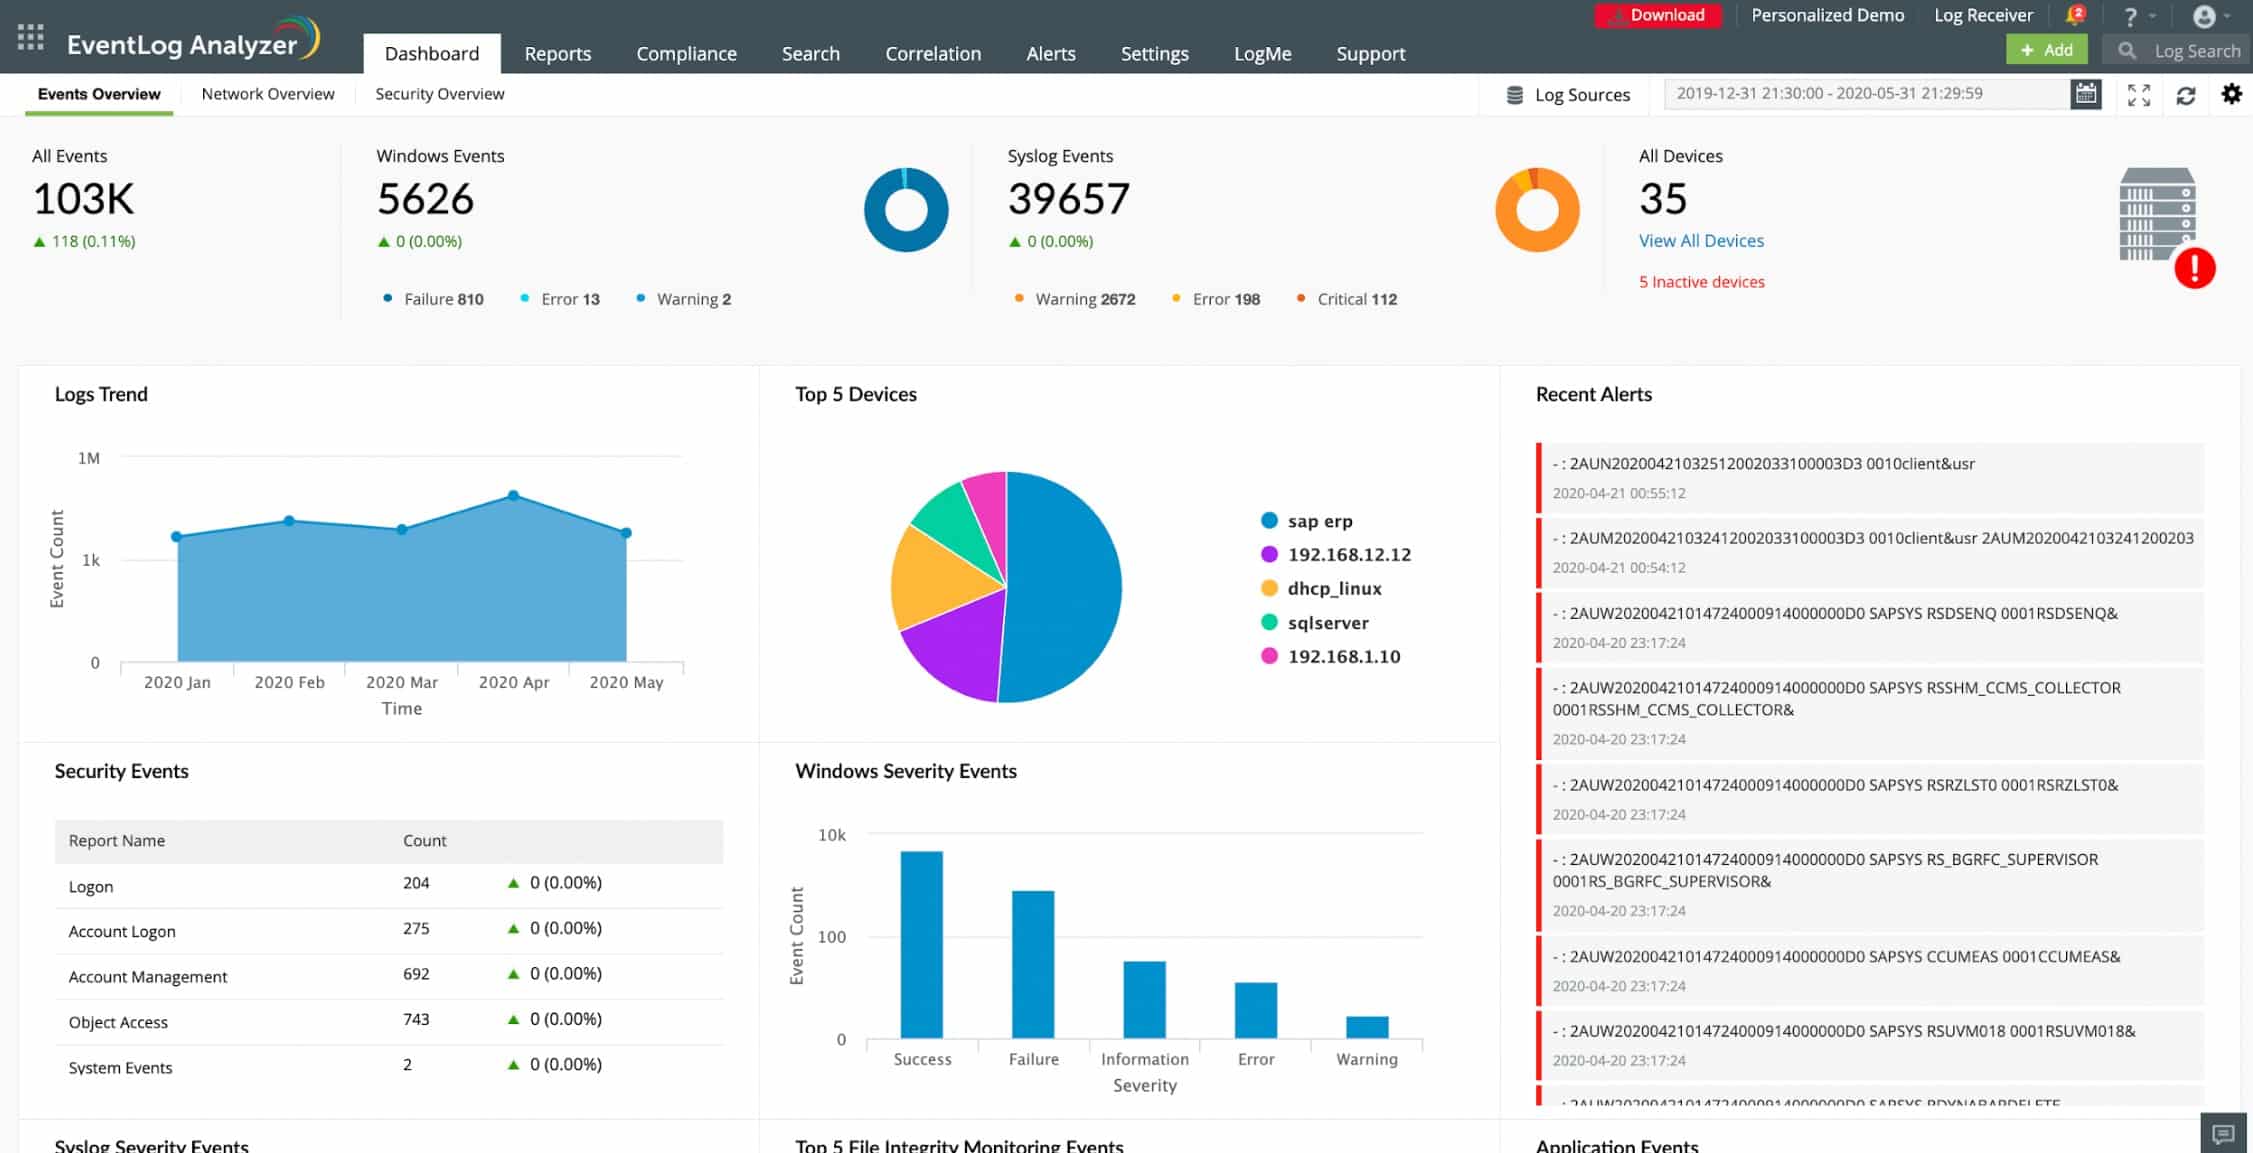
7. ManageEngine EventLog Analyzer

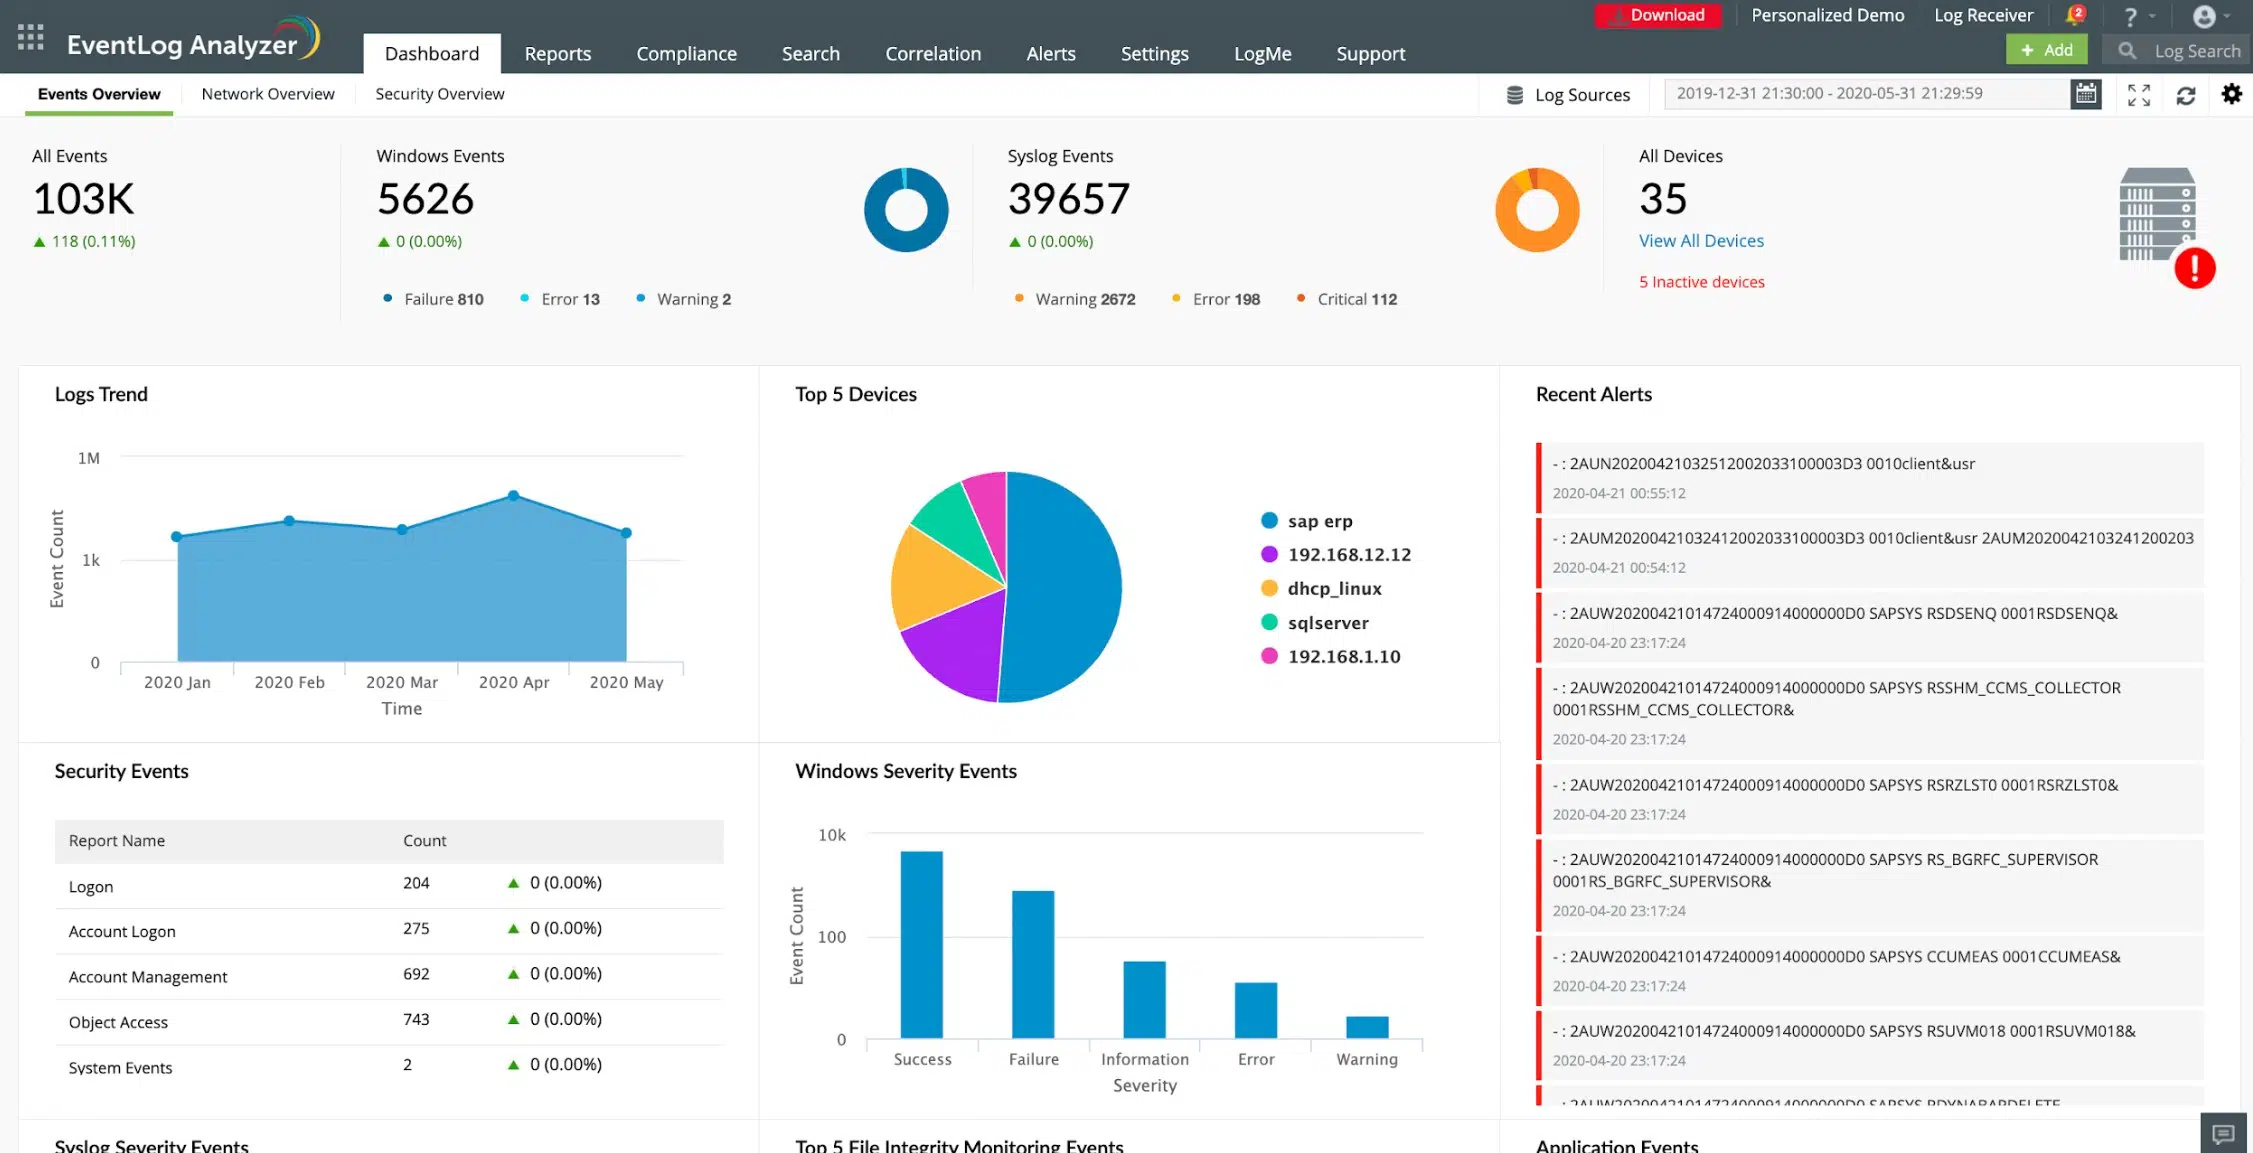
The ManageEngine EventLog Analyzer is a tool that allows the monitoring of up to five devices for free. It is compatible with Windows and Linux, while monitoring works for various devices running any operating system.
The EventLog Analyzer provides a GUI with a real-time log view and comparison, allowing for quick detection of suspicious messages and possible security threats. The functional dashboard enables users to create custom rules for alerts and notifications about security issues. There are also predefined rules for security event logs.
The auto-discovery feature finds devices on the network and facilitates log collection. Each message is labeled, making it clear which device it came from.
Compression and encryption of archived logs restrict data access to users without administrator privileges.
8. Icinga
Icinga is an open-source tool that monitors and reports on device health. This syslog server accepts various modifications that enable it to fit any organization’s network monitoring needs.
The syslog tool collects, stores, and organizes data in a time-series database, showing earlier and current syslog data. It instantly notifies the user about any suspicious data, which helps prevent downtime and allows monitoring based on events.
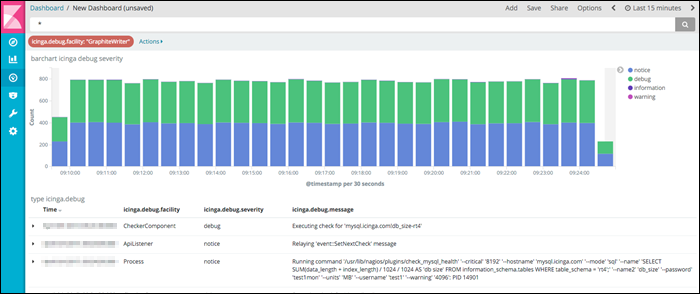
Icinga’s web interface provides charts and graphs depicting device health and optimizing troubleshooting and debugging. Its integration with other devices facilitates real-time data collection, storage, and visualization of log metrics.
9. GrayLog
GrayLog is an open-source syslog server for Linux. The tool is free for 5 GB of data per day, making it an excellent choice for small networks, but it isn’t suitable for large organizations.
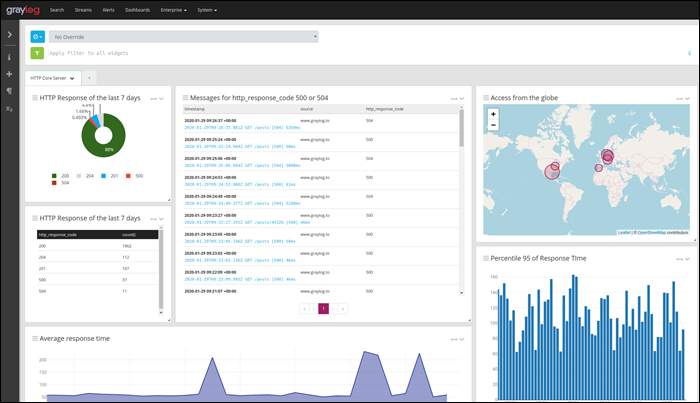
The server includes a query and search function with lots of filters that enable users to find a specific record quickly. The program interface consists of a fully customizable web GUI with graphs, charts, and changeable basic components for creating a custom day-to-day monitoring environment.
The server has prominent security features with automatic email notifications about failed logins, device faults, or security threats. With in-built automatic IP blocking, GrayLog can prevent an attack as soon as it recognizes one.
The app also offers fault tolerance features, audit logs, and role-based access control, further increasing security.
10. Windows Syslog Server
WinSyslog is a syslog server designed for Microsoft Windows. It supports syslog monitoring via UDP or TCP and it is free for displaying 60 messages at a time, with free troubleshooting support. Paid versions unlock additional features, provide greater security and unlimited device support.
WinSyslog is reliable, highly scalable, and collects syslog messages from any device compatible with the syslog protocol. It maintains device health using the Active Status Monitor feature, which pings the selected device and warns the admin if there is no response.
The server creates a daily log containing the received syslog messages, with customizable size and storage options. Store the file in a database or write it to the event log of Windows NT, 2000, or XP systems.
The program also features an automatic email notification in case of a security issue.
Paid Syslog Servers
The following is a list of the best paid syslog servers:
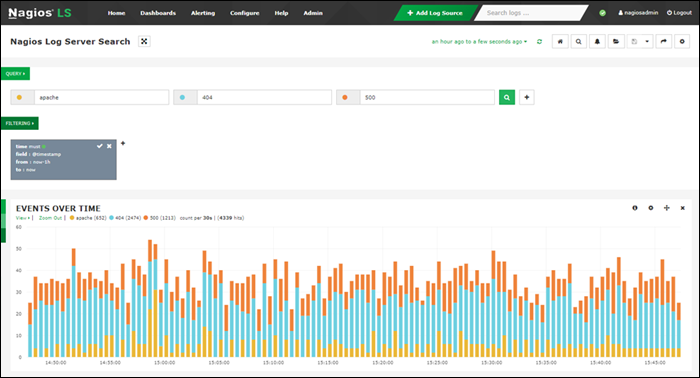
1. Nagios Log Server
Nagios is a scalable syslog server that helps monitor systems, networks, and infrastructure. While it does offer a free plan, it is only 500 MB/day, making it unsuitable for medium and large businesses.
Other pricing plans are:
- Single Instance. For $1,995, it covers only one installation, which excludes failover. With this purchase, the data plan is unlimited.
- Two Instances. Costing $4,995, it covers two separate installations, which allow for redundant data with automatic failover.
- Four Instances. Costing $6,995, it allows four separate installations, further increasing redundancy and speeds.
- Ten Instances. At $14,995, it allows for ten installations with maximum redundancy and query speeds.
The server can receive logs from a wide variety of operating systems and devices, including Windows, Linux, mail servers, Web and application servers, SQL servers, etc. It is customizable, with configurable thresholds, email notifications, script execution, or alert forwarding.
The dashboard provides an overview of all logs over time, with customizable filters that include the timestamp, ID, host, message, severity, program, etc. The tool generates reports which are also customizable and that automatically update in real-time.
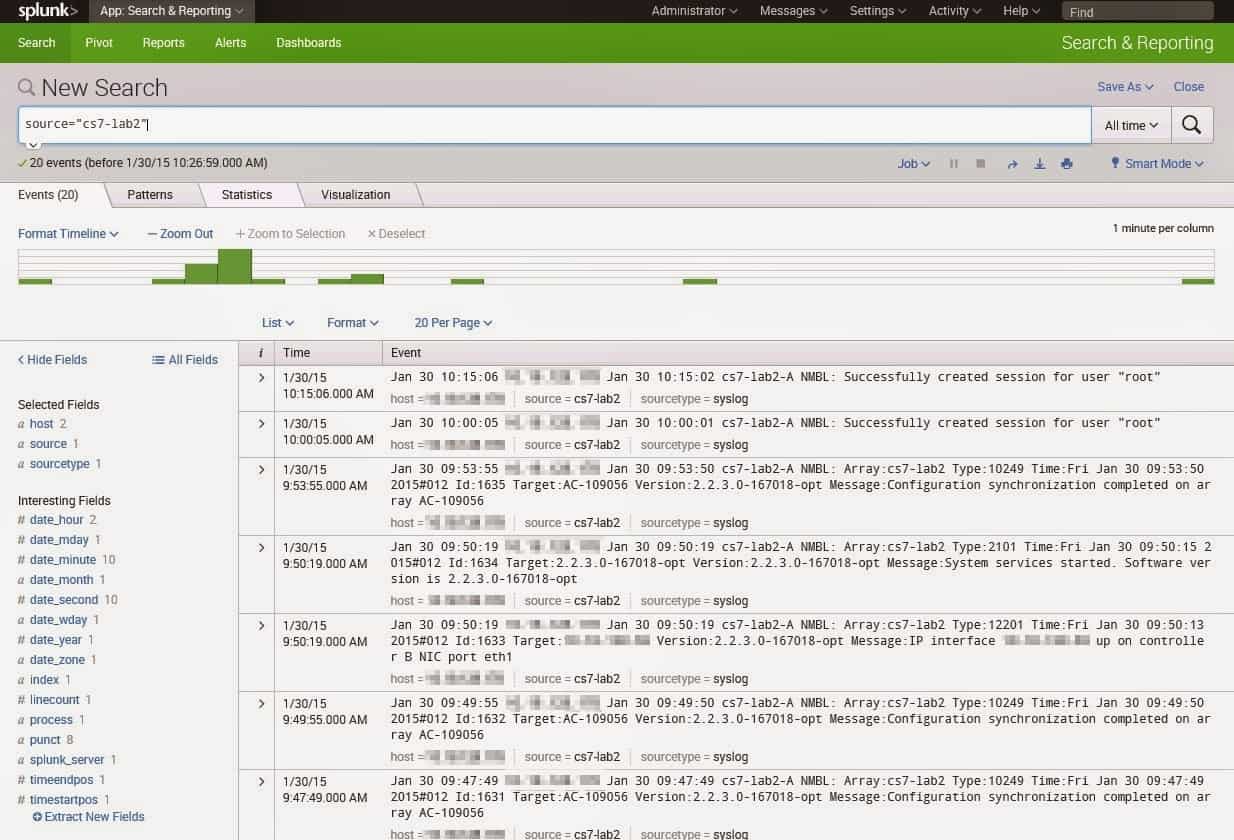
2. Splunkbase
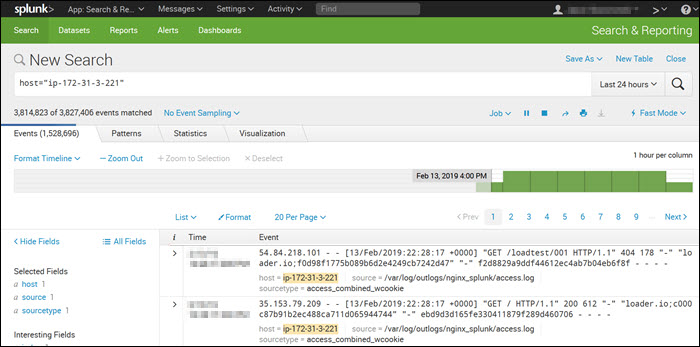
Splunk is a syslog server used for monitoring, querying, analyzing, and visualizing log data in real-time. It is a paid tool with a 60-day free trial that includes syslog features. The server is compatible with Linux and macOS.
Splunk costs $1,150 per GB of data for a yearly 15 GB license, including maintenance.
Splunk features an intuitive and user-friendly UI with real-time statistics and a customizable dashboard.
It includes powerful search functionalities and filters that narrow every search down to the messages the user needs, such as error messages or device-specific messages. Splunk allows users to perform Boolean, quoted string, and wildcard searches in real-time, time range, or transaction level.
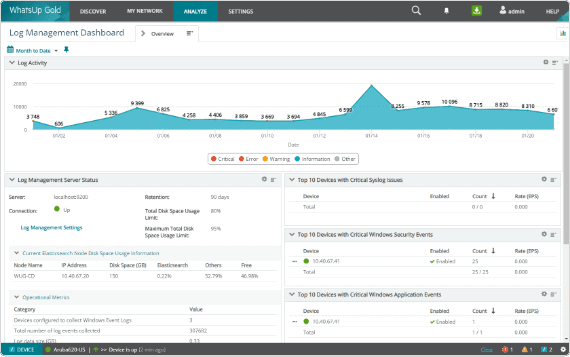
3. Progress WhatsUp Gold Log Management
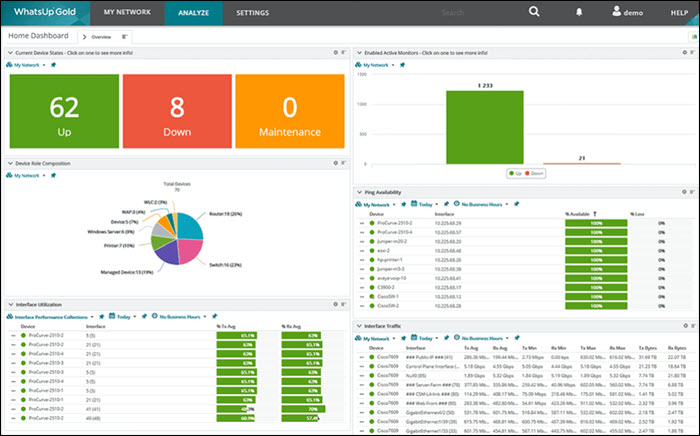
Progress WhatsUp Gold (formerly IPSwitch) is a paid syslog server that comes with a free 14-day trial. The syslog management tool is an add-on to the WhatsUp Gold monitoring tool for Windows Server, and it also receives Windows Events messages.
The price plans differ for a subscription and a perpetual license. For example, the pricing plans for a 1-year license include:
- 5 Servers — $1,325
- 10 Servers — $2,300
- 25 Servers — $5,250
The logging tool receives the log and Windows event messages and files them together. If there are sudden out-of-band increases or decreases, the tool creates an alert and notifies the user.
The customizable drag & drop dashboard shows messages in real-time as they arrive. Color-coded icons and graphs improve the visibility of each message’s severity, allowing the team to react immediately.
WhatsUp’s interactive interface shows each device’s availability and performance, both on-premise and in the cloud.
4. Logstash
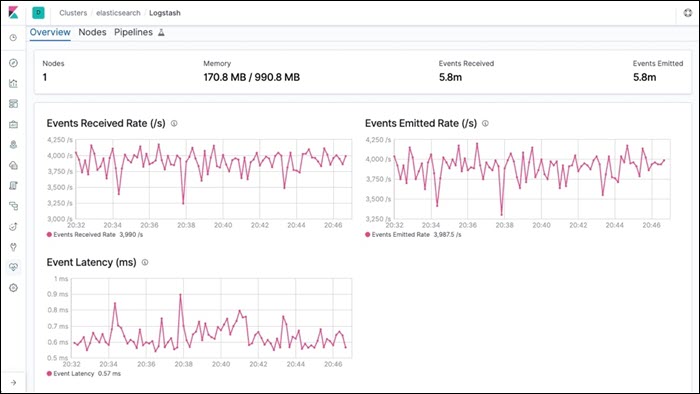
Logstash is part of a software suite called ELK stack that collects log messages. One part of the stack, Elasticsearch, sorts and filters the messages for analysis, while Kibana processes and displays the data. All technologies in the ELK stack are Linux-based, but work on macOS as well.
Logstash comes in four pricing plans:
- Standard. For $16 per month.
- Gold. Costs $19 per month.
- Platinum. Costs $22 per month.
- Enterprise. Contact the sales team for a quote.
Logstash listens on the network for messages coming from a wide variety of devices, but also supports collecting data from cloud services and applications. It collects logs via TCP or UDP, and it also supports TLS-encrypted messages.
Logstash can read messages from a file or database, get messages from mail servers, IRC or RSS feeds, and pick up SNMP messages. The filters allow users to find specific messages and quickly resolve any issues.
The front-end part of the ELK stack, Kibana, works well for any syslog server.
5. Loggly
Loggly is a cloud-based syslog consolidator and analyzer. It doesn’t require software installations on-premises but requires setting up automated file transfer procedures that upload the logs to the Loggly server.
The utility comes in four pricing plans:
- Lite. Free, includes 200 MB/day, and retains data for seven days.
- Standard. Starting at $79/month, it limits data to 1 GB/day and retains data for 15 days.
- Pro. Starting at $159/month, data volume is up to 100GB/day, and retains data for up to 30 days.
- Enterprise. With a starting price of $279/month, it includes a custom data volume and retains the log data for up to 90 days.
Loggly standardizes and stores syslog messages from many sources, allowing users to access the data uniformly. Once the data is stored, it is accessible via the log analysis tools in the online service.
Loggly includes storage space with the software purchase, but since it stores data remotely and offsite, it is good to back up the log files on another site to improve system security. Data retention depends on the purchased package.
6. Site24x7 Server Monitoring
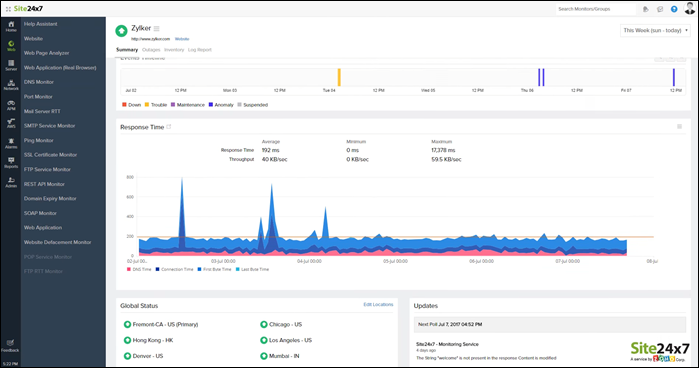
Site24x7 is a cloud-based monitoring and management software suite that includes the Log Manager. The Site 24×7 Infrastructure utilities offer a 30-day free trial. A monthly subscription comes with a 500 MB log processing allowance costing $9 with the following possible upgrades:
- 10 GB. Costs $10 per month.
- 100 GB. Costs $95 per month.
- 1 TB. Costs $900 per month.
Although the system is cloud-based, a Site24x7 agent must be installed on the monitored system for the Log Manager to work. The agent is compatible with Linux and Windows server.
When receiving syslog messages, the server standardizes them and files the messages in the same format. Message standardization allows users to analyze messages from different sources together.
The dashboard includes many data analysis options within the log file viewer tool, including log querying, sorting, filtering, and grouping messages.
How to Choose a Syslog Server?
There are several factors to consider when choosing a syslog server:
- Business Size. A paid syslog server is probably a better choice for a large enterprise due to the data volume and device number restrictions of free servers. On the other hand, a free syslog tool can provide the necessary functionalities for small businesses with low device numbers and a small data volume.
- Support. If your organization doesn’t have skilled IT staff or if you need help setting up the software, a paid tool usually includes support and troubleshooting assistance. Some free utilities also have basic documentation, but don’t offer round-the-clock support and troubleshooting.
- Storage. A better choice for businesses with their own storage capacities are syslog servers sold as a software suite, which are installed on-premises. An on-premises option improves security and lowers the chance of a data breach. On the other hand, some syslog tools are sold as a cloud-based syslog service, which is a good choice if you don’t have your own storage.
Conclusion
This article listed the 16 best syslog servers, their benefits, features, capabilities, and pricing. You should now be able to decide which syslog server is the most suitable for your organization.
Syslog is the keeper of all things events and we’re bringing you the Best Free Syslog Servers for Windows (and Linux), along with some insightful reviews and screenshots.
Syslog (System Logging) standard is widely used by devices of all sorts, including computers, routers, switches, printers, and more.
Here is our list of the six best free Syslog servers for Windows, Linux and Unix:
- ManageEngine EventLog Analyzer – EDITOR’S CHOICE This tool collects, consolidates, and files log messages and also provides analytical functions. Runs on Windows Server or Linux. Get 30-day free trial.
- ManageEngine Log360 – FREE TRIAL This SIEM system includes a comprehensive log management and analysis package and is available in free and paid versions. Runs on Windows Server. Access a 30-day free trial.
- EZ5 Systems Syslog Watcher A Syslog consolidator that receives log messages and files them. The service also records message turnover metrics and can issue alerts for unusual levels. Installs on Windows.
- Splunk Enterprise This is a paid tool since the free version was deprecated. However, it offers a 60-day free trial and includes Syslog server capabilities. Installs on Linux and macOS.
- The Dude A free network monitoring system that includes a Syslog and Windows Event server. Installs on Windows, macOS, and Linux.
- Progress WhatsUp Gold Log Management A paid product with a free trial that is a log server for Syslog and Windows Events. This is an add-on to the main system monitoring package of WhatsUp Gold and it on Windows Server.
Devices send syslog messages about any number of events. These can be informational messages, such as user login events, or they can be critical messages, like a failure in the primary application.
These messages play an important part in a network administrator’s arsenal of tools; they alert the admin of errors and warnings right as they happen, allowing them to quickly respond to problems and hopefully fix them before they become major issues.
What is a Syslog Server?
Syslog servers are the most significant tool in the domain of IT infrastructure management. They play a vital role in gathering and storing log messages from different applications and devices that are on the network.
The Syslog server’s centralized logging system aids the administrator of the system in monitoring and troubleshooting their system effectively.
In the following points, we are going to cover the idea of a Syslog server, its uses, and the free options available for Linux, Unix, and Windows platforms.
A Syslog server is a centralized logging system whose basic function is to gather, process, and store log messages that are created by network components, devices, and applications. The protocol of the server started in the 1980s, and since then it has been mostly used in various routers, network devices, switches, and routers. The protocall allows these systems to share diagnostic information and event notifications with the Syslog server that is in the center.
What is a Syslog Server Used For?
The fundamental use of the Syslog server is to offer centralized log management. Syslog servers provide various benefits through the collection of log messages from different sources. The benefits are as follows:
Centralized Logging: Syslog servers offer one location for log data storage, thus allowing administrators to perceive overall events, potential issues, and system activities.
Troubleshooting and Monitoring: Then, with the help of the Syslog server, administrators can easily determine and resolve issues because all the log messages are gathered in one location. It enables fast detection of anomalies and patterns.
Security and Compliance: The teams responsible for security use Syslog servers to investigate and detect security issues. The server also stores audit records and trails that are needed for regulatory compliance, and the Syslog server is also used for compliance.
Long-term Storage: Syslog servers enable businesses to sustain log data for longer periods of time, which further helps in the analysis of past data and the identification of trends.
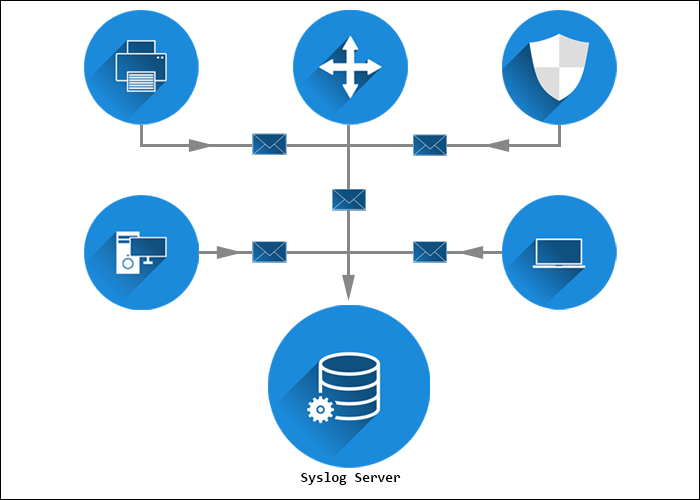
Syslog message, SNMP, troubleshooting, and polling
Syslog messages are also important to have for security audits. On a network with a large number of devices, accessing logs on each device requires logging in to each one. It is a tedious and time-consuming process and you run the risk of missing important event messages. This is where syslog servers, also referred to as collectors, become very useful.
After enabling each device to send syslog messages, those devices start sending their log messages which are captured by the syslog server; there they are readily available to view and analyze.
Unlike SNMP, syslog cannot be used to poll devices for information; the syslog standard is used only to send messages about events.
For troubleshooting purposes, syslog sending is potentially more effective than SNMP polling because syslog messages are sent and received immediately after an event occurs, whereas polling information is received at intervals – events can occur quickly and cause a lot of damage in the short amount of time between polling intervals.
For each device that you wish to have send its event logs to your syslog server, you need to ensure that its remote syslog service is enabled and that it is pointed at the IP address of your server.
Note: the Syslog default port is UDP 514; each sending device and the receiving Syslog collector need to be able to access this port.
The Best Free Syslog Servers
Grab one of the following Free Syslog Servers below to keep an eye on your network with further detail from a centralized location, many of these can also be installed on Windows 7, 8.1, 10, 11, and other desktop versions of Windows, as well as almost every Windows Server Version on the Market.
What should you look for in free Syslog server tools?
We reviewed the market for free Syslog servers and analyzed the tools based on the following criteria:
- A simple way to set up clients so that they can send to the server
- Security systems that provide security and authentication routines
- A file management system that can rotate log files and create a meaningful directory structure
- Nice to have a consolidator that can merge Syslog messages with Windows Events
- A data viewer tool that includes record searching, sorting, and filtering capabilities
- Software that can cope with the volume of data your system generates
- The option to try out paid Syslog servers for free as well as accessing permanently free systems
With these selection criteria in mind, we have discovered some really useful Syslog management utilities that we are happy to recommend and explain how you can get them for free.
1. ManageEngine EventLog Analyzer – FREE TRIAL
ManageEngine EventLog Analyzer offers log messages collection and management services that extend to log file management and log analysis.
This software package isn’t limited to collecting logs from the computer it is installed on. It gathers data from all of the devices on the network, no matter what operating systems they are running.
Key features:
- Extensive integration into other ManageEngine products
- Cross-platform support for Windows and Linux
- Advanced syslog filtering capabilities
The EventLog Analyzer gathers Windows Events from PCs and Windows Server computers and also Syslog messages from Linux systems. It also collects the log messages output by the software running on your systems.
One of the main tasks of this tool is to consolidate log messages by converting them into a common format. This means that they can be stored in the same file and are in regular columns that can easily be searched for analysis.
The EventLog Analyzer files these messages in a meaningful directory structure and rotates log files regularly.
An analytical tool in the EventLog Analyzer console is able to access log files and search through them. The tool lets you implement a range of applications, such as security or performance monitoring.
Log messages can also be forwarded by the EventLog Analyzer to third-party tools for deeper scrutiny. Examples of this type of setup include SIEM systems, including ManageEngine’s own Log360 (see next review).
Pros:
- Collects operating system logs
- Gathers software log messages from 700 different packages
- Consolidates and files log messages
ManageEngine EventLog Analyzer runs on Windows Server or Linux. There is a Free edition that is limited to gathering logs from five sources. You can assess the full Premium edition with a 30-day free trial.
Get 30-day FREE Trial
2. ManageEngine Log360 – FREE TRIAL
ManageEngine Log360 is a bundle of tools that creates a SIEM system. There are six ManageEngine packages in this offering and one of those is the EventLog Analyzer featured above. This system receives, stores, and displays log messages for searching.
Key features:
- Features a comprehensive SIEM system
- Supports multi-site/multi-tenant environments
- Includes a free version for testing
While you get a fully automated threat detection system with the SIEM, you also get a log manager. The service will receive log messages from more than 700 different sources, which includes those that use the Syslog format.
The tool standardizes those incoming messages into a common format so that they can be stored and searched together. This process is called “parsing” and it enables you to unify data from different origins.
Logs are collected from each endpoint on your network and also from cloud platforms, such as AWS and Azure.
The Log360 package includes a compliance reporting tool for HIPAA, PCI DSS, FISMA, SOX, GDPR, and GLBA.
The SIEM performs automated searches through collected logs and raises an alert if it detects a threat event.
Alerts can be sent as notifications through service desk systems, including ManageEngine ServiceDesk Plus, Jira, and Kayoko.
Pros:
- Collects log messages for more than 700 sources
- Free edition available
- Consolidates and stores log messages
Cons:
- The free version is intended for use with the log files collected during the trial period of the paid edition.
ManageEngine Log360 runs on Windows Server and you can assess the tool with a 30-day free trial.
Get 30-day FREE Trial
3. EZ5 Systems Syslog Watcher
A comprehensive, feature-rich application, EZ5 Systems Syslog Watcher is a Windows-based dedicated syslog server that collects and analyzes syslogs from any number of network hosts and servers (The free version allows up to 5 sources, while the professional license lets you collect from an unlimited number of sources).
Key features:
- Consolidates syslog files from various applications
- Supports continuous syslog monitoring
- Various alert and automation templates
It gathers syslog messages from any device or appliance that has syslog sending enabled, as well as system log events from Windows, Unix, and Linux servers.
It also collects from any software that supports syslog sending. It boasts being able to handle 5000+ syslog messages per second.
Syslog Watcher supports both IPv4 and IPv6 networks, and collects over both UDP & TCP.
You can enable email alerts for certain events and messages, which alerts you of network and system errors before they become major problems.
The Viewer lets you sort and filter events as they come in, and lets you view the most recent syslogs in virtually real-time; messages can be customized by font and background based on filters.
All stored messages can be searched using an extensive rule set.
Important messages can be saved longer, and max keep time depends on the severity level of the message.
Pros:
- Simple lightweight interface
- Supports logging in Windows, Linux, and Unix environments
- Can handle enterprise-level traffic, 5000+ messages per second
Cons:
- They no longer provide a free limited version.
- The log search filter could use refinement
- Would like to see alerting options
Download: https://ezfive.com/syslog-watcher/downloads/
Read our Full Review on SNMPSoft Syslog Watcher.
4. Splunk Enterprise
Splunk Enterprise is designed to be a comprehensive log management solution for small IT environments. Real time analysis of syslog messages from your devices is done from its customizable dashboard.
Key features:
- Generous 60-day trial period
- Support for Linux, Windows, and macOS
- Vast syslog collection integrations
It comes with powerful search functionalities and the ability to filter results and drill down to those messages that you specifically require, such as error messages only or messages only from a specific device.
Its search capabilities include Boolean, quoted string and wildcard searches; it allows you to search in real time, search time-range, or search by transaction-level.
Splunk’s capabilities can be expanded using add-ons such as the Add-on for Microsoft Windows, which allows you to collect log messages from Windows machines.
Pros:
- Uses powerful query language, great for environments with high log volumes
- The tool is initially lightweight, with additional features supported through plugins
- Supports up to 500 MB of log data per day – solid option for small businesses
Cons:
- The dashboard interface can take time to get used to, could be made easier to use
- The advanced search features have a steeper learning curve for new users
It can also be set up to collect syslog data from a forwarder. Splunk Enterprise is a paid system but you can get it on a 60-day free trial.
5. MicroTik The Dude
In our Top Free Netflow Analyzers and Collectors article we discussed the application The Dude, from MicroTik. The Dude is a powerful network administration application; it contains within itself a built-in Free Syslog Server.
Key features:
- Easy to use, learn, and deploy
- Support for Windows, Linux, and macOS
- Completely free
This server can be turned on in the Server settings, under the “Syslog” tab.
While having The Dude poll your devices (sending out information requests at regular intervals using SNMP) is useful, capturing unsolicited messages from your devices is a more effective way to catch errors quickly.
You can create alerts for specific syslog messages as well as create filters.
The Dude is a great all-purpose application for network administrators.
Pros:
- Installs on Windows, Linux, and Mac, making this one of the most flexible options for syslog servers
- Can ingest SNMP alerts, ICMP requests, and DNS queries, giving you a wide variety for log collection options
- Utilizes autodiscovery for network mapping and device identification
- Supports log forwarding to other servers or applications
6. Progress WhatsUp Gold Log Management
Progress WhatsUp Gold is a network management system that can be expanded by add-ons. One of the add-ons available with this package is the Log Management module.
Key features:
- Offers various monitoring add-ons
- Lightweight base package
- Features detailed reporting capabilities
The Log Management system can operate as a Syslog server and it will also receive Windows Events messages. It is able to consolidate these two different formats and file them together. The service collects metrics on log message throughputs and will raise an alert if the arrival rate suddenly increases or decreases out of band.
The dashboard of the Log Management tool will show each log message as it arrives. The severity of each message is easy to spot, thanks to the use of color-coded icons that follow a traffic light system.
The Log Management system is only available as an add-on to WhatsUp Gold. These tools are software packages that install on Windows Server.
Pros:
- Offers message forwarding, allowing you to receive logs and alerts on multiple platforms
- Can process six million messages per hour, allowing it to be used in enterprise environments
- Acts as an event viewer, allowing you to import older logs for review
Cons:
- The interface is clunky, and can be harder to read logs during heavy use
- Only available for Windows
Download Today and Get Started: https://www.whatsupgold.com/trial
Conclusion
Grab one of these great Free Syslog Servers today and fire up a Test VM or Server and get it configured to really get a good feeling of the software works, along with their respective feature sets.
We’ll continue to update this list throughout the year and if we’ve missed any software, please feel free to send us an email and we’ll happily get the software added after we’ve reviewed it!
Free Syslog server FAQs
How do you forward Windows event logs to a Syslog server?
The easiest way to forward Windows event logs to a Syslog server is to set up a collector. There are a number of these available and some of them are free. Your best option is to use the Kiwi Syslog Server Free Edition. You can read a step-by-step guide on Event log forwarding to Syslog using Kiwi here on the PC & Network Downloads website.
What is the default port used to connect to a Syslog server?
The default port to use when communicating with a Syslog server is UDP port 514.
How do you install Syslog server in Linux?
You can install syslog-ng on Linux with the command:
$ sudo apt-get install syslog-ng -y
Need the best syslog server to stay on top of system events? There are a lot of free tools out there, this guide brings you the best syslog servers for Windows and Linux to help you decide.
@VPN_News
UPDATED: October 9, 2023
A syslog server is a centralized log management system that collects, stores, and manages syslog messages generated by various network devices, servers, applications, and other sources.
It acts as a central repository for log data and provides a platform for analyzing and monitoring system events.
Syslog servers stand as invaluable tools for network administrators, enabling them to consolidate logs from various devices into a central repository for easy monitoring, troubleshooting, and analysis. While there are several premium options available in the market, there’s a notable range of free syslog servers that offer robust features without stretching your budget.
Here’s our list of the best free and paid Syslog servers for Linux and Windows:
- SolarWinds Kiwi Syslog Server EDITOR’S CHOICE The top choice for collecting, viewing and archiving syslog messages and SNMP traps. With a variety of filters and real-time monitoring options you can closely monitor your network and also send daily summaries. Free for up to five devices.
- Paessler PRTG Network Monitor (FREE TRIAL) A comprehensive network, server, and application monitor that includes sensors for Syslog management. The first 100 sensors are free.
- ManageEngine Event Log Analyzer (FREE TRIAL) Can be installed on Windows or Linux, operates as a Syslog server and includes a very intuitive and user-friendly dashboard.
- Site24x7 Server Monitoring (FREE TRIAL) A network, server, and application monitor that includes a log manager for Syslog and also Windows Events and application log messages. This is a cloud-based service.
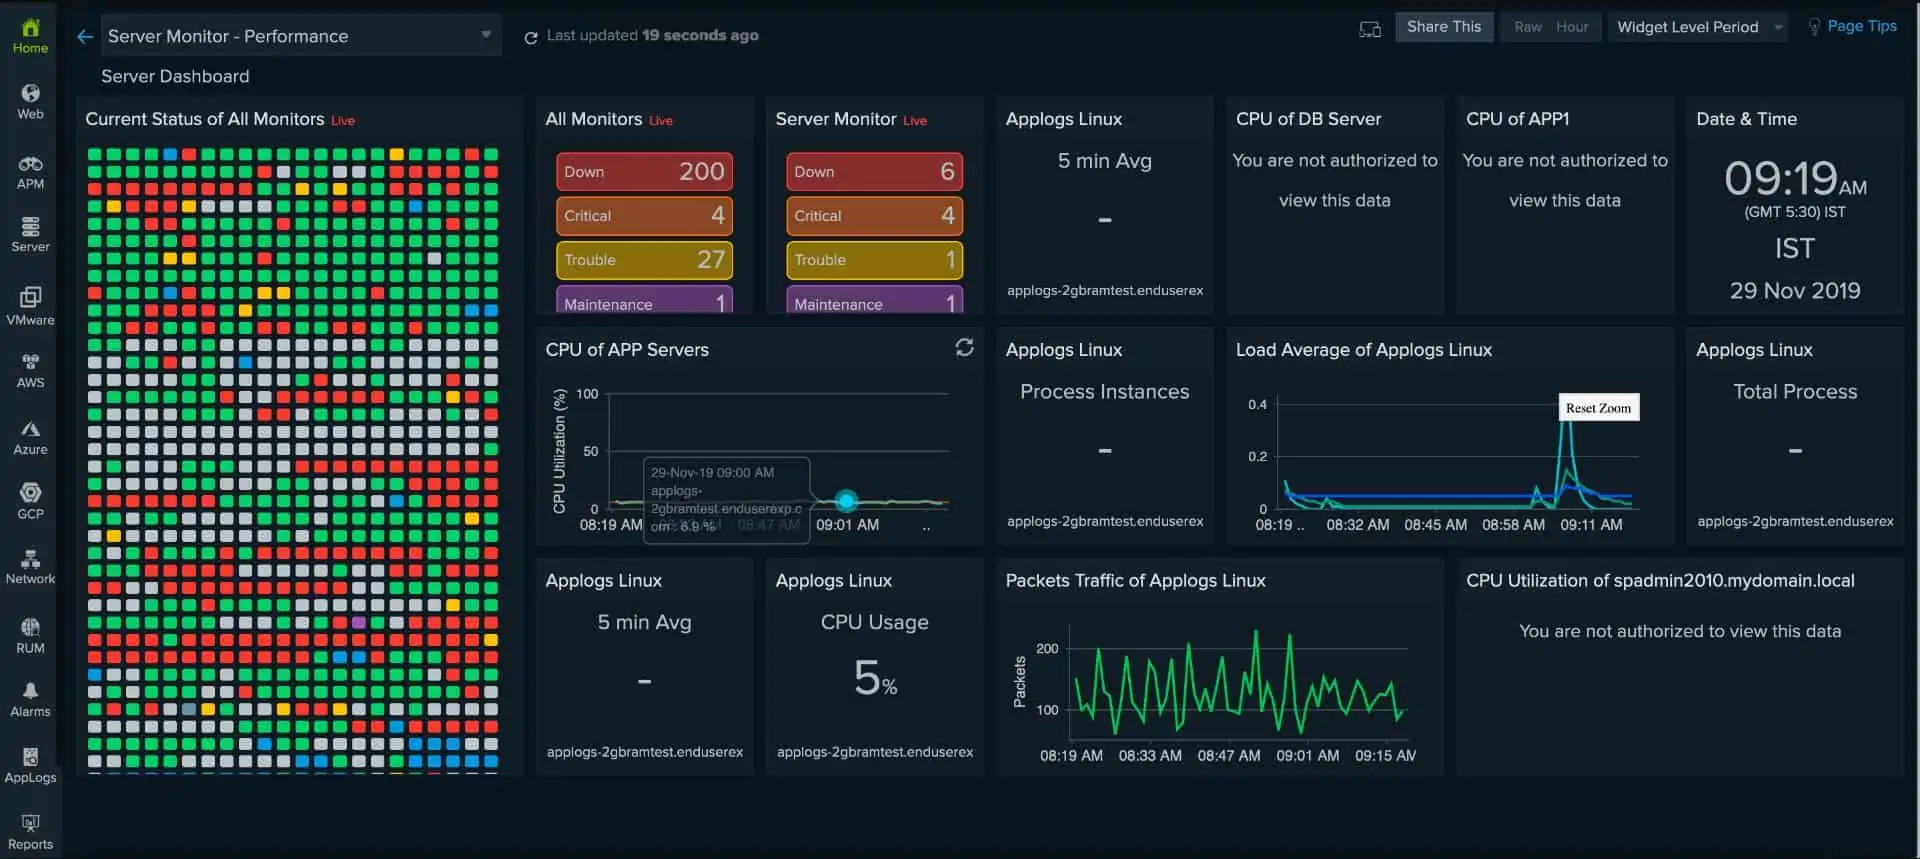
- FirstWave opEvents (FREE TRIAL) A log file manager that is able to collect log messages from a range of sources, including Syslog. Installs on Linux.
- ManageEngine Log360 (FREE TRIAL) A SIEM system that includes a log collector and server that is able to extract Syslog messages from Linux computers. Runs on Windows Server.
- Syslog Watcher A free Syslog server for Windows that writes Syslog messages to files or a database and includes record sorting and filtering functions.
- The Dude Free network analysis tool with an integrated Syslog server for Windows, Linux, and Mac OS.
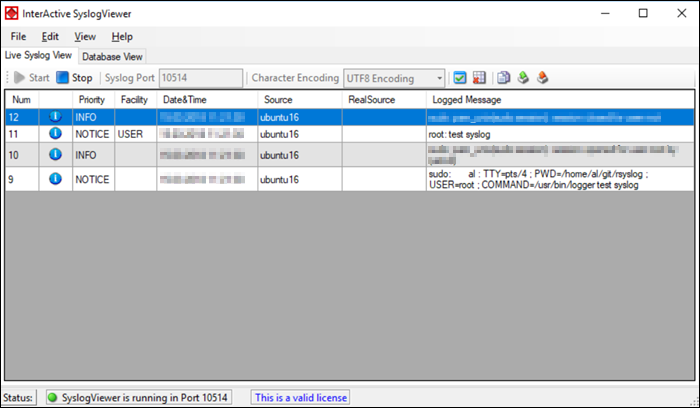
- Visual Syslog Server Collects Syslog messages and stores them to file as well as displaying them in a dashboard. The program is free and runs on Windows and Windows Server.
- NxLog A free Syslog server for Windows, Linux, Unix, and Android.
- Logstash A system message monitoring service for Linux that includes the storage of Syslog messages.
- TFTPD32 Lightweight, free system message logger for Windows that includes monitoring for Syslog.
Syslog servers by OS
| Syslog server | Linux | Windows | Other |
|---|---|---|---|
| Kiwi | No | Yes | No |
| Paessler PRTG | No | Yes | Yes |
| Event Log Analyzer | Yes | Yes | No |
| Site24x7 | No | Yes | No |
| FirstWave opEvents | Yes | No | No |
| ManageEngine Log360 | No | Yes | No |
| Syslog Watcher | No | Yes | No |
| The Dude | Yes | Yes | Yes |
| Visual Syslog Server | No | Yes | No |
| Nxlog | Yes | Yes | Yes |
| Logstash | Yes | No | No |
| TFTPD32 | No | Yes | No |
The Best Syslog Server Tools for Linux and Windows
If you don’t have a budget for tools, or if you don’t think that it is worth spending money just to look at log file messages, then check out our list of free syslog servers. Most review sites will give you a list of the five or 10 best syslog servers, but we have gone the extra mile and found 12 excellent syslog servers that are free to use.
Our methodology for selecting Syslog server tools
We reviewed the market for Syslog servers and analyzed the options based on the following criteria:
- The ability to receive Syslog messages from any system
- The option to receive log messages from other systems
- Logfile consolidation
- A log file manager
- A log receiving record
- Free options or a free trial period for assessment
- A free tool that offers sufficient utilities or a tool that is worth paying for
Features Comparison Table
1. SolarWinds Kiwi Syslog Server (FREE DOWNLOAD)
Kiwi is a syslog server utility from SolarWinds. The package costs $295, but there is a free version. You can use the system for free to monitor Syslog messages from up to five devices. The free package would only be suitable for small networks.
Key Features:
- Collects Syslog messages and SNMP traps
- Generates log files
- Log record viewer
- Free version
Why do we recommend it?
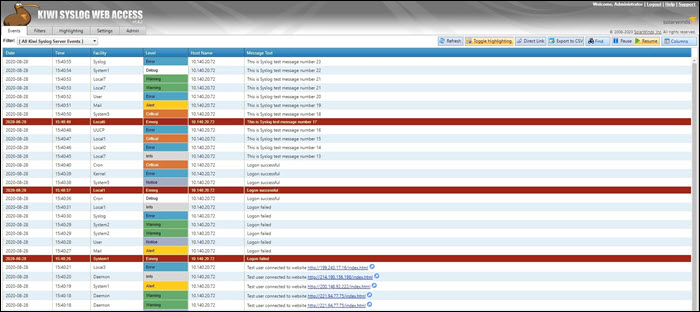
Kiwi Syslog Server Free Edition is a great service because you can get a paid tool for free. Although the paid version has a few more features, the Free Edition is a good Syslog collector that is able to store and also forward Syslog messages as well as other log formats.
The Simple Network Management Protocol is based on the Syslog methodology, so Kiwi can also gather SNMP messages. A device-originated alert message is called an “SNMP Trap.” The Trap is an exception to regular SNMP procedures in which devices’ agents only respond with statuses when queried by a manager program. So, Traps are designed to signify high-risk conditions. The package includes Kiwi Syslog Web Access, which is a Web interface that you host on your own server and gives access to the console of the Syslog server from anywhere through any standard Web browser.
Who is it recommended for?
Anyone can use the Kiwi Syslog Server to collect, view, and manage Syslog messages as well as SNMP Traps and Windows Events messages. Collecting log messages and filing them is an important requirement for data protection standards compliance.
Pros:
- Offers a freeware version for smaller networks
- Captures both syslog and SNMP traps, ensuring nothing is missed
- Interface is easy to use and allows for quick filtering based on application, location, or custom grouping
- Color-coded warning level helps critical events pop out, and aids in prioritization
- Affordable for any size network
Cons:
- Built for sysadmins, not the best option for home networks or non-technical users
The Kiwi system enables you to write event logs by IP address, date or by message source type. You can get alerts on high traffic conditions sent to your email notifications. However, if you get the paid version there are many more conditions that you can elect to be notified about by email. The Kiwi Syslog Server is only available for Windows. It can be installed on Windows Server 2008 R2, Windows Server 2012, Windows 7 SP1, Windows 8.1, and Windows 10.
EDITOR’S CHOICE
Kiwi Syslog Server is the top choice for collecting, viewing and archiving syslog messages and SNMP traps. With a variety of filters and real-time logging windows, you can closely monitor your network and send daily email summaries. The free version is limited to 5 devices, but the full version, at only $295, is far more powerful with actions like sending emails, running programs and sending logs to a database. For both large and small networks, this is a great choice of Syslog server.
Download: Download 100% FREE Tool
Official Site: https://www.solarwinds.com/free-tools/kiwi-free-syslog-server
OS: Windows & Windows Server
If you are tooling up a network management team, you are going to need a lot more than just the Kiwi Syslog Server. In these circumstances, consider the Small Business Network Management Bundle. This gives you the Kiwi Syslog Server plus three more systems management modules. The first of these is the Engineer’s Toolset, which is actually a bundle of more than 60 system management utilities. You also get the Network Topology Mapper and Kiwi CatTools, which manages network device configuration backup. This package runs on Windows Server and you can get it on a 14-day free trial.
SolarWinds Small Business Network Management Bundle
Start a 14-day FREE Trial
2. Paessler PRTG Network Monitor (FREE TRIAL)
Paessler PRTG Network Monitor is a very comprehensive network monitoring system. However, you can use PRTG for free if you have a small network. Paessler charges per “sensor.” A sensor is a condition or status on a network. The company counts Syslog as one sensor, and if you monitor 100 sensors or less, the system is free of charge. So, you will have 99 other network conditions that you can monitor before you have to pay.
Key Features:
- Syslog collector sensor
- Wires log records to a database
- Manages Syslog database
- Free version with limitations
Why do we recommend it?
Paessler PRTG Network Monitor runs on Windows Server so if you need to collect Syslog messages from other operating systems and store them through your Windows system, this is a great option. The Syslog Receiver Sensor inserts logs into a database and that provides options over how the messages can be used and managed.
You can download the PRTG software from the Paessler website and install it on Windows. There isn’t a version for Linux. However, you can opt to access the software as a cloud service, which is system agnostic.
The Syslog function in PRTG is called the Syslog Receiver. This sensor will gather all Syslog data traveling around your network and write them to a database. Once the messages are in the database, the subsequent management of those records depends on the settings that you specify for the system. You can get them written to log files, query them in the PRTG dashboard, and trigger actions under certain conditions.
Who is it recommended for?
All businesses need to collect log messages for security monitoring and compliance reporting, so getting this Syslog manager for free is a great option for businesses of all sizes.
Pros:
- Allows users to customize sensors to meet their specific needs
- Free version allows monitoring with up to 100 sensors, great for smaller businesses
- Offers both on-premise and cloud versions
- A great choice for companies looking to also monitor other aspects of their business such as networks, applications, or infrastructure
Cons:
- Can take time to learn the platform, PRTG is rich with features and designed for enterprise use
PRTG is free if you only activate up to 100 sensors, which is more than enough to access the Syslog server monitors. You can download a 30-day free trial.
Paessler PRTG
Start 30-day FREE Trial
3. ManageEngine EventLog Analyzer (FREE TRIAL)
ManageEngine EventLog Analyzer operates as a Syslog server and is free for up to five log sources. The monitoring software can be installed on Windows or Linux, but it can monitor events arising on any operating system. The syslog data can originate in any type of network-connected equipment, including switches, routers, and virtual machines.
Key Features:
- Syslog log manager
- Functional dashboard
- User rights management
Why do we recommend it?
ManageEngine EventLog Analyzer can collect and store many log message formats, not just Syslog. The tool also has deployment options – you can host it on Windows Server or Linux. This tool is more than a log server because it provides a viewer with analysis tools and also implements automated threat hunting as a SIEM service.
You don’t have to put much work into setting up the system thanks to its autodiscovery feature. Syslog is a messaging standard implemented by just about all network-connected devices, so the EventLog Analyzer just needs to listen on the network for all Syslog-compliant messages sent out by the equipment connected to it. Each message contains a header that identifies its origin. That enables the Event Log Analyzer to build up a list of all hardware on the network and list alerts and status reports by IP address/origin.
The ManageEngine dashboard includes a lot of functionality that enables you to specify actions to perform on the collected Syslog data. A typical Syslog server requirement is to write all records to event logs. This action is available, but you can also query records in the dashboards and sort and filter messages. Archived logs can be compressed and encrypted. The encryption enables access rights to be imposed on user accounts, so the visibility of the data in Syslog files can be restricted to just a few network users with admin rights.
Who is it recommended for?
The EventLog Analyzer system is suitable for use by businesses of all sizes. Very small businesses should take up the offer of the Free Edition, which is limited to collecting logs from five sources.
Pros:
- Offers a limited freeware version, good for smaller businesses
- Works seamlessly with other ManageEngine tools, fits well into their environment
- Can apply bulk actions to log data making it a good fit for enterprises and larger networks
- Archived logs can be encrypted and have access rights applied to them, helpful in team environments
Cons:
- The platform has a large number of features and options which can take time to fully learn and implement
The EventLog Analyzer can also monitor SNMP messages. ManageEngine produces a comprehensive network monitoring system, called OpManager. A Free Edition of this tool is available allowing up to 5 log sources only. You can also download a 30-day free trial of the Premium Edition. For more pricing options, you can contact their sales team.
ManageEngine EventLog Analyzer
Download 30-day FREE Trial
4. Site24x7 Server Monitoring (FREE TRIAL)
Site24x7 is a cloud-based platform of system monitoring tools. The services are sold in bundles of monitors and management tools and all include the Log Manager.
Key Features:
- Syslog collector
- Consolidates Syslog Windows Events, and application logs
- Log file viewer
- Log analysis tools
Why do we recommend it?
Site24x7 offers packages of monitors and services on a cloud platform. While monitoring networks and servers, the bundles also includes log collection that consolidates different formats of log messages, including Syslog and Windows Events. The great thing about this package is that you effectively get log management added for free to a full system monitoring package.
The Site24x7 Infrastructure plan is one of those bundles. IT offers networks, server, application, and website monitoring utility as well as the Log Manager. This system is almost entirely based in the Cloud. However, it requires an agent program to be installed on the monitored system. There is a version of the agent for Linux and another for Windows Server. Whichever version gets installed, the system can collect Syslog messages because it is able to gather data across a network.
The agent program uploads data, including Syslog messages, to the Site24x7 server for processing. The server puts all of the log messages that it receives into a common format and then files them. The standardization of message formats allows log messages gathered from different sources to be analyzed together.
The Site24x7 dashboard includes a log file viewer that has a number of data analysis tools built into it. These tools include the ability to search, sort, filter, and group messages.
Who is it recommended for?
Any business of any size would benefit from the Site24x7 service. The platform is based on the cloud, so you don’t need to install or maintain any software on your site. This means that even own-run businesses with free staff and no technical expertise can get log management sorted out.
Pros:
- One of the best platforms in terms of log visualization
- Offers numerous templates and configurations that make the platform plug-and-play
- Operates as a cloud service, lowering infrastructure costs and makes scaling easy
- Log collector agent is available for both Windows and Linux
- Pricing is based on data processed and retention rates, making this a viable option for both large and small businesses
Cons:
- Site24x7 is a more detailed platform designed for professionals, not the best fit for hobbyists or home users
The Site24x7 Infrastructure plan costs $9 per month when paid annually and it includes a log message processing allowance of 500 MB per month. This allowance can be upgraded for a fee: 10GB at$10 per month, 100GB at $95 per month and 1TB at $900 per month.
Site24x7 Infrastructure is available for a 30-day free trial.
Site24x7 Server Monitoring
Start 30-day FREE Trial
5. FirstWave opEvents (FREE TRIAL)
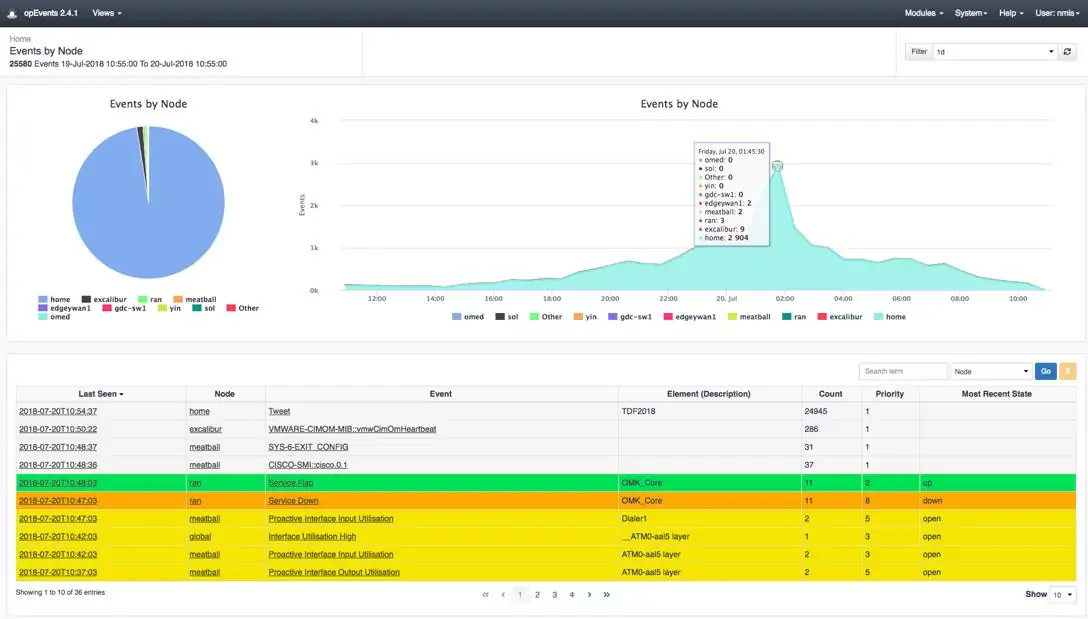
FirstWave opEvents is a Syslog collector that is also able to collect Windows Events and log messages from applications. The opEvents service will consolidate log messages from all sources by converting them into a common format before storing them in files.
Key Features:
- Consolidator for Syslog and other log sources
- Manages log files
- Data viewer
- Alerts on log message arrival rate
Why do we recommend it?
FirstWave opEvents is a good option for those who want to run log management on a Linux computer. This system isn’t limited to Syslog because it will collect other formats and merge them all into a common format. This enables the messages to be searched and sorted. The package will also store log messages in files.
The system rotates files and gives them meaningful names, storing them in a logical directory structure so that individual log messages can be located manually. The dashboard for opEvents shows the arrival rate and sources for all messages as they are processed and it is possible to place performance expectation thresholds on this arrival rate. If log messages stop arriving or arrive at a faster or slower rate than expected, the system will raise an alert.
The dashboard also includes a data viewer. You can load in log files and then sort, group, and search through them, creating manual analysis queries. These queries can be stored so they can be applied to other files.
Who is it recommended for?
The FirstWave opEvents system is recommended for businesses of all sizes. Small businesses would particularly benefit from this package because they can use it for free while also using the free network monitoring system.
Pros:
- Features simple yet informative visualizations of your log events
- Great user interface – sleek and easy to navigate
- Offers power log consolidation, great for pulling data from diverse sources
- Alerts can be configured if events haven’t been pulled at a specified rate
- Solid alternative to cloud-based solutions
Cons:
- Does not offer a cloud version
The FirstWave system is centered on the Network Management Information System (NMIS), which is a free, open-source system. You have to install NMIS first because opEvents is an add-on and not a standalone service. opEvents is free for networks of up to 20 nodes. Both packages install on Linux. It is possible to install it on Windows over an FirstWave hypervisor. The full version of opEvents is a paid service and you can get it on a 30-day free trial.
FirstWave opEvents
Start 30-day FREE Trial
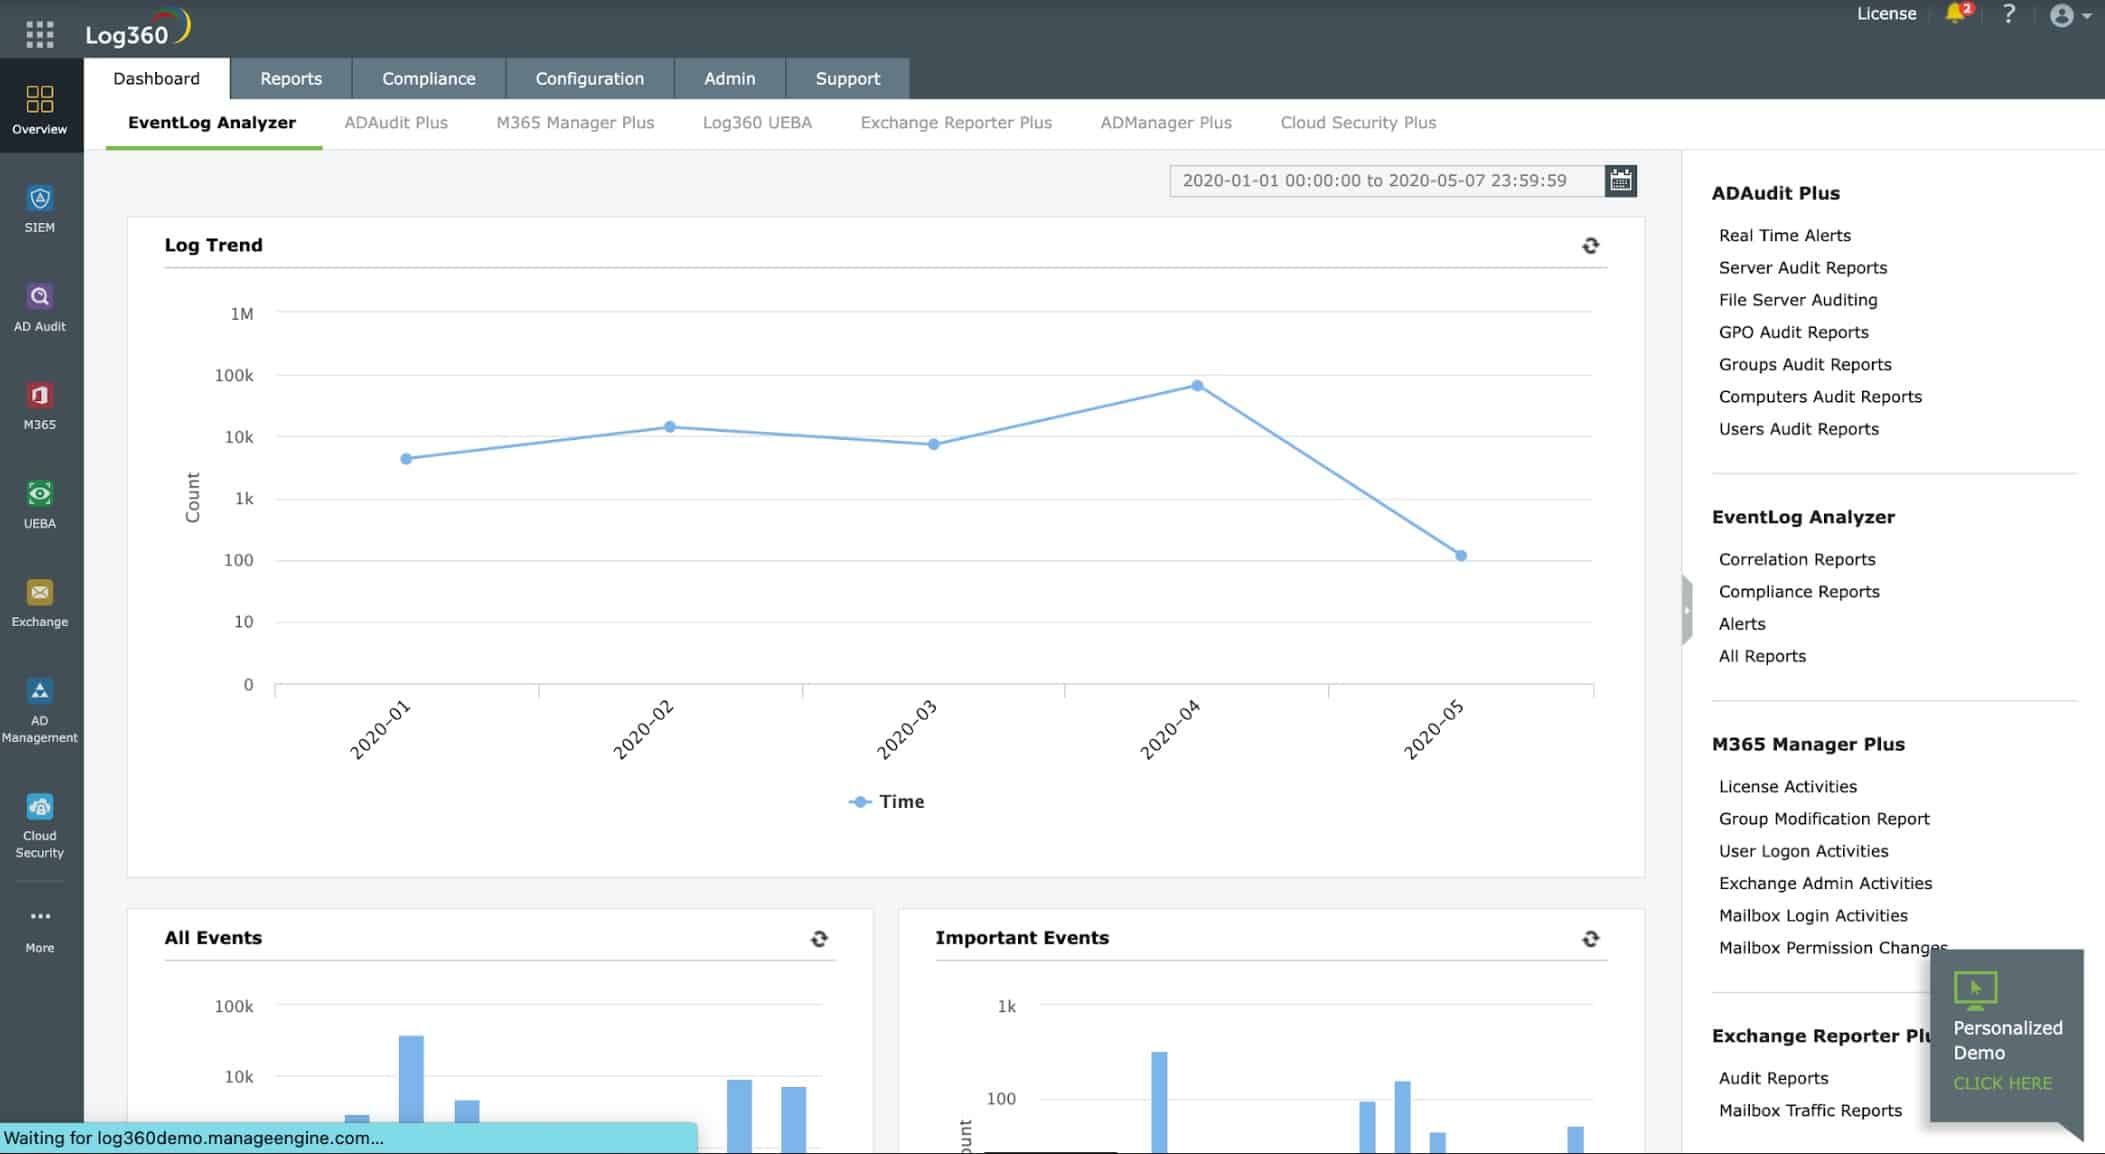
6. ManageEngine Log360 (FREE TRIAL)
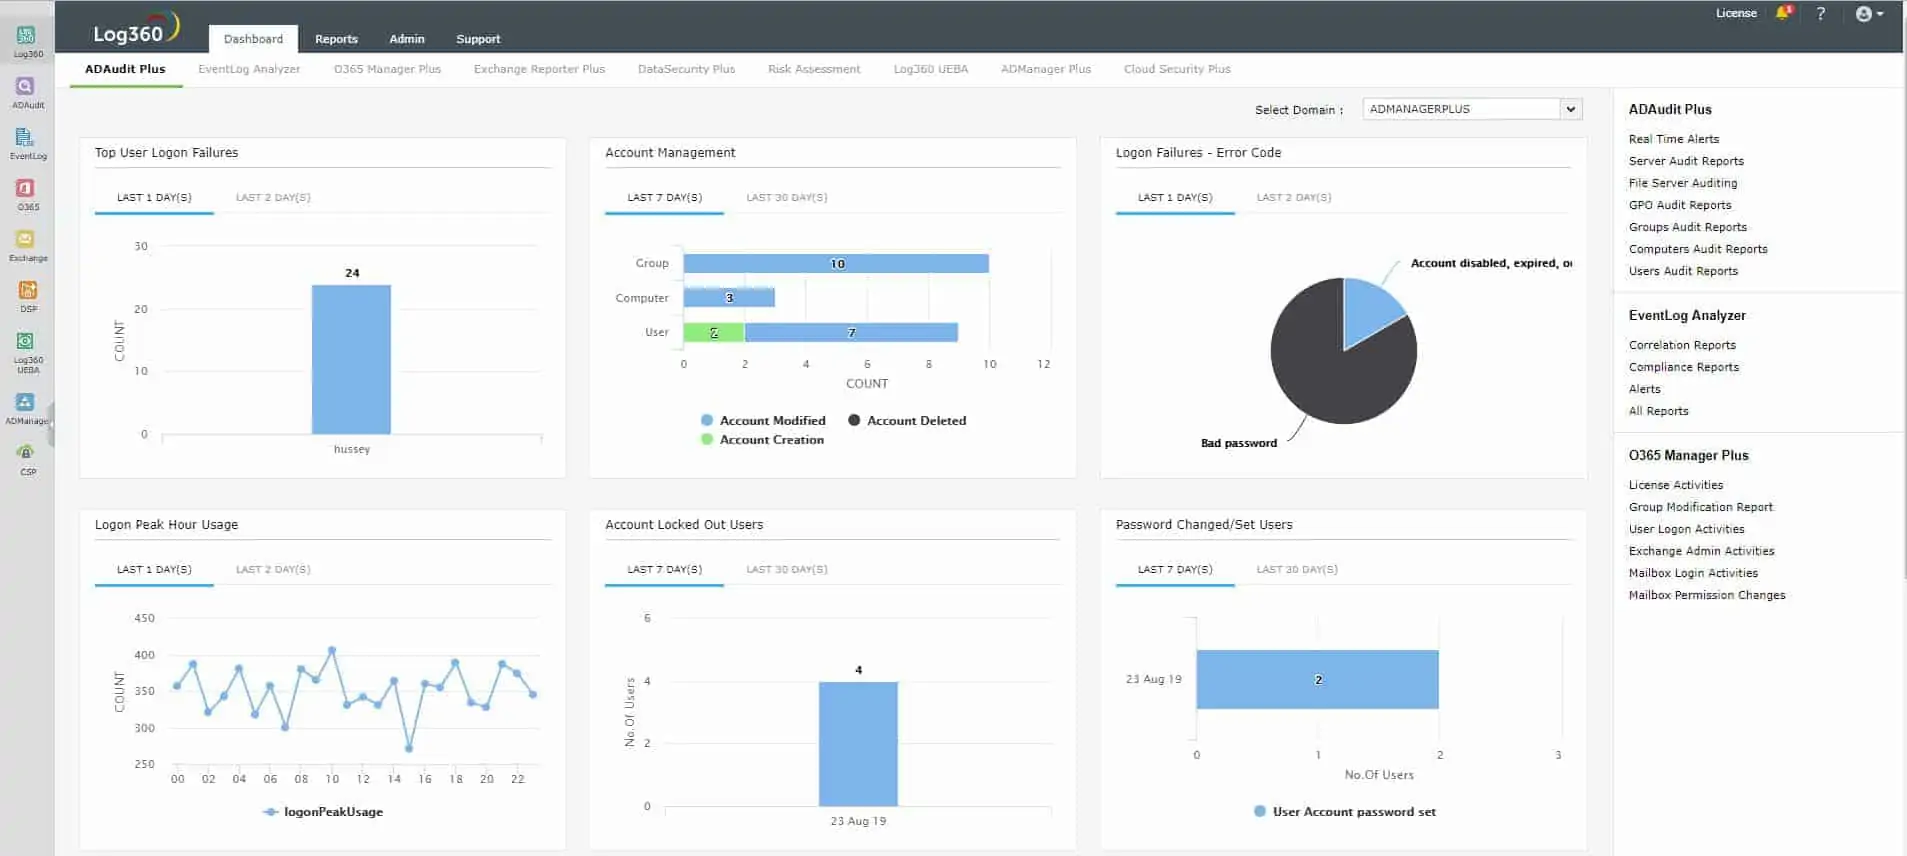
ManageEngine Log360 is a SIEM system that also acts as a log manager – those logs are the source data for the SIEM. This software package installs on Windows Server. However, it is able to collect Syslog messages from computers running Linux. It is also able to collect logs from computers running macOS and Windows. The different log messaging standards produce different message layouts, so the log manager in Log360 converts all of the messages that it receives into a common format.
Key Features:
- Merges logs from Windows Events and Syslog
- Gathers logs from software packages
- Data viewer
- Log processing statistics
Why do we recommend it?
ManageEngine Log360 is a very large package that includes many of the log-related systems offered by ManageEngine. Among these is the LogEvent Analyzer, which both collects and searches log messages. The system consolidates log messages of different formats, including Syslog and Windows Events.
The log messages can be viewed within the console as they arrive and they are also filed. The data viewer can recall a file for analysis. While manual analysis is possible, the system’s main value is its automated SIEM scanning.
The SIEM service identifies anomalous behavior. In order to do this, the service establishes a framework of normal behavior through the deployment of user and entity behavior analytics (UEBA). Differences from the standard trigger an alert. You can adjust the threshold for alert generation. Alerts can be fed through service desk ticketing systems, including ManageEngine ServiceDesk Plus, Jira, and Kayoko.
Who is it recommended for?
ManageEngine Log360 is a very comprehensive package with many utilities in it. A small business that doesn’t have a dedicated systems administrator would probably find that they just don’t have the time to even set up all of the utilities. So this bundle is a better choice for large organizations that have a team of system management technicians.
Pros:
- Gathers logs from more than 700 software packages
- File integrity monitoring
- Log management for Windows Events and Syslog
- Coordinates with service desk tools
Cons:
- Not available as a SaaS package
ManageEngine Log360 is available in a Free edition to monitor up to 25 endpoints. The Professional edition is available for a 30-day free trial.
ManageEngine Log360
Start 30-day FREE Trial
7. Syslog Watcher
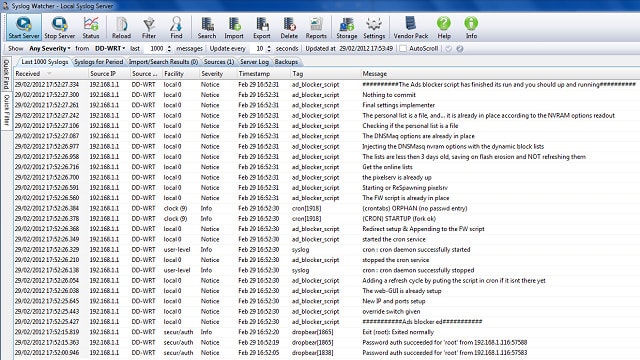
Syslog Watcher from EZ5 Systems is available for installation on Windows. This is a free Syslog server program with several extra Syslog monitoring features. As just about every device connected to your network sends out Syslog messages, the Syslog server has to work fast if you want it to do more than just collect and write those messages to a file. Syslog Watcher uses a multithreaded architecture, so the Syslog collection of new records isn’t held up by the completion of processing.
Key Features:
- Collects Syslog messages
- Writes to files or a database
- Free to use for home use
Why do we recommend it?
Syslog Watcher is a free Syslog server that runs on Windows. This is a big advantage for companies that have Linux machines and run applications that use the Syslog format but want to centralize all log management on a Windows computer.
The control dashboard gives you options on how to process messages. You aren’t limited to storing them in files because you have the option of writing them to a database. Getting your Syslog messages in a database gives you a lot more power to deal with event records because you can sort, filter, group, and count them. It allows you to combine events to generate customer alert conditions. You can get alert messages sent to you by email through the Syslog Watcher.
Syslog Watcher can monitor messages both over UDP and TCP, and it can operate with both the IPv4 and the IPv6 address systems.
Who is it recommended for?
There is nothing to stop businesses from using the Free Edition of Syslog Watcher. The main problem users of this version might encounter is that it is limited to dealing with three concurrent connections. As many applications generate Syslog messages almost constantly, managing the flow of messages to open and close connections could end up being a complication that isn’t worth the bother when the paid version is available at a low price.
Pros:
- Uses multi-threading for faster more efficient log processing
- Allows you to write logs to a database, good for larger volumes of data that need reviewing
- Allows monitoring over UDP or TCP, giving your more port options than other tools
Cons:
- Interface feels cluttered with a high volume of logs
- Could use better event visualization features
UPDATE: Syslog Watcher is free for home use. Business users have to pay for the tool. However, EZ5 Systems offers a 30-day money-back guarantee. So, if you want to try it out for free, just use it for a month and then ask for your money back.
8. The Dude
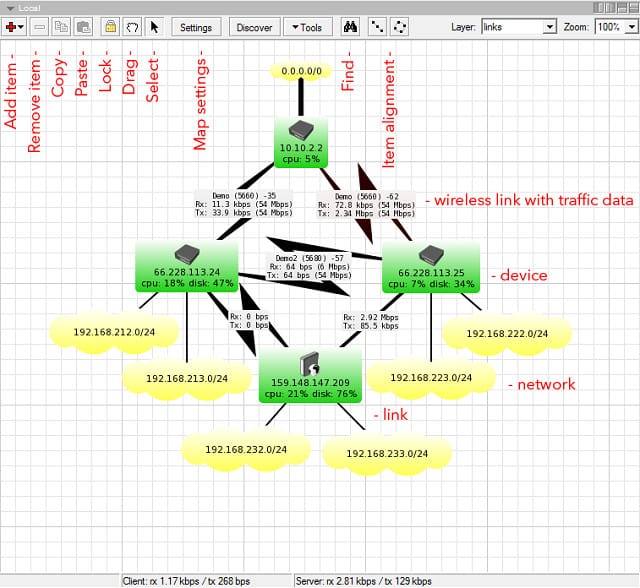
The Dude is a very widely used free network analysis tool that includes Syslog server functions. This app can be installed on any Windows version from Windows 2000 on, all flavors of Linux, and macOS. This tool is produced by MikroTik, a router manufacturer from Latvia.
Key Features:
- Collects Syslog messages
- Forwarding and filtering
- Free to use
Why do we recommend it?
The Dude Syslog server is part of a network monitoring and analysis tool that is free to use. The Syslog server can be used to file or forward Syslog messages. The only problem with this is that the tool doesn’t handle other formats of log messages.
This system can monitor your network devices and collect Syslog data. It can process SNMP alerts, plus ICMP and DNS traffic. The Dude can monitor TCP traffic as well as UDP. The network monitoring features include autodiscovery and a network topology mapper.
The Syslog functions of The Dude can be accessed from a tab in the interface. The system can operate as a full Syslog server with extra forwarding and filtering capabilities. You can get The Dude just to send all records to a file, or specify rules to divert qualifying messages to other destinations, which might be separate event logs or the console of the system. You can also drop individual records and get the system to beep, flash, or display a popup message for custom alert conditions.
Who is it recommended for?
The Dude runs on Windows, so if you want to gather Syslog messages and file them on your Windows server, this is a good choice. You would need to forward messages to another server in order to consolidate Syslog messages with other log types.
Pros:
- Installs on Windows, Linux, and Mac, making this one of the most flexible options for syslog servers
- Can ingest SNMP alerts, ICMP requests, and DNS queries, giving you a wide variety of log collection options
- Utilizes autodiscovery for network mapping and device identification
- Supports log forwarding to other servers or applications
Cons:
- Not as lightweight as some other simple syslog servers
- Interface can be challenging to learn
The Dude performs actions when it detects a given alert condition, including the execution of commands. The Dude can send you an email or make a spoken announcement upon the detection of a custom alert condition.
9. Visual Syslog Server
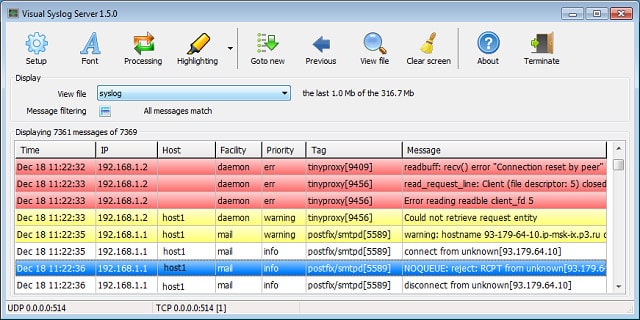
Visual Syslog Server is a small utility that collects Syslog data and displays them in a viewer. The records can also be written to event logs and rotated by date or file size. This application can be installed on Windows and it is available for free. The software can be installed on Windows XP and above and also on Windows Server 2003, 2008, and 2012.
Key Features:
- Collector of Syslog messages
- Data viewer
- Free to use
Why do we recommend it?
Visual Syslog Server collects Syslog messages, which are usually generated on Linux systems but this tool runs on Windows. So. this is a great tool to get your Syslog messaging over to the Windows operating system and file them. The utility includes a data viewer that lets you filter and sort messages.
In the dashboard, records are color-coded with error messages in red and warnings in yellow. Those colors can be customized. You get real-time views of the messages and you can also load records into the viewer from files.
Although this utility doesn’t have sophisticated graphics or message processing options, it is lightweight and fast, so it has a market. The viewer presents records and allows you to filter them and sort them. The interface can be set to play a sound when an alert condition is encountered. You can also set the application to send you an email when it encounters an alert or a warning. If your email system supports encryption, Visual Syslog Server will encrypt the notification emails that it sends to you.
Who is it recommended for?
Visual Syslog Server is free to use, so it will appeal to small businesses. You can set it up to provide you with alerts on factors such as throughput level variation or for the arrival of specific message codes.
Pros:
- Simple interface – utilizes color to aid in log prioritization
- Powerful filtering options work quickly and are easy to learn
- More user friendly than other tools
Cons:
- Better suited for smaller networks, features don’t work as well at scale
- Lacks event visualization
- Alert notifications are limited
This is a handy, free, ready to use strong Syslog tool that gets the job done.
10. Nxlog
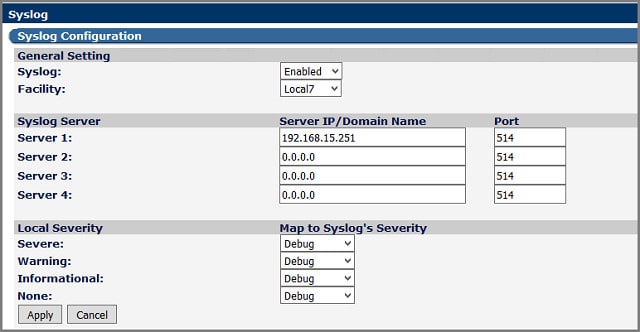
This review includes Syslog server programs that can be installed on Windows and/or Linux. Nxlog can be installed on either of those operating systems and also on Unix and Android. Whichever operating system you install this system on, it will be able to collect Syslog data from all the others — Unix, Linux, Windows, and Android.
Key Features:
- Suitable for Windows, Unix, Linux, and Android
- Multithreaded architecture
- Free to use
Why do we recommend it?
NXLog is a paid tool but we recommend its free counterpart, which is called the NXLog Community Edition. This service is able to connect Windows Events as well as Syslog. It will consolidate these different log files into a common format. You can set the system to file log messages or forward them to another log processor.
Nxlog is a straightforward message collection system. It can operate over UDP and TCP and it can receive messages protected by TLS encryption. Messages get written to files and can also be stored in databases. In all cases, Nxlog creates a standard record format that unites data from disparate sources. A multithreaded architecture enables this tool to handle hundreds of thousands of messages per second, making it suitable for all sizes of a network.
Who is it recommended for?
Any business could use NXLog Community Edition but it does need a little setting up, so very small businesses with no technical skills on site might struggle. Very large companies that require professional support guarantees with their software purchases should consider the NXLog Enterprise Edition.
Pros:
- Supports Windows, Unix, Linux, and uniquely Android as well
- Lightweight application – uses very few resources
- Multi-threaded architecture enables the tool to process large volumes of data
- Completely open-source and free
Cons:
- Interface is barebones, lacking many features found in similar tools
- No event visualization
The Nxlog system is open-source and you can use it free of charge. There aren’t any analytical functions in this tool, so if you want to view records or manipulate them in any way, you will need to find a separate front end for analysis. This is a straightforward message collection and logfile creation facility, making it a pure Syslog server.
11. Logstash
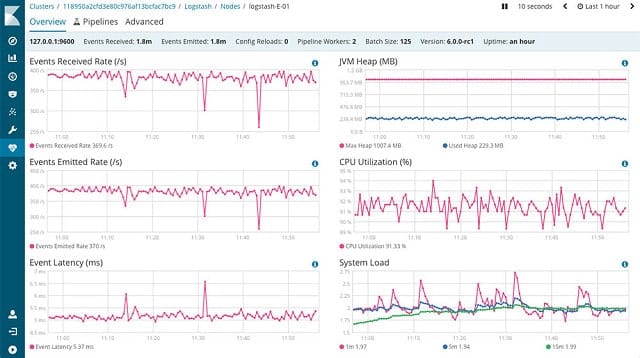
Logstash is part of a suite of utilities called “Elastic Stack.” This group of tools is produced by a group of developers whose first product is called Elasticsearch. Elasticsearch is a second element in the Elastic Stack, as is Kibana. The division of labor between these three packages is that Logstash collects log messages, Elasticsearch enables you to sort and filter those messages for analysis, and Kibana interprets and displays the data. All of the Elastic Stack programs run on Linux.
Key Features:
- Part of the ELK stack
- Collects from cloud platforms
- Free to use
Why do we recommend it?
Logstash is a very powerful log processing system and it is part of a suite of tools, called the Elastic Stack, or ELK. Using Logstash, you can collect and consolidate logs in Syslog and Windows Events formats as well as many application logs. This tool can also collect log messages from cloud systems, including AWS, Salesforce, and Twitter.
Kibana makes a great front-end for any of the other Syslog servers in this list. As the event message collection service for the stack, Logstash operates as a Syslog server. The utility listens on the network for messages sent from a wide range of sources. To record a specific stream, you need to install a plug-in for that data type. You can just install the Syslog plug-in, or add in other plug-ins to include other data sources.
Logstash also gathers data from cloud services including AWS. It can collect data from applications such as Ganglia, Salesforce, Graphite, Kafka, and Twitter. You can set the collection process to include TCP and UDP messages and it can receive messages encrypted with TLS. Logstash can read messages from a file, from a database, pick up SNMP messages, IRC and RSS feeds, and get messages from mail servers.
Who is it recommended for?
Logstash and all of the ELK product offer opportunities to build your own application with ease and there are many commercial adaptations of these tools out on the market. If you don’t know much about technology, the ease of use of these tools makes setting up Syslog collection very easy. Large corporations with technical staff should jump on this package. There is a paid, cloud version of the ELK suite available.
Pros:
- Great user interface, highly visual with easy to navigate toolbar
- Part of the Elastic Stack – leverages a large open-source community
- Supports gathering information from cloud sources like AWS
- Uses Elasticsearch for filtering, one of the most flexible search tools available
Cons:
- Must install plugins for every data type you collect
- No paid support option, bugs and issues are resolved by the community
Logstash can filter, divert, and reformat messages during processing. The program stores records in files or inserts them into databases. The utility is written to integrate with Elasticsearch and can send data directly to that application. Similarly, Logstash can be set to output data to Loggly, Nagios, AWS, Graphite, and Graylog. Other plug-ins will notify you of new log data by email or by Slack message. Logstash is available free of charge.
12. TFTPD32/64
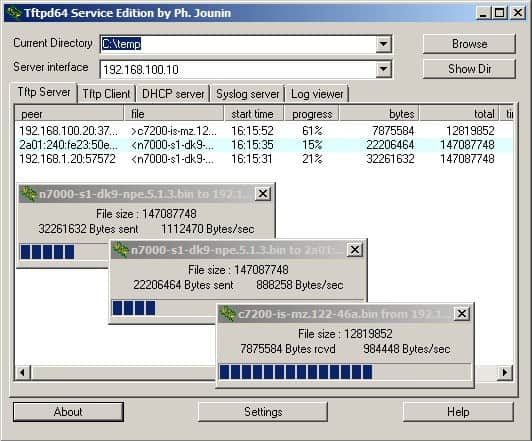
TFTPD is a small utility for Windows. The package is available as a 32-bit or a 64-bit application. The central element of this software is a TFTP client implementation. That client can be set to receive network messages from DHCP, DNS, and SNTP servers. It is also able to receive Syslog data.
Key Features:
- GUI and command line
- DHCP and DNS server
- Free to use
Why do we recommend it?
TFTPD is a free utility that runs on Windows and is nominally a client and server for use with the Trivial File Transfer Protocol (TFTP). However, the tool has other utilities built in and one of those is a Syslog server. Although this package includes a log viewer and a setting that will store Syslog messages, it doesn’t collect Windows Events and it can’t perform consolidation.
This is a simple open-source utility that displays messages in the dashboard as they arrive. Buttons over the viewer give you the ability to view messages by type and Syslog is one of the message types that can be featured. You see messages as they travel on their way to event logs and the viewer also names the file that Syslog messages should be stored to. This utility doesn’t give you much functionality for data analysis. However, you can also read in records from a file and then you have the ability to sort and filter messages.
Who is it recommended for?
TFTPD is a handy free utility for a system administrator to have to hand. However, the tool is getting a little dated and there are more powerful free Syslog servers on this list that provide more features.
Pros:
- Lightweight alternative to other more modern options
- Can be used in other capacities since its a TFTP server
- Available for free
Cons:
- No data analysis tools
- No event visualizations
- Outdated user interface
TFTPD can work with IPv6 addresses as well as IPv4 addresses. TFTPD32 and TFTPD64 are both available for free.
What you need to know about Syslog Servers and Clients
The concept of a “Syslog server” really refers to an application that deals with syslog messages rather than the provision of a dedicated computer to receive the messages. So, don’t get misdirected by that “server” word in there.
The server/client model is a little difficult to grasp in Syslog terms, too. Usually, the client contacts the server and the server responds. In syslog, the syslog client is just a program that broadcasts error, warning, and debugging messages. The syslog client doesn’t have any direct contact with a counterpart: it sends out the messages whether or not anyone is listening for them. Syslogd is a daemon. This is a Syslog collector and so is judged to be the server, even though it never responds to the originator of the messages. The daemon may be running locally, or it can also be implemented as a remote syslog server by connecting over the internet.
Although the Syslog standard has been codified by the Internet Engineering Taskforce, there are so many implementations of Syslog that some variation in the syslog data message format exists. With all of the different message types you could be benefiting from, you need to get a tool to sort through them all.
The definition of the Syslog standard is freely available to the public but it is not regarded as an “open source project.” This is because “open source” refers to freely available program code, but Syslog is a standard, rather than a program. However, there are open source Syslog server implementations out there.
Syslog and Windows
The Syslog standard was written for Unix and it is also available for Unix-like operating systems, including Linux and Mac OS X. Syslog is also used by many network devices for error reporting. Syslog doesn’t operate on Windows. The Windows operating system has its own log messaging system, called Events.
The division of log systems between Windows and Linux into two separate and incompatible standards shouldn’t cause you a problem. You can unify these log file messages in one central location so security software, such as intrusion detection systems can get a system-wide view of events.
Network equipment will automatically broadcast Syslog messages on the network. That means that any device can pick the messages up. The Syslog standard specified that log messages should be circulated to UDP port 514 or TCP port 1468. The destination of messages on a Linux server is dictated by the syslogd or syslog-ng configuration file. These can be directed to the network on the well-known UDP or TCP port.
Once you have the Syslog messages circulating on the network, software running on Windows can pick them up, so you don’t have to stick to Syslog server software for Linux to collect these important messages. Many excellent Syslog servers are written to run on Windows.
Syslog Messages
Syslog messages can be regarded as the Linux/Unix equivalent of Windows Event Logs. So, you could refer to them as “Syslog events.” They supply the essential information and will support your system administration tasks through:
- Warnings of equipment failure – which get written to a log file
- Capacity exhaustion monitoring – through pre-set warning levels which you set yourself
- Alerts of unexpected events – abnormal activity may indicate compromised user accounts
- Network intrusion detection – spot unauthorized devices and access to unexpected locations on the internet
The records in your syslog files are written there because the producers of your software and devices judged certain events to be of significance, so it is a mistake to ignore this rich source of system activity and status information. So download a Syslog collector and activate it.
Syslog Port Numbers
Syslog operates over UDP, so expect activity on UDP port 514 of your network devices. This is caused by all of those Syslog event messages circulating around your network. UDP port 514 is used by Syslog clients to send messages and also by Syslog servers to listen for messages. Therefore it is both the source and destination port on all standard Syslog communications. Don’t close it. Be suspicious of activity on TCP port 514. This is a port known to be used by the ADM worm and it is not used for Syslog.
There are secure Syslog implementations. A secure Syslog service needs to establish a connection, you cannot use a UDP port for them. The secure version of Syslog is known as Syslog over TLS and it uses TCP port 6514. If you want to operate a remote Syslog server connecting to a network across the internet, you need to go the Syslog over TLS route because unencrypted Syslog events being sent over the internet would seriously undermine your network security.
Choosing Syslog server software
As you can see from the description of the tools in our list, you can choose a straightforward Syslog server, or opt for an analytical tool or a network monitoring system that incorporates Syslog server functions.
Beyond the basic functions of transferring Syslog messages to files, you can look for the capabilities to sort and filter messages. The ability to vary processing according to message types and drop debug messages and information notifications is useful. A programmer might need to see those debug messages, and so the ability to selectively direct message types to a viewer, a log file, or to a database can be very useful.
The evolution of Syslog processing to store records in a database rather than a file offers you great power. It is far easier to index, sort, search, and filter records in a database than it is to manipulate file records. This is because databases include a structured query language that enables you to isolate fields in records and perform selection, grouping, and exclusion functions on data without altering the original stored records.
Another useful advancement in the Syslog servers available today is a system that can collect messages generated by other platforms and protocols, such as the Windows event logger. If your Syslog server can create standardized record formats, that takes you another step further along the route to collect important information about your system.
Getting alerts created for the conditions reported by Syslog will also give you extra power to focus your energy on essential tasks. The ability to create your own alert conditions represents an advancement in Syslog processing. Sometimes, the contents of a message might not create concern. However, a sudden surge in the frequency of such messages should become an alert and you can specify such conditions in many of the Syslog servers listed in this full review. The ability to combine a count of message types or error conditions is another useful feature that many modern Syslog servers include.
A Syslog server embedded in a network centralized management tool can provide excellent analysis capabilities. If you already have all the analytical tools you need, then you would be better off focusing on the vanilla Syslog server tools in this review. However, if you have very little budget for system management software and you don’t currently have any analytical tools, then go for a free system management utility that includes a Syslog server to keep control of your IT infrastructure.
Managing IT services requires proper tools. Take a look at the free software recommended in this full review that fits your operating system. Our Editor’s choice is an excellent place to start and the SolarWinds Kiwi Syslog Server is a comprehensive logging tool. Take a little time to play around with each tool so you can discover their features for yourself. Given that all of these tools are free, you have nothing to lose but the time it takes to learn them.
Syslog Server FAQs
How do I access my Syslog server?
The access method for a Syslog server depends on your operating system and the specific Syslog server that you chose to install. On Linux, the Syslog server is more likely to be a command line utility. If you have a Linux flavor with a graphical interface, such as Ubuntu, you might be able to have a GUI Syslog server package.
GUI interfaces are very common for Windows-based Syslog servers. In these cases, the installer may well have created a shortcut icon on your Desktop. If you don’t see it there, click on the Start menu button and search through that list of available programs.
How do I create a Syslog server?
Syslog is a Linux utility, so it is better to create a Syslog server on a Linux machine:
- Install syslog-ng, which you can get from here. On Debian, you don’t need to download the utility. Instead type at the command line:
apt-get install syslog-ng
On RHEL, enter:
yum install syslog-ng
- Locate /etc/syslog-ng/syslog-ng.conf and make a backup of it then edit it. Alter the configuration settings so the options look like:
options {(off); flush_lines(10); use_dns(persist_only); use_fqdn(no); owner("root"); group("adm"); perm(0640); stats_freq(0); bad_hostname("^gconfd$"); normalize_hostnames(yes); keep_hostname(yes); }; - Create a listener with the flowing line in the configuration file:
source s_net { tcp((ip(127.0.0.1) port(1000) max-connections 5000)); udp (); }; - Set up a destination for the syslog messages. You can actually set up redirections for each source of message to different log file names. Here is an example line:
d_net_syslog { file("/var/log/syslog/remote/$HOSTNAME/syslog.log"); }; - Save the configuration file.
Those are the basic steps to start collecting Syslog messages and storing them to a file. You can get more sophisticated by adding in filters to direct messages to different files or add in explanations of each recorded event.
What is the default Syslog facility level?
The default Syslog facility level is Local4
How do I memorize Syslog levels?
The Syslog levels are:
- Emergency (0)
- Alert (1)
- Critical (2)
- Error (3)
- Warning (4)
- Notifications (5)
- Information (6)
- Debug (7)
Create a mnemonic to remember these. Take the first letter of each level type and make a memorable phrase with words that start with the same first letters. So, E, A, C, E, W, N, I, and D won’t make a meaningful word, but create a sentence that you can’t forget easily, put your name in there if it starts with one of those letters. Put in swear words, too so you will remember the phrase, but then make sure you don’t recite it out loud.
What is a Syslog server?
A Syslog server receives files sent by Syslog clients or sends out files in response to requests. The files are formatted following a protocol called Syslog, which defines the fields in each log message.