Содержание
- Способ 1: Журнал событий
- Способ 2: Сторонние приложения
- WinDbg
- BlueScreenView
- Вопросы и ответы
Способ 1: Журнал событий
Простой, но не самый удобный способ определения кода синего экрана, так как он предполагает выполнение дополнительных действий.
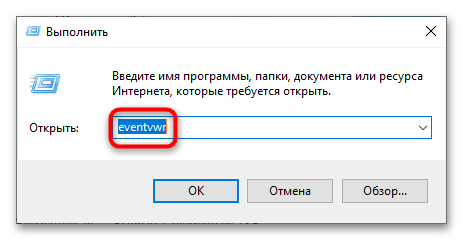
- Откройте системный «Журнал событий» командой
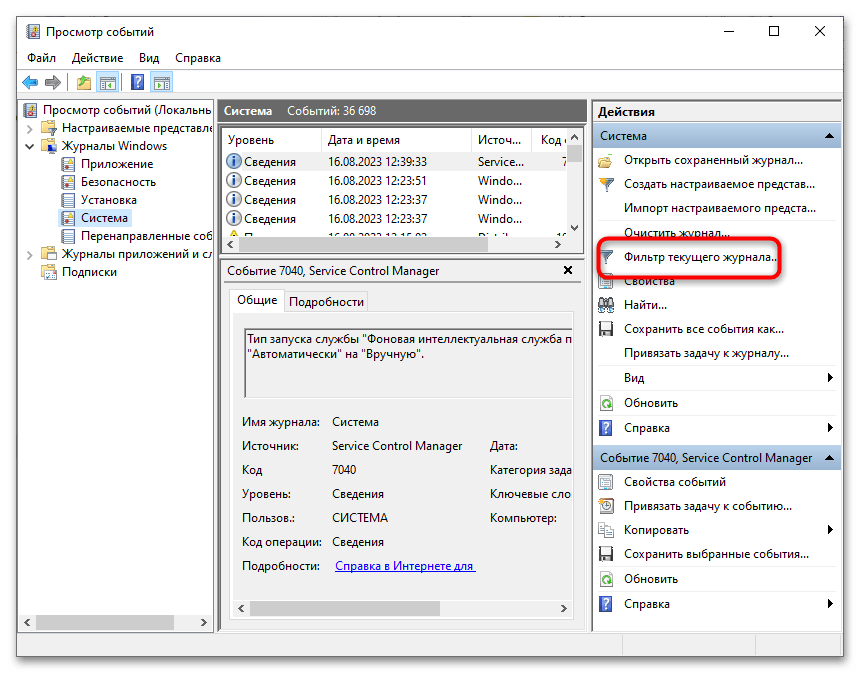
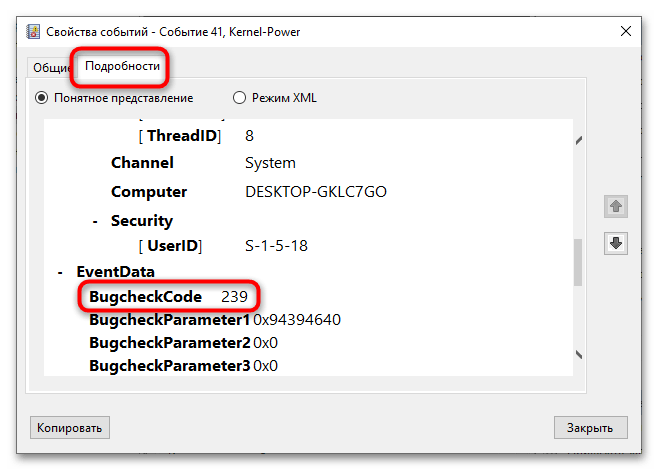
eventvwr.msc, выполненной в вызванном нажатием клавиш Win + R диалоговом окошке быстрого запуска. - Нажмите в правой колонке ссылку «Фильтр текущего журнала».
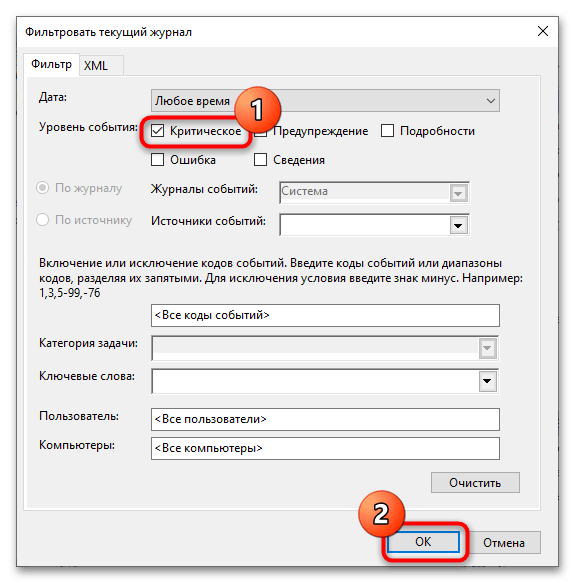
- В открывшемся окне отметьте флажком пункт «Критическое» и нажмите «ОК», чтобы отфильтровать события.
- Выберите последнюю запись об ошибке и откройте ее свойства двойным по ней кликом.
- Переключитесь на вкладку «Подробности», отыщите в списке параметр «BugCheckCode» и посмотрите его значение. Это и будет код ошибки в десятичном счислении.
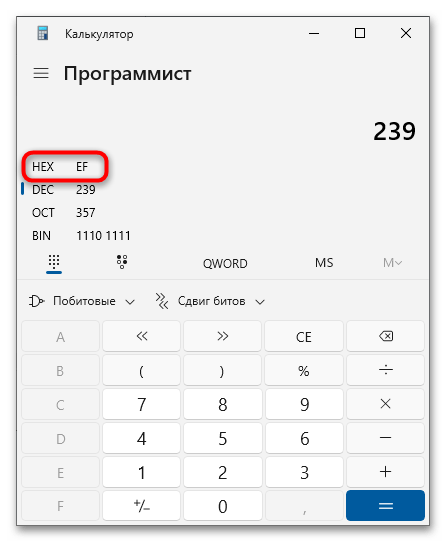
- Переведите его в шестнадцатеричную систему счисления, воспользовавшись штатным «Калькулятором» Windows, переключив его в режим «Программист» (через меню, вызванное нажатием по кнопке меню слева вверху). Результат будет указан в строке «HEX» без нулей, которые понадобится добавить. Например, EF = 0x000000EF.
Теперь можно выполнить поиск решения проблемы в интернете, указав полученный шестнадцатеричный код ошибки BSOD.
Способ 2: Сторонние приложения
Удобнее определять ошибку через специальные приложения, работающие с файлом дампа. По умолчанию его создание включено в Windows, но если вы отключали его создание вручную, то просмотреть стоп-код таким образом не получится из-за отсутствия файла для анализа сбоя.
WinDbg
Синий экран со стоп-ошибками в Windows 10 не отличается информативностью и нередко содержит только название ошибки, но не ее код. Чтобы определить ее код, необходимо проанализировать файл минидампа. Сделать это можно средствами фирменной утилиты Microsoft WinDbg.
Скачать WinDbg с официального сайта
- Скачайте приложение для анализа дампов с Microsoft Store или официальной страницы разработчика и установите.
- Запустите программу от имени администратора и нажмите в левом верхнем углу кнопку «Файл».
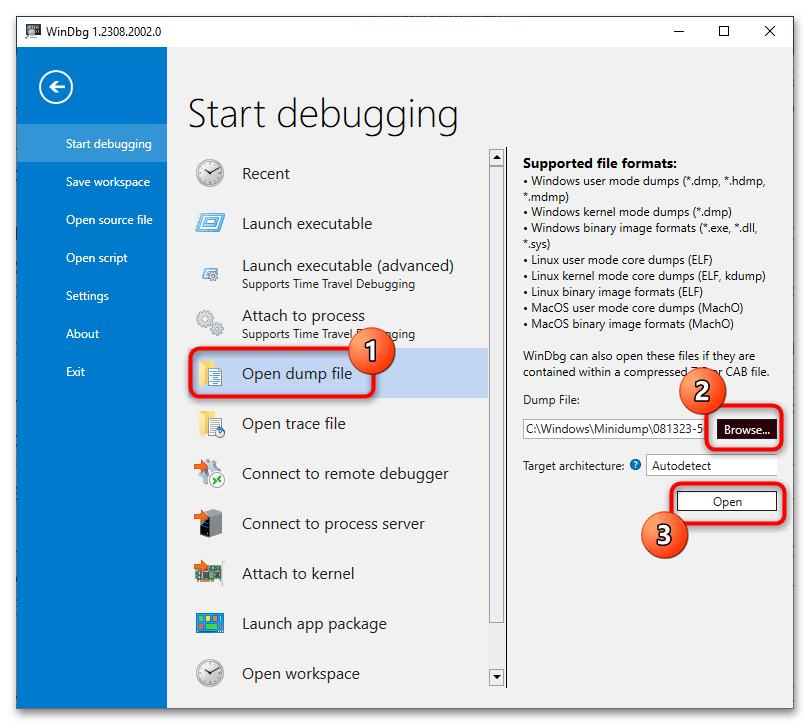
- Выберите в меню опцию «Open dump file», нажмите кнопку «Browse», укажите путь к анализируемому файлу дампа в папке
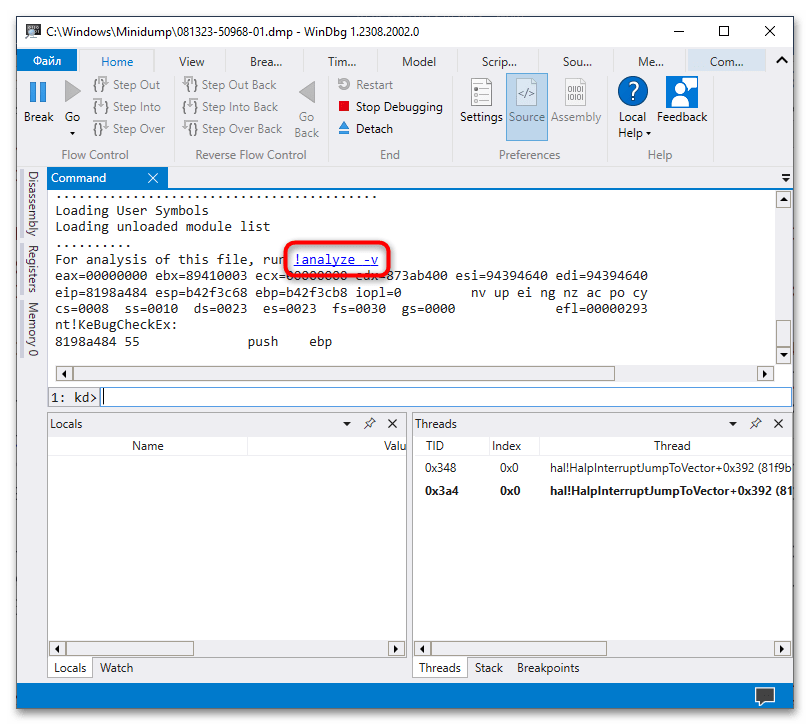
C:\Windows\Minidumpи нажмите «Open». Папка Minidump может содержать несколько файлов c расширением DMP, из них следует выбирать тот, который имеет название, соответствующее дате и времени ошибки синего экрана. - Прокрутите содержимое блока «Command» вниз, найдите ссылку «!analyze -v» и кликните по ней. Вместо этого можно вставить команду
!analyze -vв поле под блоком «Command» и нажать клавишу ввода. - Отладчик выполнит анализ файла дампа и выведет в блок «Command» подробные сведения об ошибке. Ищите ее название – код будет указан напротив него в полном или сокращенном виде, например 139, 0x139 или 0x00000139.
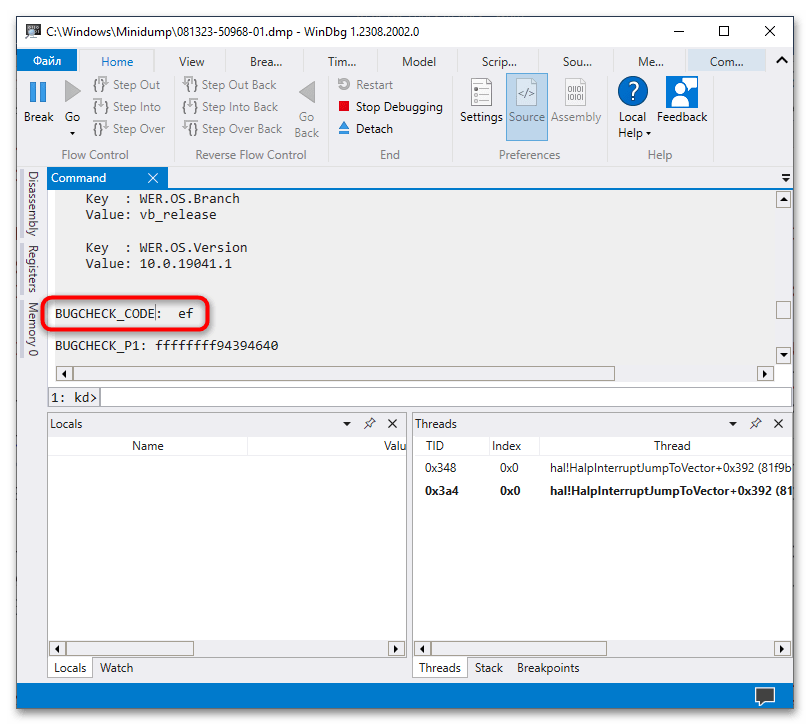
Кроме кода WinDbg позволяет получать множество других полезных сведений об ошибке, в частности аргументы и имя исполняемого файла, вызвавшего критический сбой.
BlueScreenView
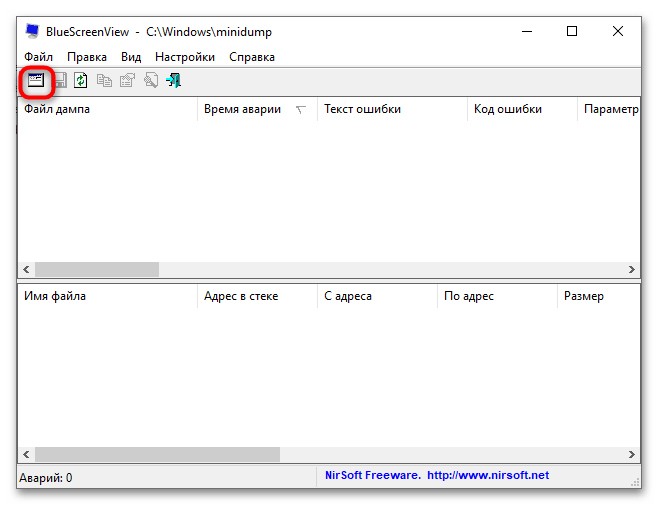
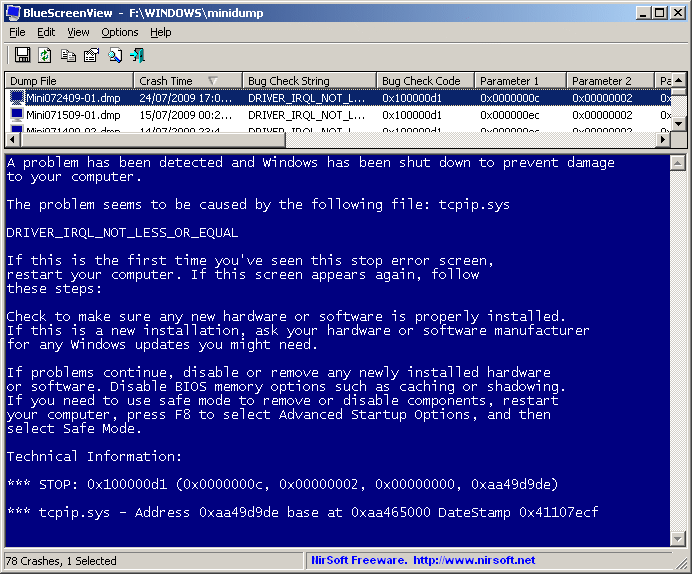
Для получения кода ошибки экрана BSOD также можно использовать стороннюю утилиту BlueScreenView. Она не настолько функциональна как WinDbg, но намного проще и меньше инструмента от Microsoft.
Скачать BlueScreenView с официального сайта
- Скачайте архив с утилитой с сайта разработчика, распакуйте его и запустите исполняемый файл. Там можно скачать и языковой файл — для русификации интерфейса поместите языковой файл в папку с исполняемым файлом «BlueScreenView.exe».
- По умолчанию утилита автоматически считывает все файлы дампов в папке
C:\Windows\Minidump, но если в вашем случае файл дампа находится в другом месте, откройте дополнительные параметры утилиты комбинацией клавиш Ctrl + 0. - В открывшемся окошке выберите пункт «Загрузить один файл МиниДампа» и укажите путь к файлу DMP.
- Просмотрите содержимое колонки «Код ошибки» — в нем будет указан искомый код в шестнадцатеричном формате.

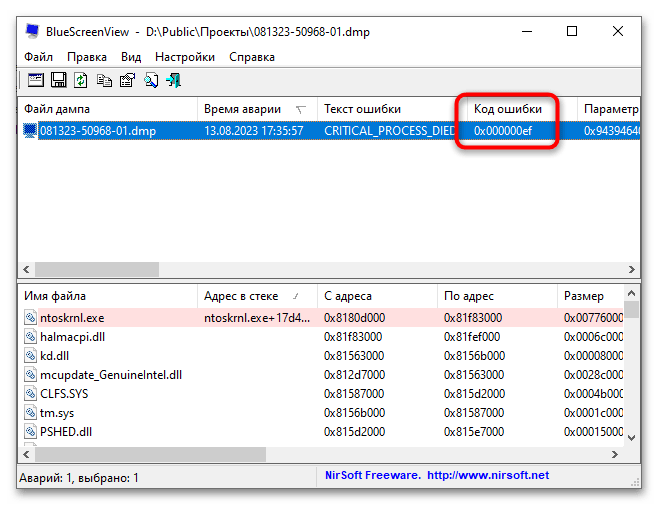
Помимо кода ошибки синего экрана, утилита BlueScreenView показывает сбойный драйвер, список связанных файлов, параметры, стеки адресов и другие отладочные сведения.
Еще статьи по данной теме:
Помогла ли Вам статья?
It’s important to find blue screen logs to fix the BSOD error. However, a great many people don’t know where to find the blue screen logs on Windows 11/10. Are you also trying to figure it out? This post from MiniTool provides 3 simple ways.
Why Need to View Blue Screen Logs
As it’s well known to us all, the blue screen of death (BSOD) is one of the most common errors that often occurs on Windows. There are many different BSOD errors, such as exFAT FILE SYSTEM, Hidparse.sys BSOD, etc. Besides, different BSOD errors might be caused by different reasons. To fix these blue screen errors, it’s necessary to get the root reasons by checking the blue screen logs.
However, a lot of people are unclear about how to check blue screen logs on Windows 11/10. To know more details, please keep reading the following part.
Where to Find the Blue Screen Logs on Windows 11/10
Where to find the blue screen logs on Windows 11/10? After investigating extensive user reports and references, we summarize 3 simple and free ways to find blue screen logs. Let’s start trying.
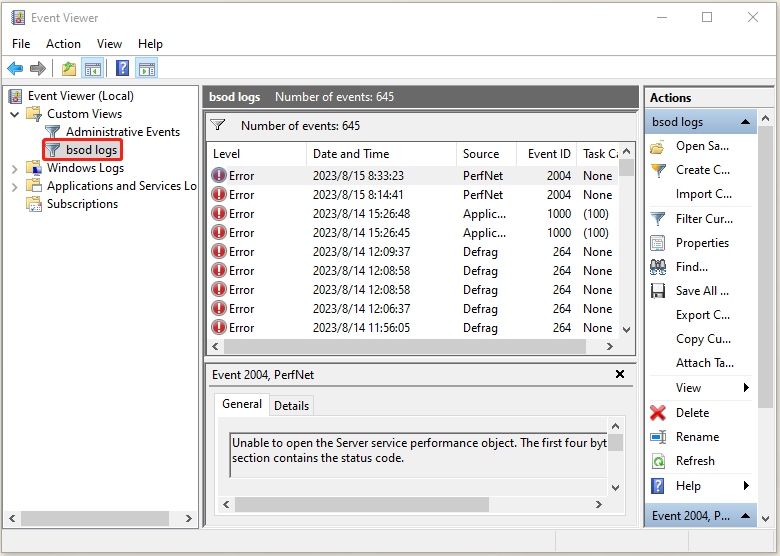
# 1. View Blue Screen Logs via Event Viewer
The first and simplest way how to check blue screen logs on Windows 11 is to use the event viewer.
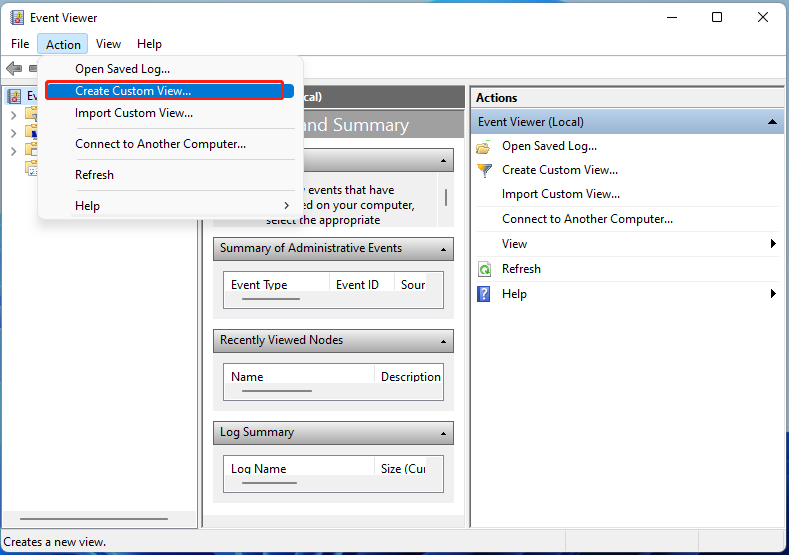
Step 1. Press Win + X keys and select Event Viewer from the right context menu.
Step 2. Go to the Action tab from the top menu and select Create Custom View.
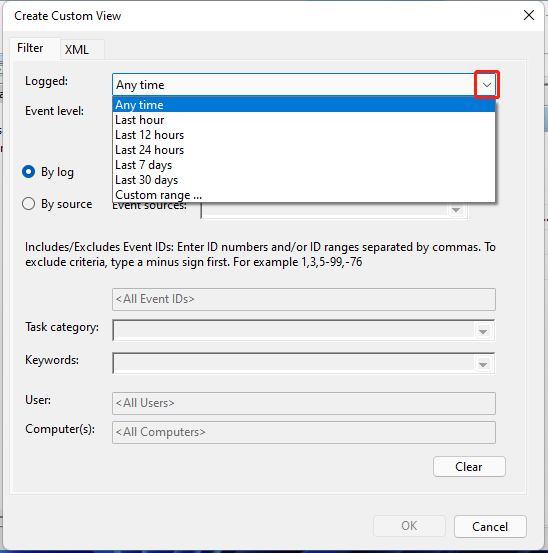
Step 3. Expand the Logged drop-down menu and select the time range when you encounter the BSOD error.
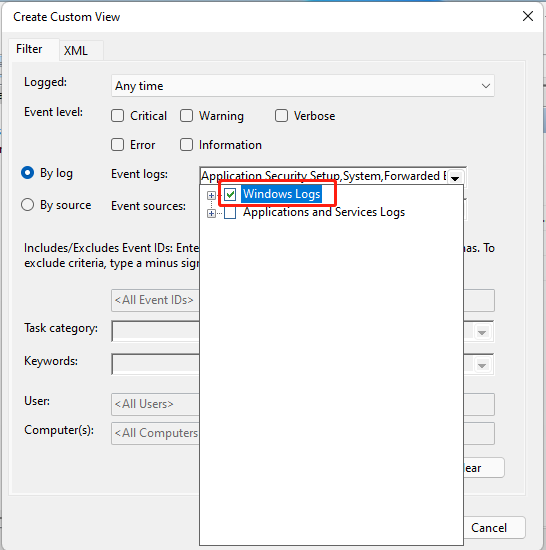
Step 4. Select the checkbox beside Windows Logs from the Event Logs drop-down menu. Tick the box of Error under the Event Level section.
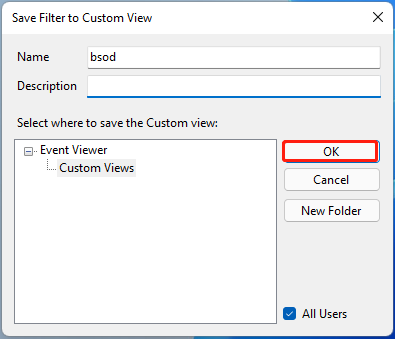
Step 5. Click on OK. Then you will be prompted to enter a name and description for the BSOD log. Enter the information and click OK.
Step 6. Once created, you should see a list of errors that occurred during the selected time. You can sort the BSOD logs in the date and time section. To check more details, check both the General and Details tab.
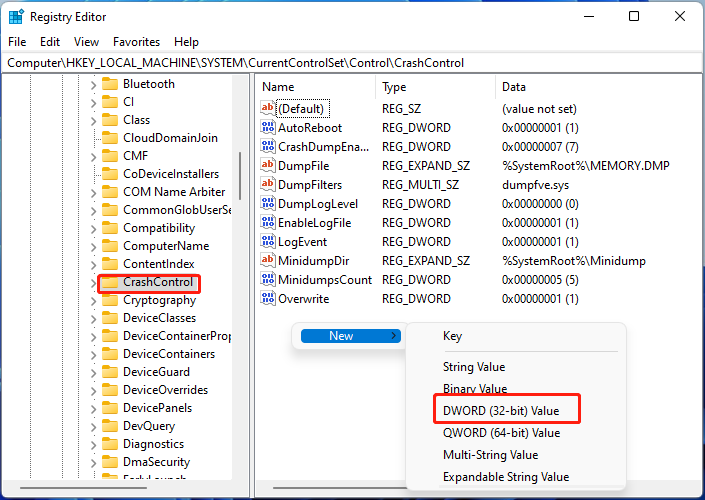
# 2. View Blue Screen Logs via Registry Editor
Windows Registry Editor is an advanced utility that allows you to view some important information about your hardware and software, including the blue screen of death logs. Here’s how to find blue screen of death logs using Registry Editor.
Step 1. Press Win + R keys to open the Run box, and then type regedit in it and press Enter. Click on Yes in the UAC window to further confirm it.
Step 2. In the Registry Editor window, go to the following path via the left navigation panel.
HKEY_LOCAL_MACHINE\System\CurrentControlSet\Control\CrashControl
Step 3. With the CrashControl folder selected at the left panel, right-click an empty space at the right panel and select New > DWORD (32-bit) Value.
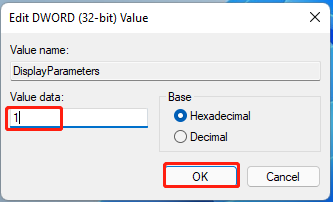
Step 4. Name the DWORD Value as DisplayParameters. Double-click to open it and change the Value data to 1 and click on OK to save the change.
Step 5. Once done, restart your PC and you should be able to check BSOD logs.
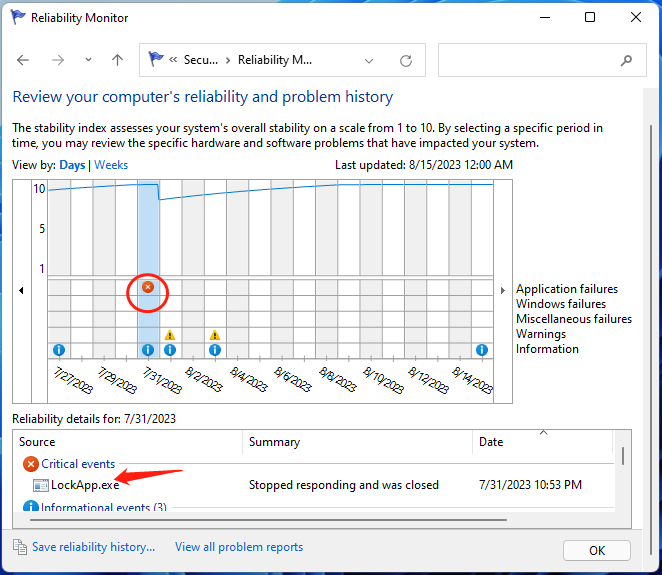
# 3. View Blue Screen Logs via Reliability Monitor
There is a utility called Reliability Monitor in Control Panel, which can be used to find blue screen logs. Let’s see how to check BSOD log using the tool.
Step 1. Open the Run box again, type Control in it, and hit Enter to open Control Panel.
Step 2. Click on System and Security > System and Maintenance in order.
Step 3. Expand the Maintenance category and click View reliability history.
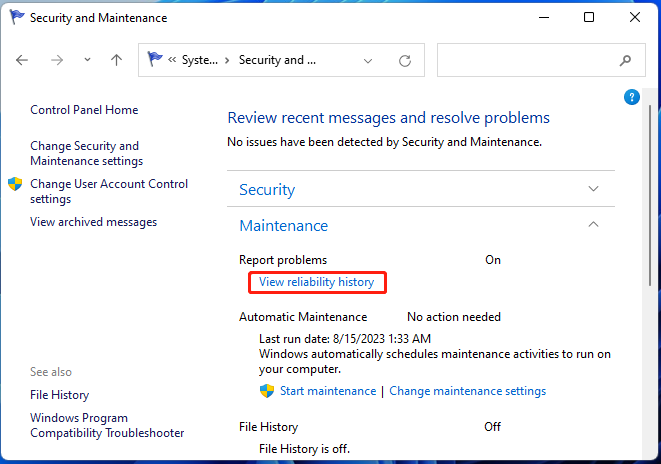
Step 4. Now, you should see a graph displaying the reliability information. Look for the red cross icons because they are critical errors like BSOD. To check blue screen logs, simply click on the event at the bottom.
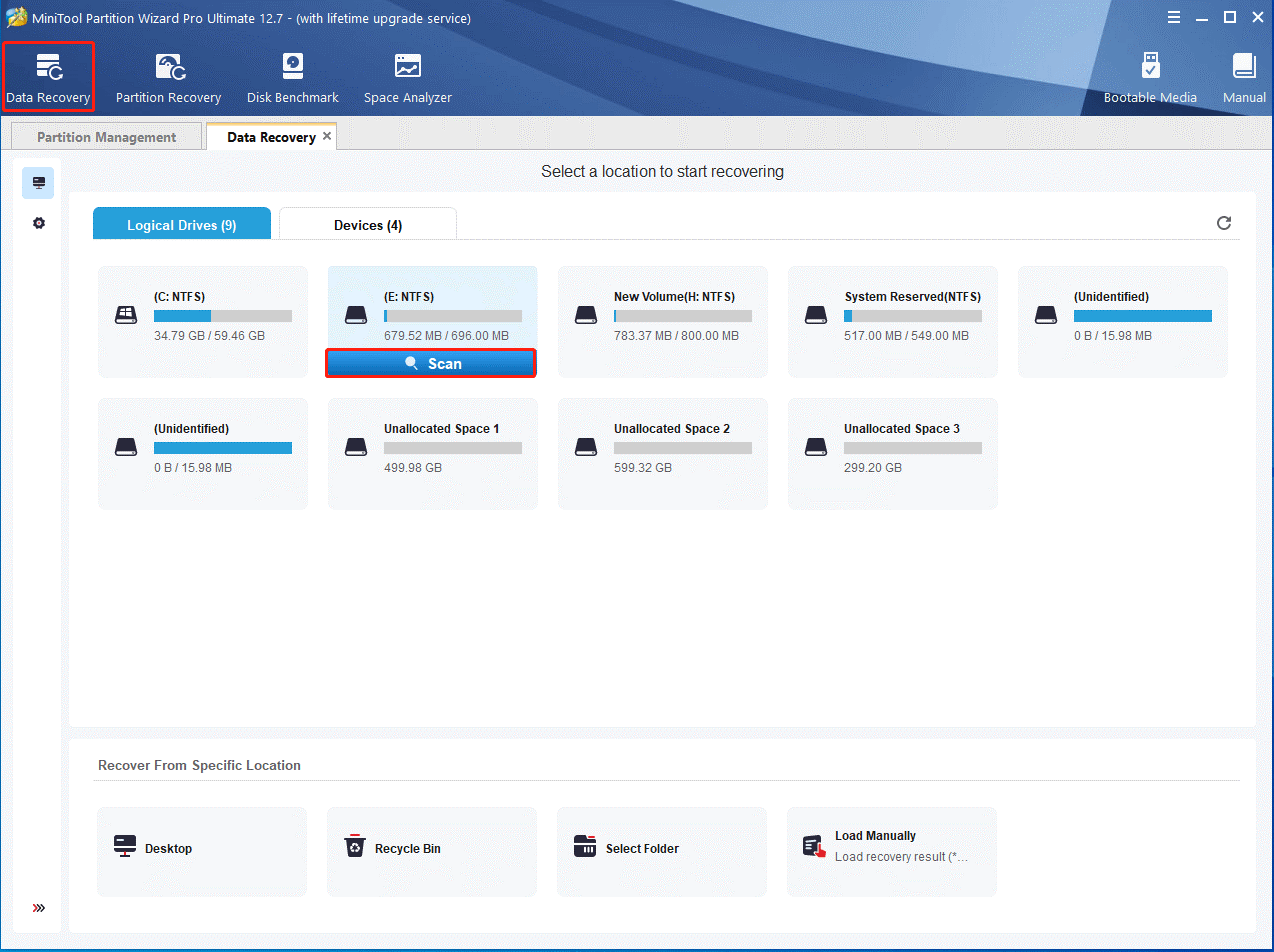
Bonus Tip: How to Recover Lost Data Due to BSOD Errors
According to user reports, lots of people experience data loss due to the annoying blue screen of death. Sometimes users may need to reformat their hard drive to fix the BSOD error, which also causes data loss. How to recover data from a hard drive on Windows 10/11? MiniTool Partition Wizard can help you do that easily and even search for your desired files when recovering.
Moreover, it is a powerful disk clone and partition manager that can migrate OS to SSD, extend/resize/copy partitions, convert MBR to GPT without data loss, change cluster size, check hard drive errors, etc.
MiniTool Partition Wizard DemoClick to Download100%Clean & Safe
Where to find the blue screen logs on Windows 11/10? Now, I believe that you already have known the answer. If you have better ways to find BSOD logs, please share them with us in the following comment zone.
 Обновление Anniversary операционной системы Windows 10 добавило в нее множество утилит и дополнительных программ, которые могут потребоваться пользователю. В том числе компания Microsoft ввела новое диагностическое приложение, которое позволяет определить причину возникновения «Синего экрана» — хорошо известной ошибки, которая приводит к перезагрузке компьютера. Если синий экран возникает часто, пользователю важно узнать, почему это происходит, после чего принять шаги для устранения проблемы.
Как узнать причину синего экрана (BSOD) в Windows 10
До обновления Anniversary на Windows 10 узнать причину возникновения синего экрана можно было только в системных файлах компьютера. Компания Microsoft стремится сократить количество взаимодействий между пользователем и системными данными PC, выпуская различные утилиты и диагностические приложения для определения синего экрана.
Чтобы узнать причину синего экрана в Windows 10 после Anniversary обновления нужно сделать следующее:
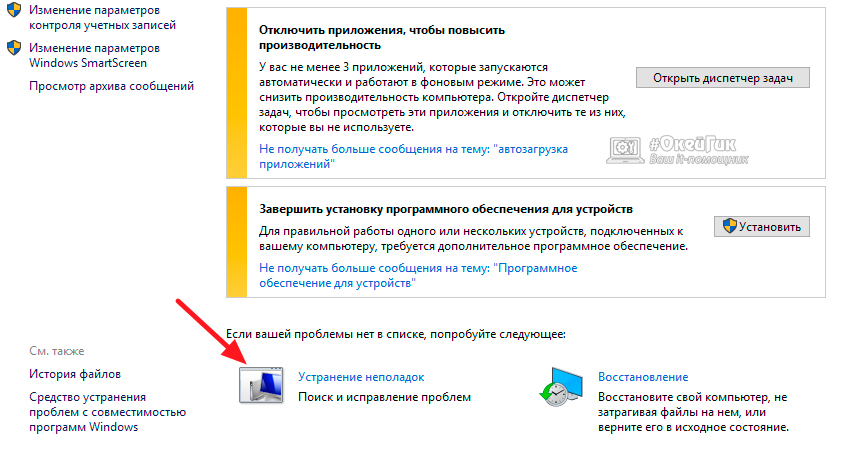
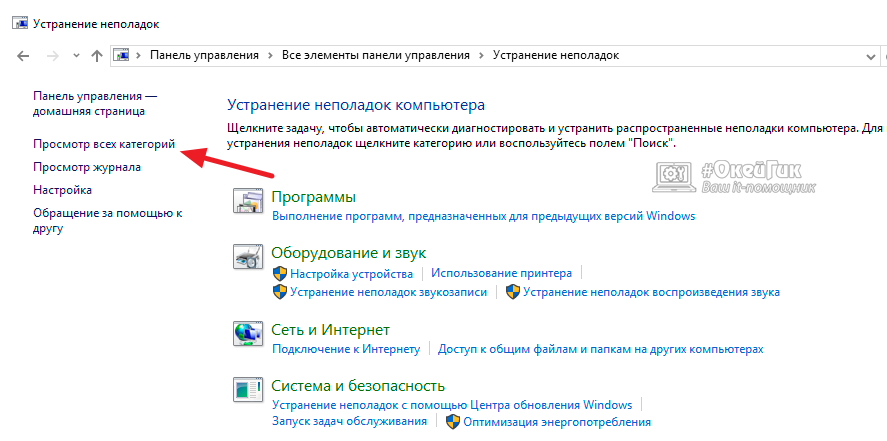
- Перейти в центр безопасности и обслуживания Windows 10. Для этого потребуется зайти в «Панель управления», установить режим просмотра «Крупные значки» и выбрать соответствующий пункт;
- Далее нужно перейти в меню «Устранение неполадок»;

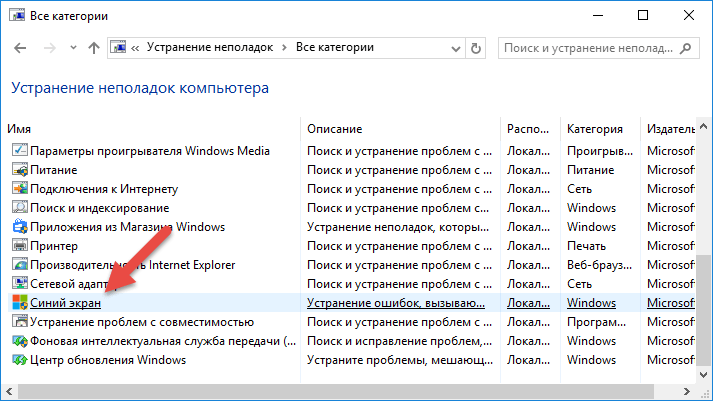
- Откроется новая страница, где в левой части потребуется выбрать «Просмотр всех категорий», чтобы увидеть диагностические утилиты, предусмотренные по умолчанию в операционной системе;

- После того как запустится список всех диагностических инструментов, среди них найдите «Синий экран» и нажмите на него;

- Запустится утилита «Синий экран», которая может работать в двух режима:
Важно помнить, что не всегда синий экран возникает при работе Windows из-за программной ошибки. Он может появляться из-за проблем с «железом» (перегрев или повреждения компонентов компьютера) или вирусами. Когда ошибка будет определена диагностической утилитой Windows, можно узнать подробности о ней на сайте Microsoft по коду ошибки BugCheck.
Почему нужно диагностировать причину синего экрана
Многие пользователи Windows считают нормальной ситуацию, когда несколько раз в месяц компьютер перезагружается из-за BSOD – синего экрана. Данная ошибка является для многих привычной, и они не думают о многих проблемах, к которым она может привести:
 Экстренное завершение программ и драйверов операционной системы может вылиться в потерю «пакетов данных», из-за чего позже приложение не будет запускаться на компьютере или придется переустанавливать драйвер;
- Непредсказуемая потеря данных. Неожиданное появление синего экрана может привести к потере проектов, создаваемых на компьютере;
- Выход из строя «железа». Синий экран негативно сказывается на работе компонентов компьютера. Из оперативной памяти мгновенно выгружается вся информация, жесткие диски резко останавливаются. Мгновенный выход из рабочего режима может привести к поломке комплектующих компьютера.
- Вирусное воздействие. Часто причиной BSOD становятся вирусы, которые могут различными способами навредить компьютеру: зашифровать файлы, передать личные данные на сервера злоумышленников, привести к неисправности операционной системы и прочее.
 Экстренное завершение программ и драйверов операционной системы может вылиться в потерю «пакетов данных», из-за чего позже приложение не будет запускаться на компьютере или придется переустанавливать драйвер;
Если синий экран появляется регулярно, нужно обязательно определить причину возникновения ошибки и устранить ее.
![]()
![]()
![]()
![]()
![]() (411 голос., средний: 4,48 из 5)
(411 голос., средний: 4,48 из 5)
![]() Загрузка…
Загрузка…
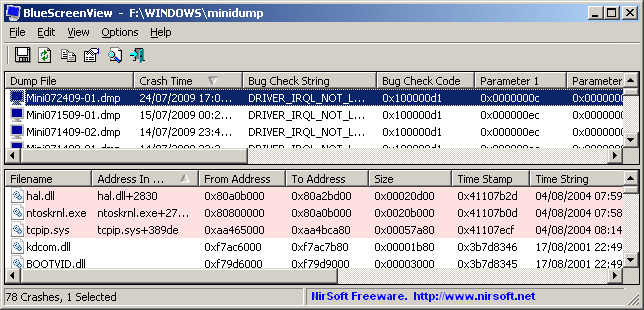
| BlueScreenView v1.55 Copyright (c) 2009 — 2015 Nir Sofer |
Related Utilities
- WinCrashReport — Displays a report about crashed Windows application.
- WhatIsHang — Get information about Windows software that stopped responding (hang)
- AppCrashView — View application crash information on Windows 7/Vista.
See Also
- NK2Edit — Edit, merge and fix the AutoComplete files (.NK2) of Microsoft Outlook.
Description
BlueScreenView scans all your minidump files created during ‘blue screen of death’ crashes, and displays the information about all crashes in one table.
For each crash, BlueScreenView displays the minidump filename, the date/time of the crash, the basic crash
information displayed in the blue screen (Bug Check Code and 4 parameters), and the details of the driver or module
that possibly caused the crash (filename, product name, file description, and file version).
For each crash displayed in the upper pane, you can view the details of the device drivers loaded during the crash in the lower pane.
BlueScreenView also mark the drivers that their addresses found in the crash stack, so you can easily locate the suspected drivers that possibly caused the crash.
Download links are on the bottom of this page
Versions History
- Version 1.55:
- Added Drag & Drop support: You can now drag a single MiniDump file from Explorer into the main window of BlueScreenView.
- Fixed bug: BlueScreenView failed to remember the last size/position of the main window if it was not located in the primary monitor.
- Version 1.52:
- Added ‘Google Search — Bug Check’ and ‘Google Search — Bug Check + Parameter 1’ options.
- Version 1.51:
- Added automatic secondary sorting (‘Crash Time’ column).
- Added 64-bit build.
- Version 1.50:
- The ‘Crash Time’ now displays more accurate date/time of the crash.
In previous versions, the value of ‘Crash Time’ column was taken from the date/time of dump file, which actually represents that time that Windows loaded again, after the crash.
The actual crash time is stored inside the dump file , and now the ‘Crash Time’ displays this value. - Added ‘Dump File Time’ column, which displays the modified time of the dump file.
- The ‘Crash Time’ now displays more accurate date/time of the crash.
- Version 1.47:
- Added ‘Auto Size Columns+Headers’ option, which allows you to automatically resize the columns according to the row values and column headers.
- Version 1.46:
- Fixed issue: The properties and the ‘Advanced Options’ windows opened in the wrong monitor, on multi-monitors system.
- Version 1.45:
- You can now choose to open only a specific dump file — from the user interface or from command-line.
- You can now also specify the MiniDump folder or MiniDump file as a single parameter, and BlueScreenView
will be opened with the right dump file/folder, for example:
BlueScreenView.exe C:\windows\minidump\Mini011209-01.dmp
- Version 1.40:
- Added ‘Raw Data’ mode on the lower pane, which displays the processor registers and memory hex dump.
- Version 1.35:
- Added ‘Crash Address’ column.
- Added 3 columns that display that last 3 calls found in the stack
(Only for 32-bit crashes)
- Version 1.32:
- Added ‘Mark Odd/Even Rows’ option, under the View menu. When it’s turned on, the odd and even rows are displayed in different color, to make it easier to read a single line.
- Version 1.31:
- Added ‘Google Search — Bug Check+Driver’ for searching in Google the driver name and bug check code of the selected blue screen.
- Version 1.30:
- Added ‘Dump File Size’ column.
- Version 1.29:
- You can now send the list of blue screen crashes to stdout by specifying an empty filename («») in the command-line of all save parameters.
For example: bluescreenview.exe /stab «» > c:\temp\blue_screens.txt
- You can now send the list of blue screen crashes to stdout by specifying an empty filename («») in the command-line of all save parameters.
- Version 1.28:
- Added ‘Add Header Line To CSV/Tab-Delimited File’ option. When this option is turned on, the column names are added
as the first line when you export to csv or tab-delimited file.
- Added ‘Add Header Line To CSV/Tab-Delimited File’ option. When this option is turned on, the column names are added
- Version 1.27:
- Fixed issue: removed the wrong encoding from the xml string, which caused problems to some xml viewers.
- Version 1.26:
- Fixed ‘DumpChk’ mode to work properly when DumpChk processing takes more than a few seconds.
- Version 1.25:
- Added ‘DumpChk’ mode, which displays the output of Microsoft DumpChk utility (DumpChk.exe).
You can set the right path and parameters of DumpChk in ‘Advanced Options’ window.
By default, BlueScreenView tries to run DumpChk from ‘%programfiles%\Debugging Tools for Windows’ - The default MiniDump folder is now taken from HKEY_LOCAL_MACHINE\SYSTEM\CurrentControlSet\Control\CrashControl
- Added ‘DumpChk’ mode, which displays the output of Microsoft DumpChk utility (DumpChk.exe).
- Version 1.20:
- Added 3 new columns in the upper pane: Processors Count, Major Version, Minor Version.
- Added ‘Explorer Copy’ option, which allows you to copy dump files to the clipboard and then paste them into Explorer window.
- Version 1.15:
- Added option to view the blue screen list of multiple computers on your network.
The computer names are specified in a simple text file. (See below). - Added Combo-Box to easily choose the MiniDump folders available in the hard-disks currently attached to your computer.
- Added ‘Computer Name’ and ‘Full Path’ columns.
- Added option to view the blue screen list of multiple computers on your network.
- Version 1.11:
- Added /sort command-line option.
- Version 1.10:
- Added accelerator keys for allowing you to toggle between modes more easily.
- Added command-line options for saving the crash dumps list to text/csv/html/xml file.
- Added command-line option for opening BlueScreenView with the desired MiniDump folder.
- Fixed focus problems when opening the ‘Advanced Options’ window.
- Added ‘default’ button to the ‘Advanced Options’ window.
- Added ‘processor’ column — 32-bit or x64.
- Version 1.05 — Added support for x64 MiniDump files.
- Version 1.00 — First release.
BlueScreenView Features
- Automatically scans your current minidump folder and displays the list of all crash dumps, including crash dump date/time and crash details.
- Allows you to view a blue screen which is very similar to the one that Windows displayed during the crash.
- BlueScreenView enumerates the memory addresses inside the stack of the crash, and find all drivers/modules that might be involved in the crash.
- BlueScreenView also allows you to work with another instance of Windows, simply by choosing the right minidump folder (In Advanced Options).
- BlueScreenView automatically locate the drivers appeared in the crash dump, and extract their version resource information, including product name, file version, company, and file description.
System Requirements
- BlueScreenView works with Windows XP, Windows Server 2003, Windows Server 2008, Windows Vista, Windows 7, Windows 8, Windows 10,
as long as Windows is configured to save minidump files during BSOD crashes.
If your system doesn’t create MiniDump files on a blue screen crash,
try to configure it according to the following article:
How to configure Windows to create MiniDump files on BSOD - BlueScreenView can read the MiniDump files of both 32-bit and x64 systems.
- Be aware that on Windows 10, some of the created MiniDump files might be empty and BlueScreenView will not display them.
Using BlueScreenView
BlueScreenView doesn’t require any installation process or additional dll files.
In order to start using it, simply run the executable file — BlueScreenView.exe
After running BlueScreenView, it automatically scans your MiniDump folder and display all crash details in the upper pane.
Crashes Information Columns (Upper Pane)
- Dump File: The MiniDump filename that stores the crash data.
- Crash Time: The created time of the MiniDump filename, which also matches to the date/time that the crash occurred.
- Bug Check String: The crash error string. This error string is determined according to the Bug Check Code, and it’s also displayed in the blue screen window of Windows.
- Bug Check Code: The bug check code, as displayed in the blue screen window.
- Parameter 1/2/3/4: The 4 crash parameters that are also displayed in the blue screen of death.
- Caused By Driver: The driver that probably caused this crash.
BlueScreenView tries to locate the right driver or module that caused the blue screen by looking inside the crash stack.
However, be aware that the driver detection mechanism is not 100% accurate, and you should also look in the lower pane, that display all drivers/modules found in the stack.
These drivers/modules are marked in pink color. - Caused By Address: Similar to ‘Caused By Driver’ column, but also display the relative address of the crash.
- File Description: The file description of the driver that probably caused this crash.
This information is loaded from the version resource of the driver. - Product Name: The product name of the driver that probably caused this crash.
This information is loaded from the version resource of the driver. - Company: The company name of the driver that probably caused this crash.
This information is loaded from the version resource of the driver. - File Version: The file version of the driver that probably caused this crash.
This information is loaded from the version resource of the driver. - Crash Address:The memory address that the crash occurred. (The address in the EIP/RIP processor register)
In some crashes, this value might be identical to ‘Caused By Address’ value, while in others,
the crash address is different from the driver that caused the crash. - Stack Address 1 — 3:
The last 3 addresses found in the call stack.
Be aware that in some crashes, these values will be empty.
Also, the stack addresses list is currently not supported for 64-bit crashes.
Drivers Information Columns (Lower Pane)
- Filename: The driver/module filename
- Address In Stack: The memory address of this driver that was found in the stack.
- From Address: First memory address of this driver.
- To Address: Last memory address of this driver.
- Size: Driver size in memory.
- Time Stamp: Time stamp of this driver.
- Time String: Time stamp of this driver, displayed in date/time format.
- Product Name: Product name of this driver, loaded from the version resource of the driver.
- File Description: File description of this driver, loaded from the version resource of the driver.
- File Version: File version of this driver, loaded from the version resource of the driver.
- Company: Company name of this driver, loaded from the version resource of the driver.
- Full Path: Full path of the driver filename.
Lower Pane Modes
Currently, the lower pane has 4 different display modes.
You can change the display mode of the lower pane from Options->Lower Pane Mode menu.
- All Drivers:
Displays all the drivers that were loaded during the crash that you selected in the upper pane.
The drivers/module that their memory addresses found in the stack, are marked in pink color. - Only Drivers Found In Stack:
Displays only the modules/drivers that their memory addresses found in the stack of the crash.
There is very high chance that one of the drivers in this list is the one that caused the crash. - Blue Screen in XP Style:
Displays a blue screen that looks very similar to the one that Windows displayed during the crash. - DumpChk Output:
Displays the output of Microsoft DumpChk utility.
This mode only works when Microsoft DumpChk is installed on your computer and
BlueScreenView is configured to run it from the right folder (In the Advanced Options window).
You can get DumpChk from the installation CD/DVD of Windows or
with the installtion of Debugging Tools for Windows.
Crashes of Remote Network Computer
If you have multiple computers on your network and you have full administrator access to them
(e.g: you have access to \\ComputerName\c$), you can also view the crashes of the other computers on your network remotely.
In order to do that, simply go to ‘Advanced Options’ (Ctrl+O) and type the MiniDump folder of the remote
computer, for example: \\MyComp\c$\Windows\MiniDump.
Notice: If you fail to get full administrator access to the remote computer, you should read the instructions in the following Blog post:
How to connect a remote Windows 7/Vista/XP computer with NirSoft utilities.
Watching the crashes of multiple computers on your network
If you have a network with multiple computers, and you have full admin access to these computers, you can
view the blue screens list of all these computers in one table, and easily detect computers with recurring BSOD problems.
In order to use this feature, prepare a list of all computer names/IP addresses that you want to inspect, and save it to a simple text file.
The computer names in the list can be delimited by comma, semicolon, tab character, or Enter (CRLF).
Example for computer names list:
comp01
comp02
192.168.0.1
192.168.0.2
192.168.0.4
After you have a text file contains the computers list, you can go to Advanced Options window (Ctrl+O), choose the second option and type the computers list filename.
Command-Line Options
| /LoadFrom <Source> |
Specifies the source to load from. 1 -> Load from a single MiniDump folder (/MiniDumpFolder parameter) 2 -> Load from all computers specified in the computer list file. (/ComputersFile parameter) 3 -> Load from a single MiniDump file (/SingleDumpFile parameter) |
| /MiniDumpFolder <Folder> | Start BlueScreenView with the specified MiniDump folder. |
| /SingleDumpFile <Filename> | Start BlueScreenView with the specified MiniDump file. (For using with /LoadFrom 3) |
| /ComputersFile <Filename> | Specifies the computers list filename. (When LoadFrom = 2) |
| /LowerPaneMode <1 — 3> |
Start BlueScreenView with the specified mode. 1 = All Drivers, 2 = Only Drivers Found In Stack, 3 = Blue Screen in XP Style. |
| /stext <Filename> | Save the list of blue screen crashes into a regular text file. |
| /stab <Filename> | Save the list of blue screen crashes into a tab-delimited text file. |
| /scomma <Filename> | Save the list of blue screen crashes into a comma-delimited text file (csv). |
| /stabular <Filename> | Save the list of blue screen crashes into a tabular text file.
|
| /shtml <Filename> | Save the list of blue screen crashes into HTML file (Horizontal). |
| /sverhtml <Filename> | Save the list of blue screen crashes into HTML file (Vertical). |
| /sxml <Filename> | Save the list of blue screen crashes into XML file. |
| /sort <column> |
This command-line option can be used with other save options for sorting by the desired column. If you don’t specify this option, the list is sorted according to the last sort that you made from the user interface. The <column> parameter can specify the column index (0 for the first column, 1 for the second column, and so on) or the name of the column, like «Bug Check Code» and «Crash Time». You can specify the ‘~’ prefix character (e.g: «~Crash Time») if you want to sort in descending order. You can put multiple /sort in the command-line if you want to sort by multiple columns.
Examples: |
| /nosort | When you specify this command-line option, the list will be saved without any sorting. |
Translating BlueScreenView to other languages
In order to translate BlueScreenView to other language, follow the instructions below:
- Run BlueScreenView with /savelangfile parameter:
BlueScreenView.exe /savelangfile
A file named BlueScreenView_lng.ini will be created in the folder of BlueScreenView utility. - Open the created language file in Notepad or in any other text editor.
- Translate all string entries to the desired language.
Optionally, you can also add your name and/or a link to your Web site.
(TranslatorName and TranslatorURL values) If you add this information, it’ll be
used in the ‘About’ window. - After you finish the translation, Run BlueScreenView, and all translated
strings will be loaded from the language file.
If you want to run BlueScreenView without the translation, simply rename the language file, or move
it to another folder.
License
This utility is released as freeware.
You are allowed to freely distribute this utility via floppy disk, CD-ROM,
Internet, or in any other way, as long as you don’t charge anything for this.
If you distribute this utility, you must include all files in
the distribution package, without any modification !
Disclaimer
The software is provided «AS IS» without any warranty, either expressed or implied,
including, but not limited to, the implied warranties of merchantability and fitness
for a particular purpose. The author will not be liable for any special, incidental,
consequential or indirect damages due to loss of data or any other reason.
Feedback
If you have any problem, suggestion, comment, or you found a bug in my utility,
you can send a message to nirsofer@yahoo.com
BlueScreenView is also available in other languages. In order to change the language of
BlueScreenView, download the appropriate language zip file, extract the ‘bluescreenview_lng.ini’,
and put it in the same folder that you Installed BlueScreenView utility.
| Language | Translated By | Date | Version |
|---|---|---|---|
| Arabic | Fcmam5 | 23/02/2013 | 1.47 |
| Brazilian Portuguese | cslibraga | 20/02/2016 | 1.10 |
| Bulgarian | Евгений Кабакчиев | 05/06/2015 | 1.55 |
| Czech | Pavel Konečný | 04/01/2015 | 1.52 |
| Danish | Gustav Brock | 15/01/2011 | 1.30 |
| Dutch | Jan Verheijen | 03/02/2015 | 1.55 |
| Farsi | Hamed Babaei (ÍÇãÏ ÈÇÈÇíí) | 18/03/2014 | 1.52 |
| Finnish | S. J. Liimatainen | 03/06/2020 | 1.55 |
| French | EtoileFilante® Corp. | 24/08/2015 | 1.55 |
| French | Eric FICHOT | 27/07/2013 | 1.52 |
| French | xb70walkyrie [v. 1.55] | 31/07/2016 | |
| German | «Latino» auf WinTotal.de | 29/01/2015 | 1.55 |
| Greek | geogeo.gr | 11/10/2014 | 1.52 |
| Hungarian | Timinoun | 12/12/2022 | 1.55 |
| Italian | Roberto B.WSS | 14/05/2015 | 1.55 |
| Italian | Daniele Cultrera & bovirus | 01/04/2014 | 1.52 |
| Japanese | iLEƒÖEj | 17/07/2013 | 1.52 |
| Korean | J. K. Lee(Wave) | 04/02/2015 | 1.55 |
| Latvian | Nizaury | 15/01/2012 | 1.45 |
| Persian | Shadima.com | 26/04/2020 | 1.55 |
| Polish | Wojciech Sabaj | 25/06/2012 | 1.45 |
| Polish | Tomasz Janiszewski | 04/08/2009 | 1.00 |
| Romanian | Jaff (Oprea Nicolae) | 08/05/2015 | 1.55 |
| Russian | Dmitry Posunko && Dm.Yerokhin | 21/01/2016 | 1.55 |
| Simplified Chinese | CuiPlaY | 14/03/2013 | 1.47 |
| Simplified Chinese | EaiLFly | 28/01/2012 | 1.45 |
| Simplified Chinese | Edison Chen | 27/05/2014 | 1.52 |
| Slovak | Fero Fico | 29/01/2015 | 1.55 |
| Slovenian | Darko Kenda | 22/01/2014 | 1.52 |
| Spanish | Amadeo García Torrano | 07/05/2020 | 1.55 |
| Swedish | Bernt Janhäger | 06/08/2012 | 1.45 |
| Swedish | Tommy Kellerman | 29/03/2011 | 1.32 |
| Traditional Chinese | 發夢 King | 04/08/2009 | 1.00 |
| Traditional Chinese | 丹楓(虫二電氣診所) | 08/10/2013 | 1.52 |
| Turkish | Saner Apaydin | 16/03/2010 | 1.20 |
| Turkish | HARUN ARI | 16/09/2011 | 1.40 |
| Ukrainian | Lembergman, August 2017 | 19/08/2017 | 1.5.5.0 |
| Ukrainian | vmsoft77 | 20/11/2013 | 1.52 |
| Valencian | vjatv | 25/08/2009 | 1.05 |
На чтение 3 мин. Просмотров 176 Опубликовано
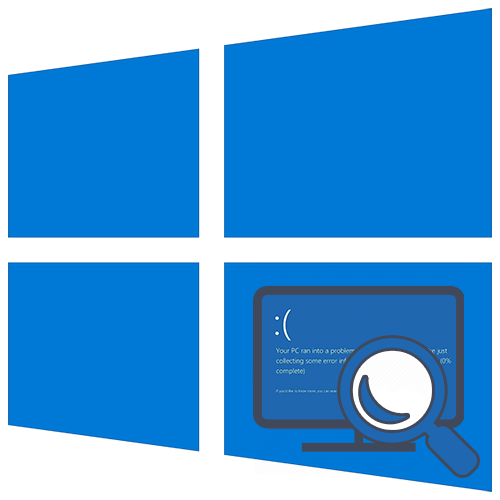
Windows 10, 8 принесла множество различий по сравнению со старыми версиями Windows. Эти две платформы разработаны, чтобы быть более удобными для пользователя и быть более «интуитивными», особенно для пользователей начального уровня. Но иногда лучше иметь более сложную систему, поскольку вам может потребоваться решить некоторые проблемы самостоятельно. Это может быть применено, особенно если мы говорим о сообщениях BSOD или предупреждениях, которые стали просто бесполезным печальным смайликом.
 BSOD или Blue Screen Of Death, представляет собой стандартное сообщение остановки Windows или предупреждение об ошибке. Если в более старых версиях Windows при отображении BSOD мы действительно могли видеть подробную информацию, связанную с соответствующей проблемой, и нам удавалось в конечном итоге решить проблемы, то теперь в Windows 10, 8 и Windows 8.1 мы можем получить только грустное улыбающееся лицо вместе с следующее сообщение, которое, кстати, довольно раздражает: « На вашем компьютере возникла проблема, с которой он не мог справиться, и теперь ему нужно перезагрузить компьютер ».
- ЧИТАЙТЕ ТАКЖЕ: этот код вызывает ошибки BSOD во всех последних версиях Windows
Поэтому, если вы хотите просмотреть классическое сообщение BSOD в Windows 10 и Windows 8, 8.1 или если вы хотите получить доступ к фактическому сообщению об ошибке, выполните действия, описанные ниже. Конечно, вы также можете записать ошибку, которая была у вас в Windows 10 или Windows 8, 8.1, а затем найти ее в Интернете.
Содержание
- Как просматривать журналы BSOD в Windows 10, 8.1, 8
- 1. Используйте редактор реестра
- 2. Установите BlueScreenView
Как просматривать журналы BSOD в Windows 10, 8.1, 8
1. Используйте редактор реестра
- Загрузите с вашего компьютера исправление KB2929742, а затем примените его на устройстве Windows 8.
-
На начальном экране Windows нажмите Win + R и в поле «Выполнить» введите « regedit » – нажмите «ОК», чтобы запустить редактор реестра.

-
От редактора реестра перейдите по пути: «HKEY_LOCAL_MACHINESystemCurrentControlSetControlCrashControl».
- На правой панели редактора реестра щелкните правой кнопкой мыши на любом пустом месте.
- Выберите «новый», затем « Значение DWORD ».
- Назовите новое значение DWORD в «DisplayParameters».
-
Нажмите на это новое значение и установите 1 – введите «1» в поле «Значение данных».
- Сохраните изменения и закройте редактор реестра.
- Также перезапустите устройство под управлением Windows 8 или Windows 8.1.


2. Установите BlueScreenView
Вы также можете установить специальное программное обеспечение для просмотра сведений о «Синем экране смерти» в Windows 10, Windows 8. BlueScreenView NirSoft сканирует файлы мини-дампов, которые ваш компьютер создает при возникновении ошибок BSOD, а затем отображает сведения о сбоях в простой таблице. В этой таблице вы найдете информацию о дате/времени сбоя, драйвере, который мог вызвать сбой, и многое другое.