В этой статье, друзья, рассмотрим средства потребления системных ресурсов в актуальных операционных системах Windows 10 и 11. Многие из вас знают, что при необходимости отслеживания загруженности определённых компонентов компьютера можно обратиться к системному диспетчеру задач. Но, возможно, немногие из вас обращали внимание на все его примечательные возможности в современных Windows, мы поговорим об этих возможностях. Также мы рассмотрим альтернативы диспетчеру задач по отслеживанию нагрузки на компоненты компьютера – от простых виджетов производительности до масштабных инструментов мониторинга ресурсов. Windows 11 не получила никаких изменений в плане системных средств мониторинга ресурсов, всё как есть унаследовала от Windows 10. Потому то, что мы будем рассматривать – как системные, так и сторонние средства — одинаково касаются что Windows 10, что Windows 11.
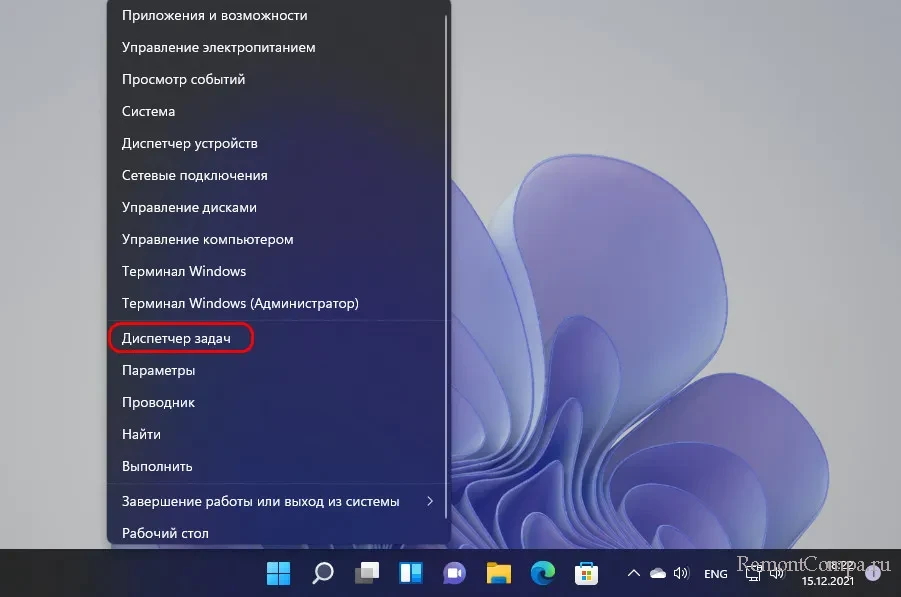
Первое место, куда обычно обращаются при системных тормозах или специально за отслеживаем нагрузки на компоненты компьютера – это системный диспетчер задач. Его можно вызвать клавишами Shift+Ctrl+Esc, либо в меню по клавишам Win+X, это же меню вызывается кликом правой клавиши мыши по кнопке «Пуск» в Windows 10 и 11.
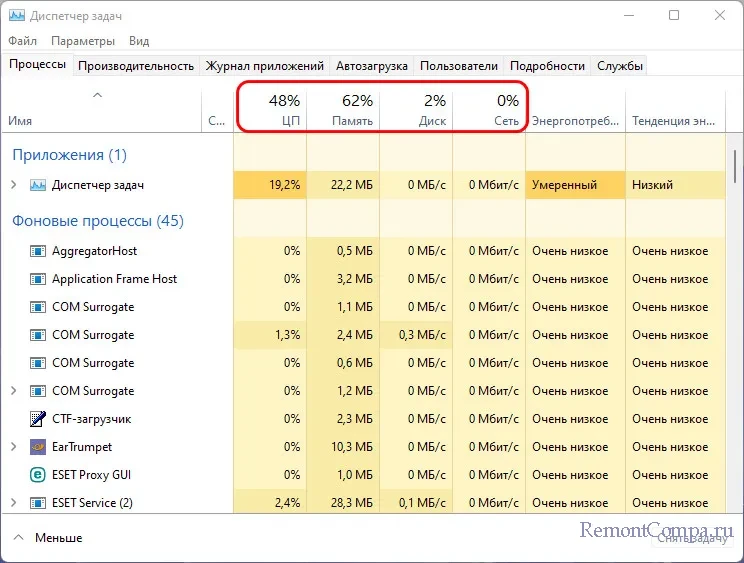
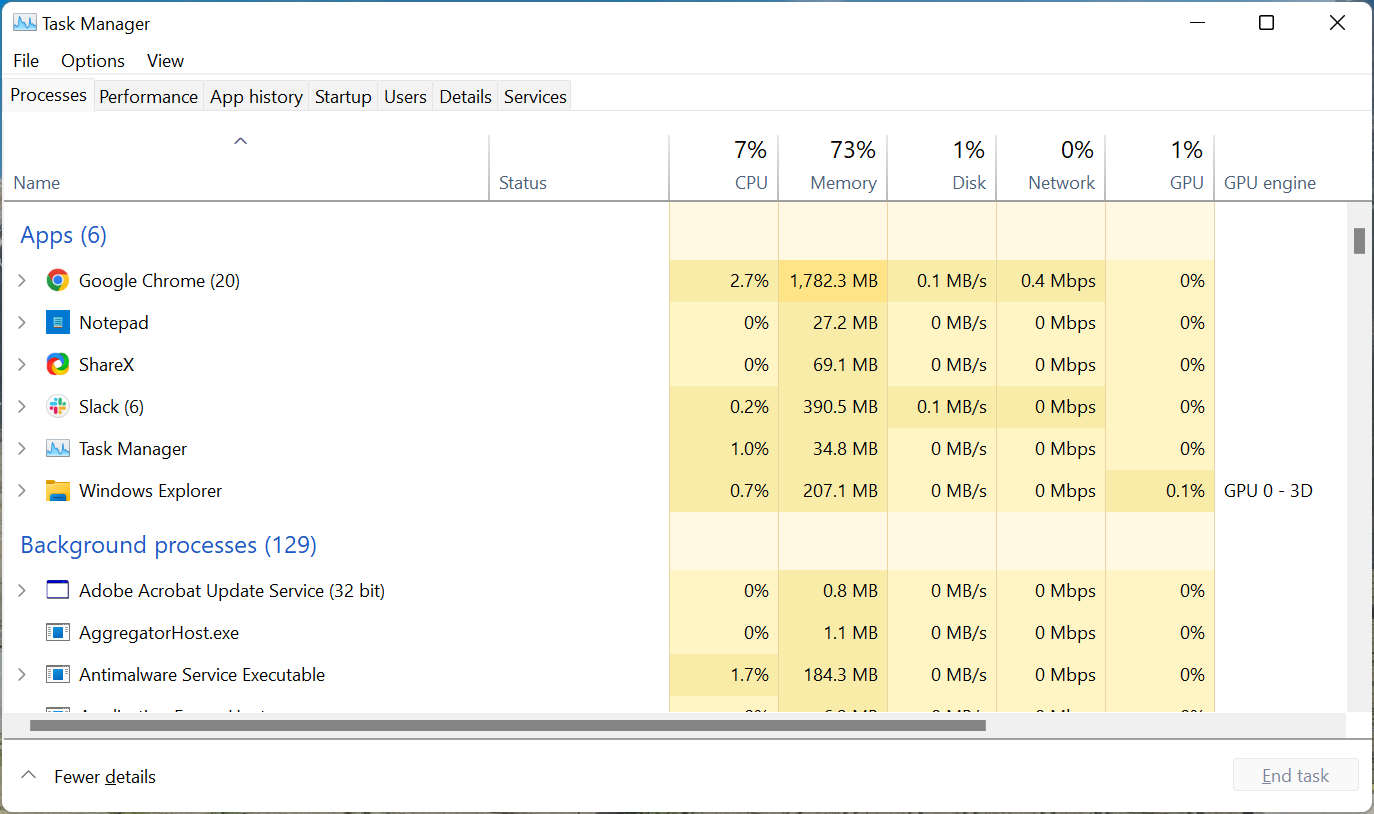
Нагрузка на ресурсы компьютера в процентном выражении отображается прямо в главной вкладке диспетчера задач. Вверху таблицы нам даётся общий процент нагрузки на процессор, оперативную память, жёсткие диски (на суммарно все диски), а также на сеть. В самой таблице можем видеть детализацию, какие системные и сторонние процессы сколько какого ресурса потребляют. Для процессора это будет тот же процент нагрузки, для оперативной памяти – потребляемый объём, для диска – скорость обработки данных, для сети – скорость передачи данных по сети.
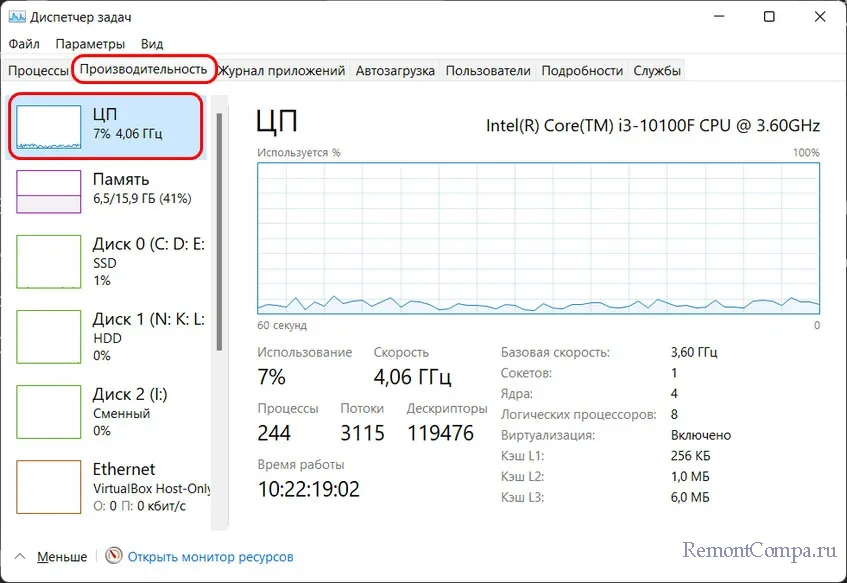
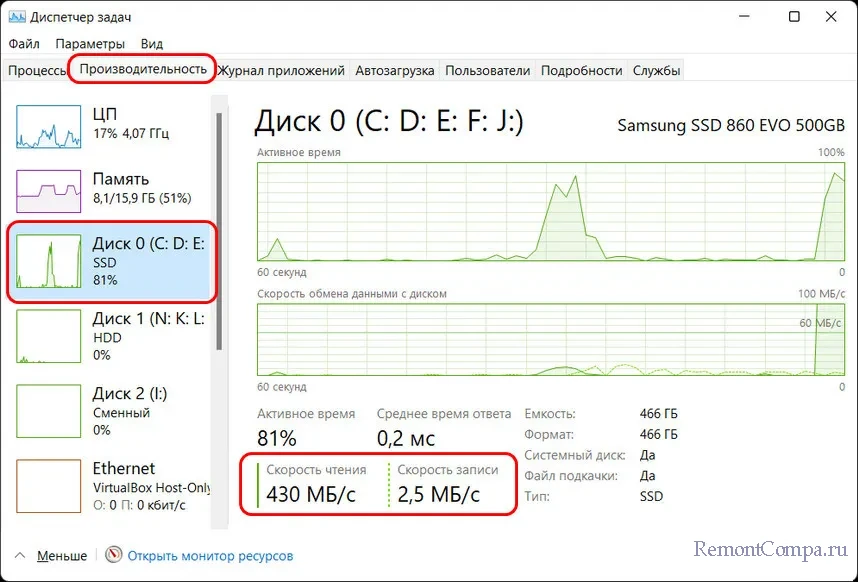
Детализацию по нагрузке на ресурсы компьютера можем посмотреть во вкладке «Производительность». Здесь нам предлагаются графики течения нагрузок. Для процессора можем видеть его характеристики, текущую частоту ядер, число активных процессов и потоков, информацию о включении виртуализации. Полезной может оказаться для многих информация о времени работы компьютера с момента его включения.
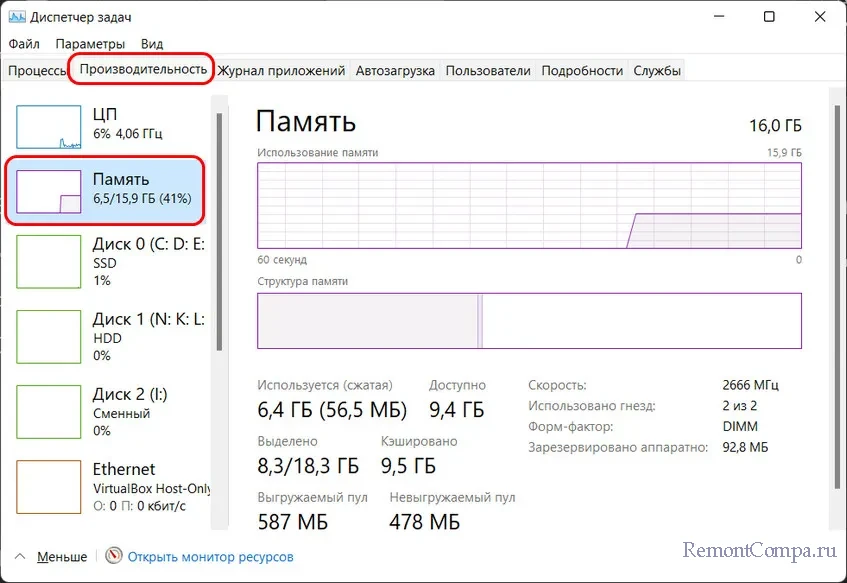
Для оперативной памяти нам показывается общий её объём, эффективная частота, на которой работают планки, используемый и доступный, т.е. свободный объём. Для используемого объёма отображаются разные его категории — кэшированная память, зарезервированная аппаратно, выгружаемый и невыгружаемый пул.
Друзья, диспетчер задач Windows – не лучший диагност для жёстких дисков, но с его помощью, помимо отслеживания нагрузки, можно зафиксировать реальную скорость проведения операций чтения и записи данных. Эта именно та скорость, с которой нам есть в толк при работе с компьютером в противовес синтетическим тестам измерения производительности дисков, где, как правило, только и могут развить максимальные скорости SSD, которые нам обещают их производители. Запустите диспетчер задач на вкладке производительности тестируемого диска и нагрузите последний задачами – чтением данных, копированием, скачиванием, запуском ресурсоёмкой программы. И увидите те скорости, которые ваш SSD может реально развить.
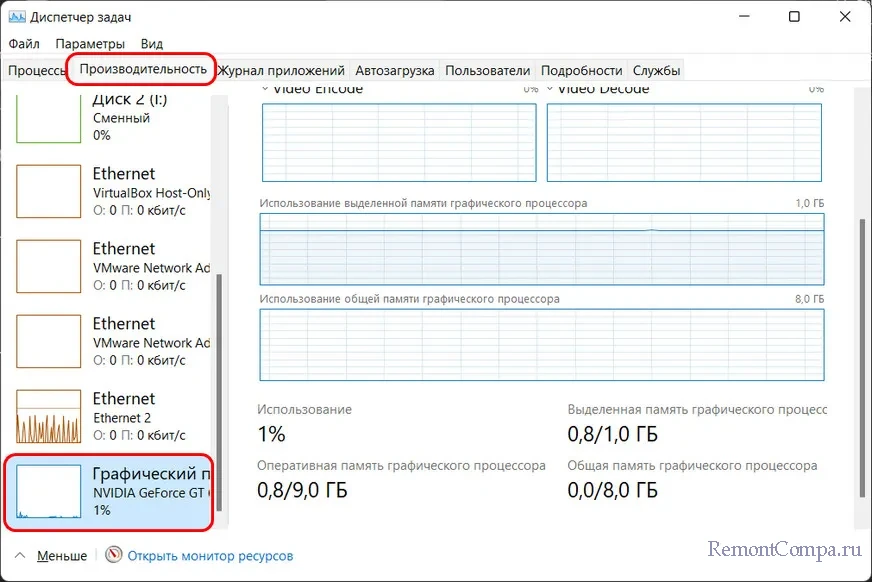
Для видеокарты нам предлагаются графики течения нагрузок, которые задействуют разные её области работы. Помимо этого, предлагаются данные о задействовании памяти видеокарты.
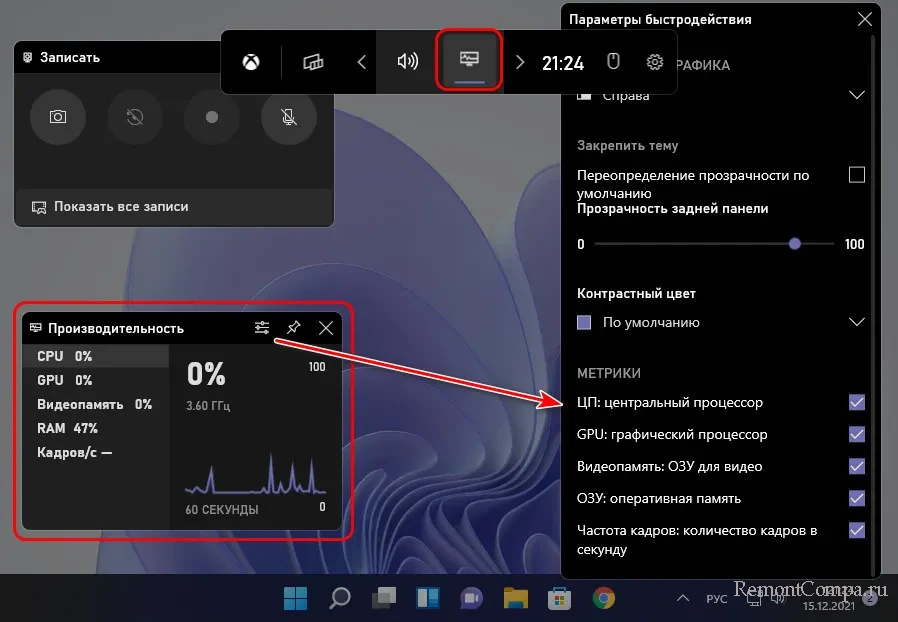
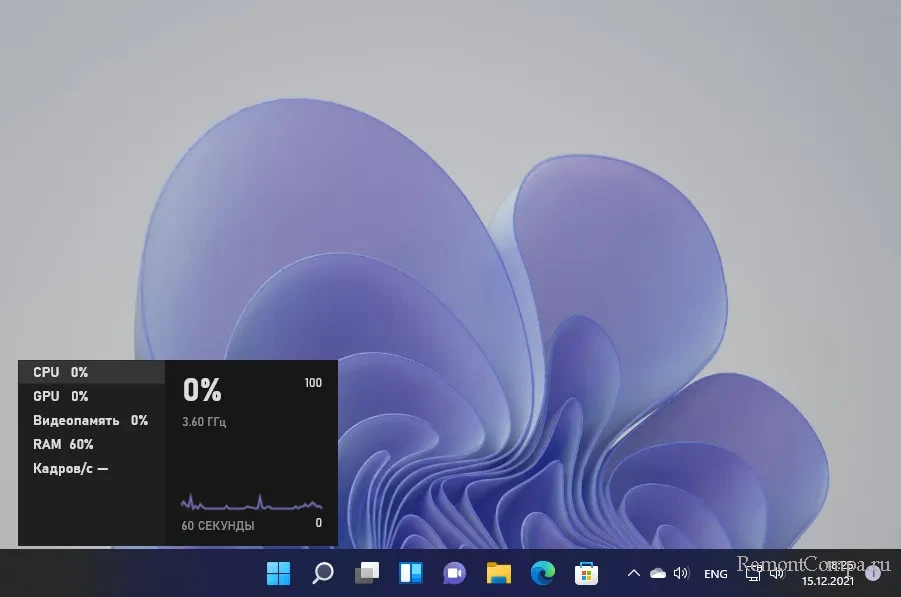
Мониторинг нагрузки на системные ресурсы есть в составе игровой панели (Game Bar) Windows 10 и 11. Эта панель предусматривает небольшой виджет мониторинга производительности в упрощённом формате. Виджет заточен под игровой процесс, чтобы геймеры могли отслеживать, как компьютер справляется с теми или иными игровыми задачами. В нём отображается общая нагрузка на процессор, видеокарту, причём отдельно на графический процессор и отдельно на видеопамять. Отображается нагрузка на оперативную память и FPS (число кадров в секунду). Для запуска игровой панели жмём клавиши Win+G, ищем виджет производительности, если его нет, включаем его на панели-менюшке вверху. Сам виджет можем настроить, задав нужные значения прозрачности, цветовой отделки, отображения системных компонентов, размещения самого виджета на экране.
Игровая панель со всеми активными виджетами появляется при нажатии клавиш Win+G и потом исчезает, как только мы переключимся на другую задачу. Но нужные нам её виджеты, включая виджет производительности, мы можем закрепить для постоянной активности.
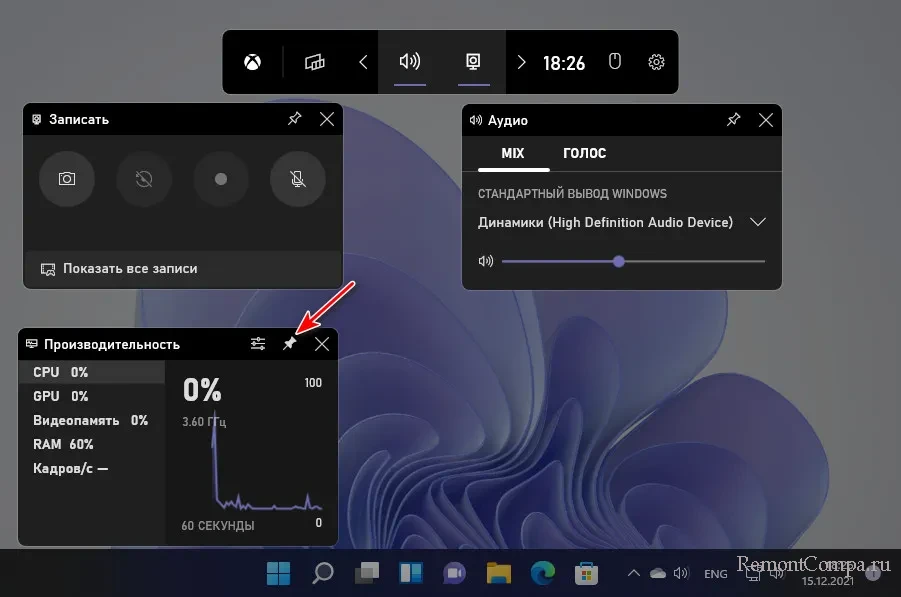
И тогда виджет производительности у нас будет постоянно отображаться на экране поверх других окон.
Минималистичный виджет для отслеживания нагрузки на системные ресурсы компьютера можно получить на рабочем столе с помощью бесплатной программы Rainmeter. Она реализует скины рабочего стола Windows с различными виджетами, в числе которых по умолчанию идут дата и время, монитор общей нагрузки на процессор, оперативную память и файл подкачки, отображение дисков компьютера с их загруженностью.
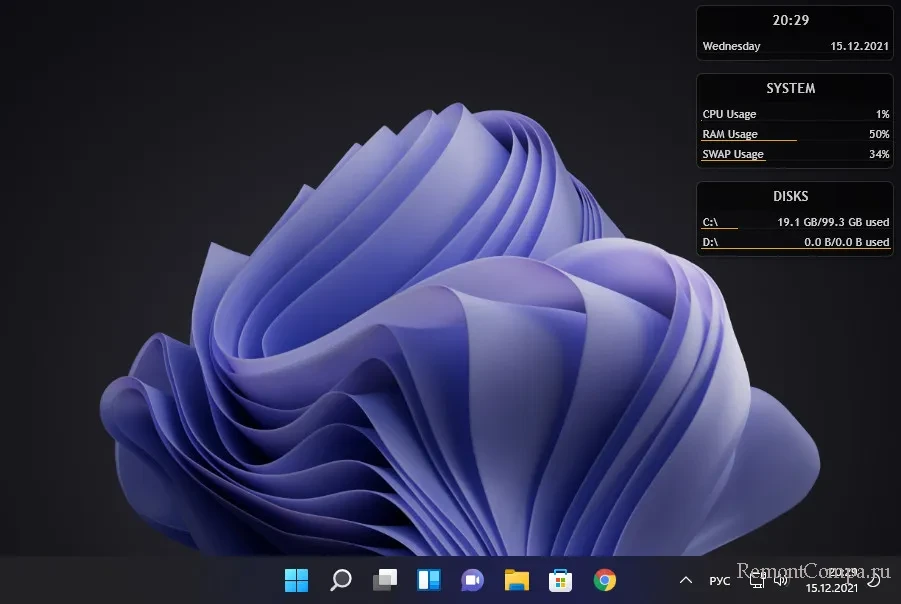
В настройках программы можно добавить другие виджеты – монитор нагрузки на сеть, системную корзина, поиск Google и т.п.
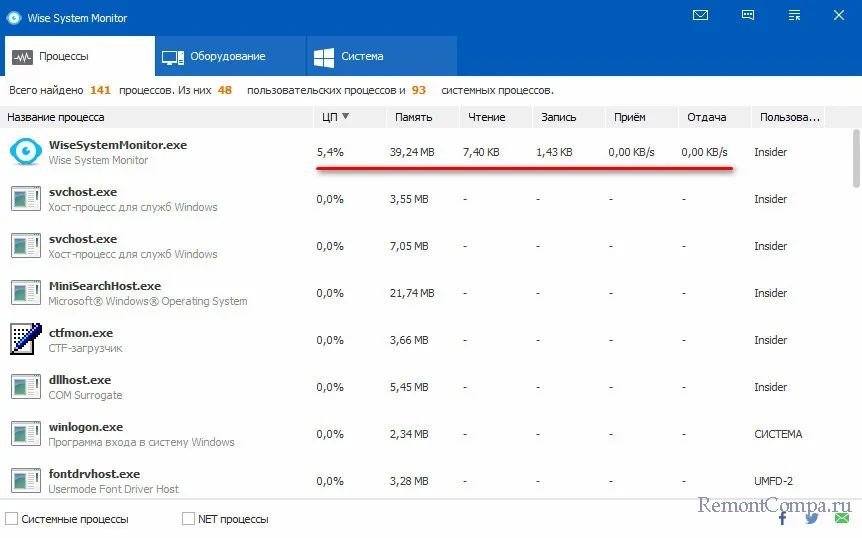
Ещё более минималистичный виджет нагрузки на системные ресурсы предлагает бесплатная программа Wise System Monitor. Она реализует на рабочем столе небольшую полоску с отображением нагрузки на процессор, оперативную память и сеть.
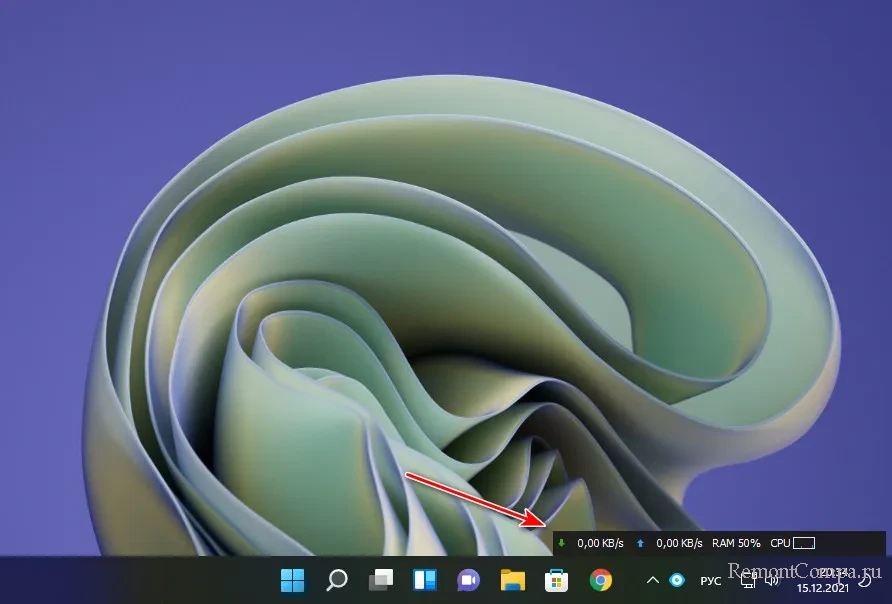
При наведении в виджете на тот или и иной ресурс компьютера увидим детализацию процессов, потребляющих этот ресурс. Для процессора и сети в детализации будут отображаться графики течения нагрузок. Для оперативной памяти – кольцевая диаграмма занятого и свободного объёма.
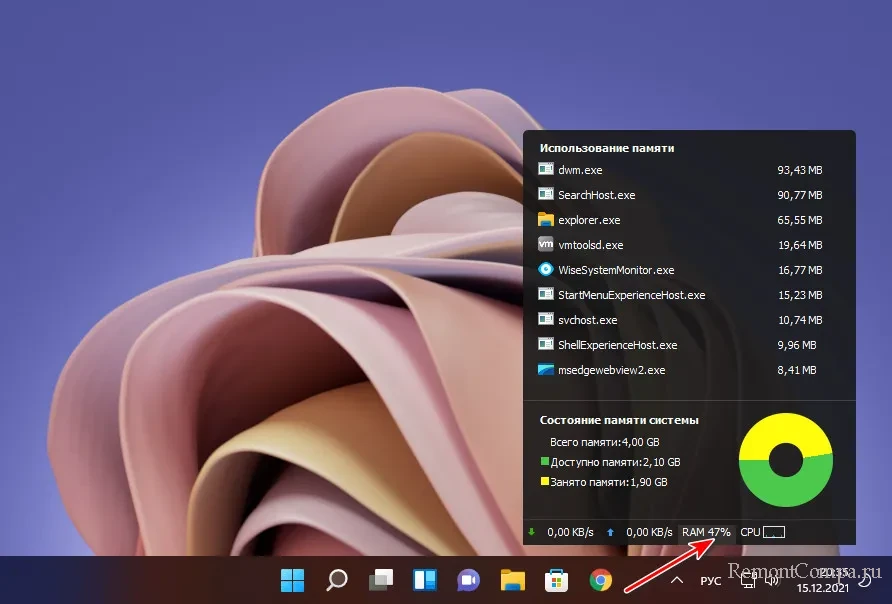
Непосредственно же сама программа Wise System Monitor может предложить нам некоторую информацию об операционной системе, в частности, дату и время установки. А также сведения об аппаратных компонентах нашего компьютера. Ну а основная фишка Wise System Monitor – это реализация альтернативы системному диспетчеру задач Windows. У программы он своего формата. С возможностью отслеживания каждым из процессов нагрузки на процессор, оперативную память, сеть. С возможностью отслеживания скорости чтения и записи данных процессами.
Теперь, друзья, давайте рассмотрим более мощные средства мониторинга ресурсов компьютера. За таким средством далеко ходить не нужно, он есть в Windows 10 и 11 в числе штатного функционала, это системный монитор ресурсов. Запускается по отсылке внизу из раздела «Производительность» диспетчера устройства, либо отдельно, для чего необходимо в командлет «Выполнить» или системный поиск вписать:
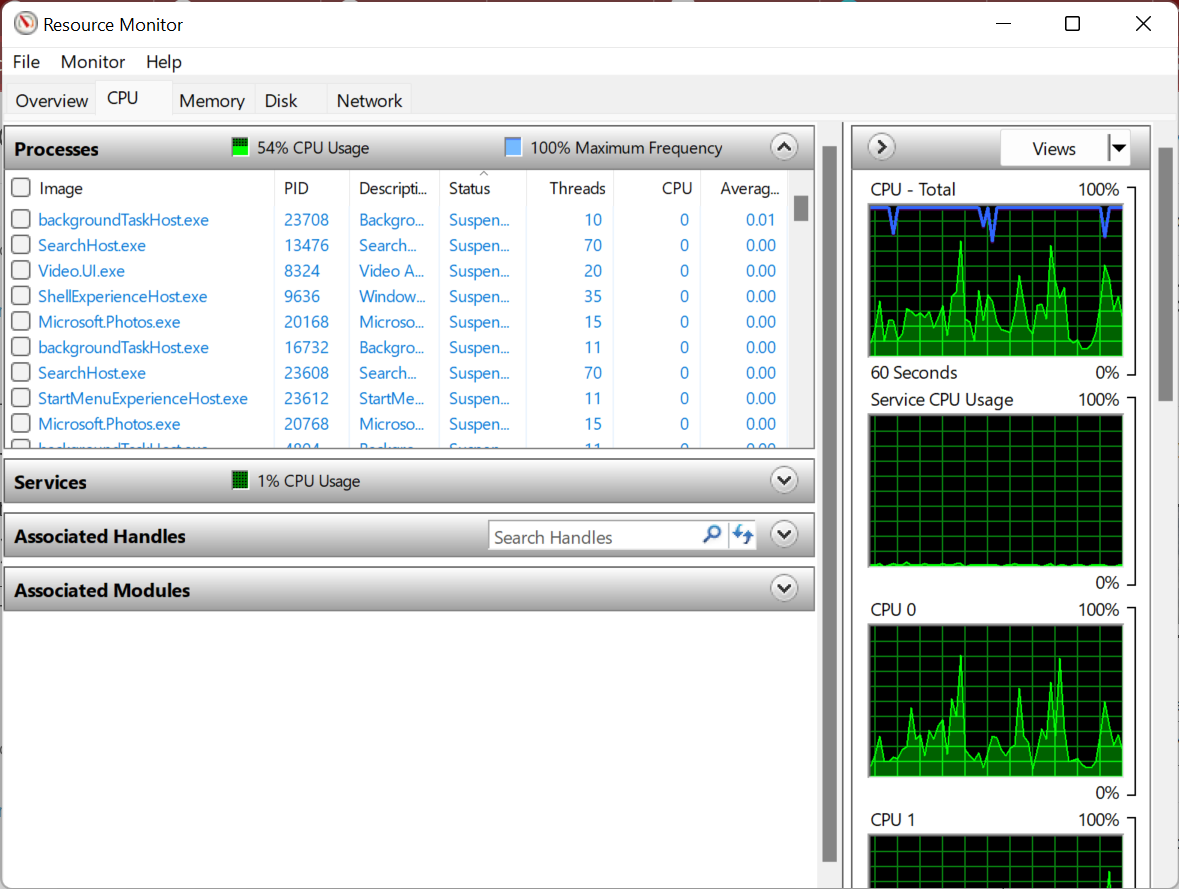
Или можно вписать в системный поиск «Монитор ресурсов». Системный монитор ресурсов являет собой расширение данных, отображаемых в системном диспетчере задач. Здесь показывается общая и детализированная нагрузка на ресурсы в процентах и метриках. По каждому активному процессу можем узнать:
- сколько он потребляет потоков и процента загруженности процессора,
- скорость чтения и записи данных процессом, оперируемые им файлы на диске,
- скорость отправленных и полученных данных по сети,
- использованный объём оперативной памяти – текущий, завершённый, общий.
Также нам предлагаются графики течения нагрузок на ресурсы компьютера.
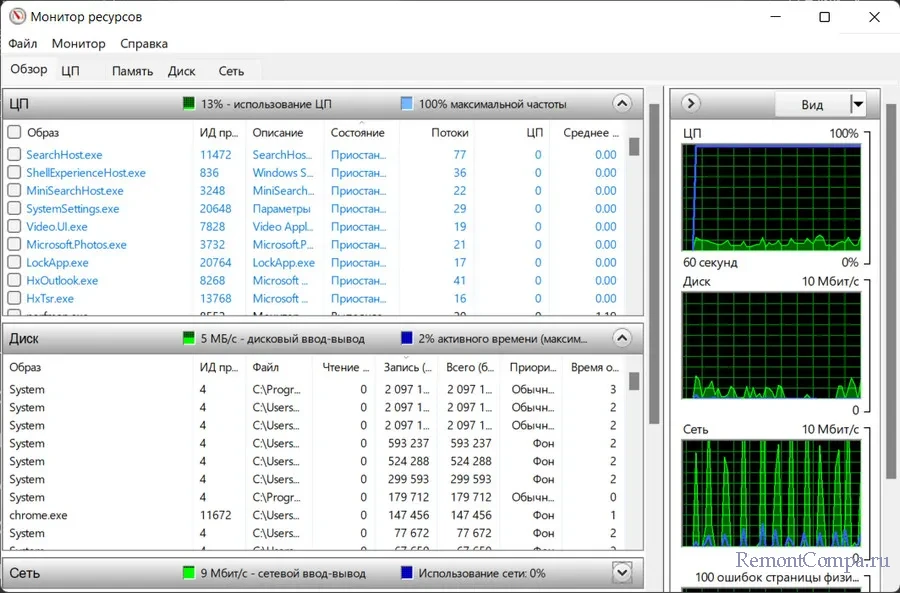
В отдельных вкладках процессора, памяти, диска и сети можем увидеть дополнительную информацию об использовании этих ресурсов.
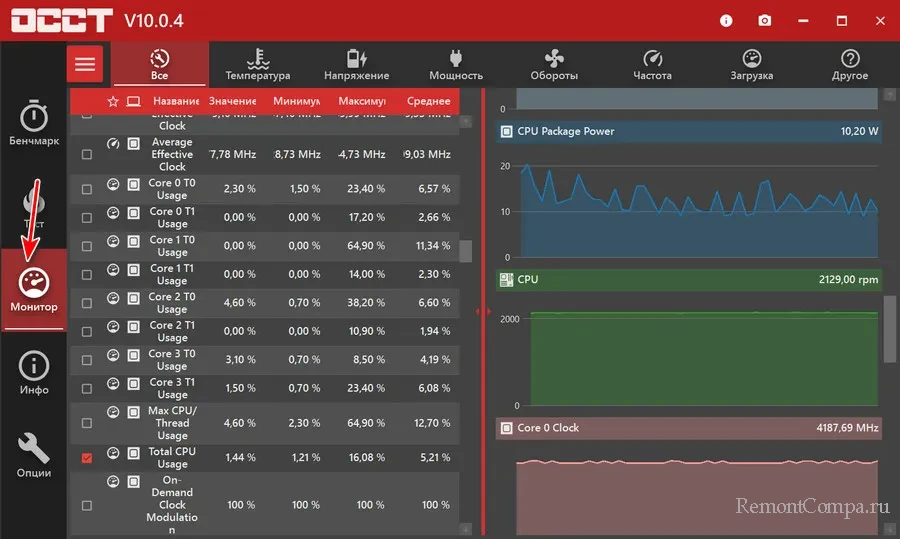
Ну и, друзья, напоследок разрешите вам представить программу, являющую собой мощнейшее средство мониторинга работы аппаратных компонентов компьютера – бесплатную OCCT. Это программа для тестирования компьютерных компонентов, и в ней отслеживанию текущего их состояния посвящён целый раздел. Здесь у нас не будет, как в мониторе ресурсов Windows детализации по системным процессам, OCCT заточена конкретно под аппаратную часть. Нам предлагается распределение нагрузки в процентном выражении на ядра и потоки процессора, на отдельные составляющие видеокарты, на оперативную память. Также можем видеть вольтаж, частоты и прочие метрики отдельных компонентов процессора, материнской платы и видеокарты. Можем видеть скорость работы сетевых устройств, обороты кулера. Есть графики течения нагрузок.
Вот такие, друзья, есть средства мониторинга потребления системных ресурсов для Windows 10 и 11.
Keep resource consumption in check for best performance
by Milan Stanojevic
Milan has been enthusiastic about technology ever since his childhood days, and this led him to take interest in all PC-related technologies. He’s a PC enthusiast and he… read more
Updated on
- System monitor tools for Windows 10 and 11 fully diagnose your OS’s performance.
- PC resource monitoring software collects information on system temperature or CPU usage.
- Some PC resource monitoring apps also offer details about network connections.
Keeping track of your system resources is relatively simple in Windows 10 and Windows 11. However, some users prefer using third-party applications to monitor system resources because they offer a better and more straightforward user interface.
If you require complete data for your system performance and processes, using these tools can offer detailed reports for CPU usage or temperature, RAM usage, or hard drive memory.
What does a Resource Monitor do?
There are various ways to monitor resource consumption on Windows. The simplest option is to use the built-in Task Manager. It lists the CPU, Memory, Disk, Network, and GPU usage on the computer and is a free system monitor in Windows 10.
Along with that, it allows users to terminate applications and programs that hog the system resources and cause it to slow down.
But it doesn’t offer much information on critical aspects, making it slightly difficult to identify things, and this is where third-party tools come into the picture. We have listed the best available Windows Resource Monitors in this guide.
What is a Resource and Performance Monitor?
Windows has two built-in tools, the Resource Monitor and the Performance Monitor, both equally useful and handy when troubleshooting performance-related issues with the computer.
The Resource Monitor allows you to view how the various system resources are being consumed, for instance, RAM and CPU. It has a separate tab for each and also plots the resource consumption on a graph for better understanding.
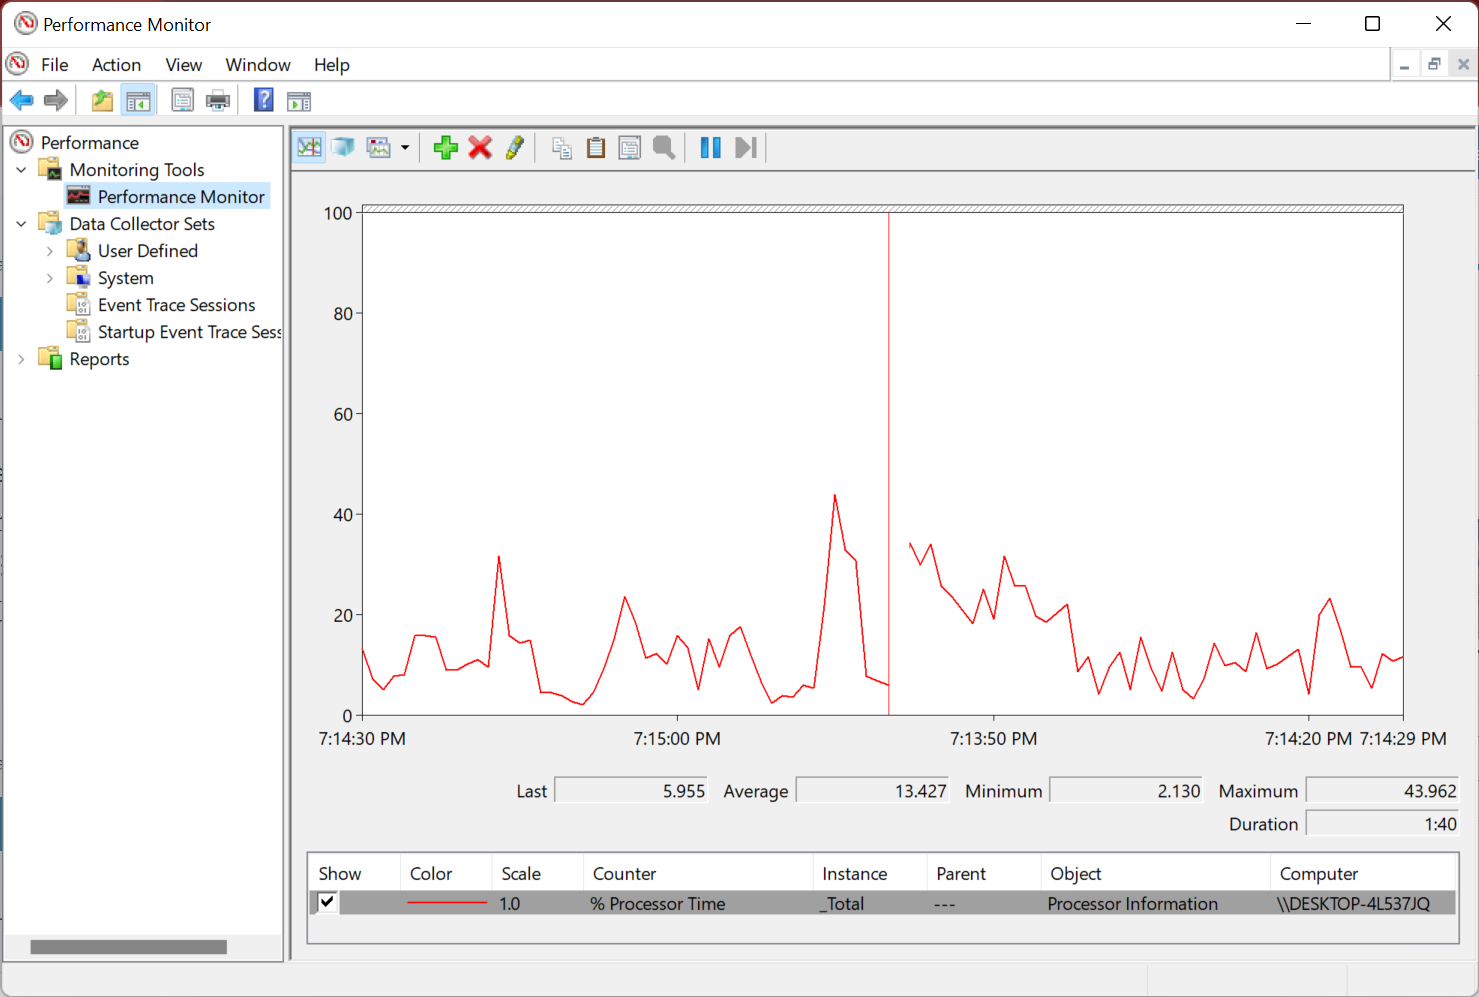
The Performance Monitor, as the name suggests, is used to analyze the performance of the computer and how the various programs and processes run. It provides the option to view this data both in real-time as well as go through the available logs for past performance analysis.
Though, if you’re looking for a dedicated tool to monitor your system resources, we have gathered here a neat list of programs that you need to check out. Also, some of the options here can be used as a Remote System Monitor, while a few offer a Windows 10 system monitor widget.
- What does a Resource Monitor do?
- What is a Resource and Performance Monitor?
- Which are the best system resources monitoring tools?
- Paessler PRTG — Simply the best
- ManageEngine OpManager — Professional-grade tool
- AIDA64 Extreme — Provides comprehensive monitoring
- Wise System Monitor — Offer a simple UI
- Rainmeter — For easy monitoring
- FreeMeter — For graphical representation of resource consumption
- Solarwind Network Performance Monitor — Best for network monitoring
- Process Explorer — A Task Manager alternative
- TinyResMeter — Lightweight application for older devices
- CPUID HWMonitor — For detailed system information
- Moo0 System Monitor — Easily customizable
- TaskbarMeters — To quickly identify high resource consumption
- How do I check my system performance?
Paessler PRTG – Simply the best
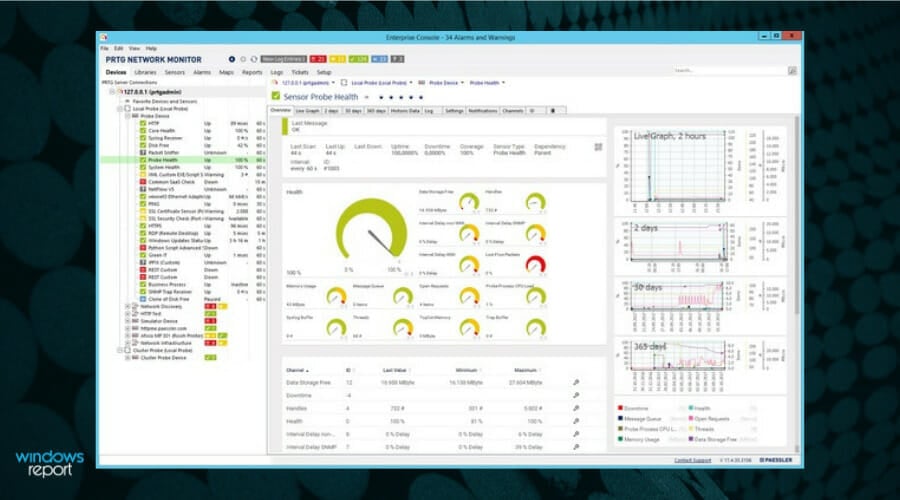
Paessler PRTG, the best Resource Monitor in Windows 10 to download, is an all-in-one software that provides complete monitoring services for your PC, applications, network, and more. Basically, it entails the IT infrastructure at your fingertips.
Anyone should know that monitoring system resources are a must-do task for any PC. So, keeping track of your hardware components using this third-party software can give you detailed data about CPU usage or other processes.
On the same page, you can use PRTG technology to monitor hardware data such as CPU or RAM capabilities, hard drive storage, network printer, routers, and so forth.
Moreover, Paessler offers the possibility to track processes through features like built-in alerting technology, cluster failover solution for safety, real-time maps or dashboards, distributed network monitoring, and a multi-user interface.
To get a better idea, the software monitors your PC components’ performance using different sensors that show how fast the processor goes. As an example, an SNPM CPU load is a sensor used to monitor your network channels and see helpful data.
Thus, keeping an eye on the system resources, contribute to better functionality on your device, also monitors traffic-related information at a glance.

Paessler PRTG
Consider a monitoring software that handles your PC performance seamlessly. Try out Paessler PRTG!
ManageEngine OpManager – Professional-grade tool
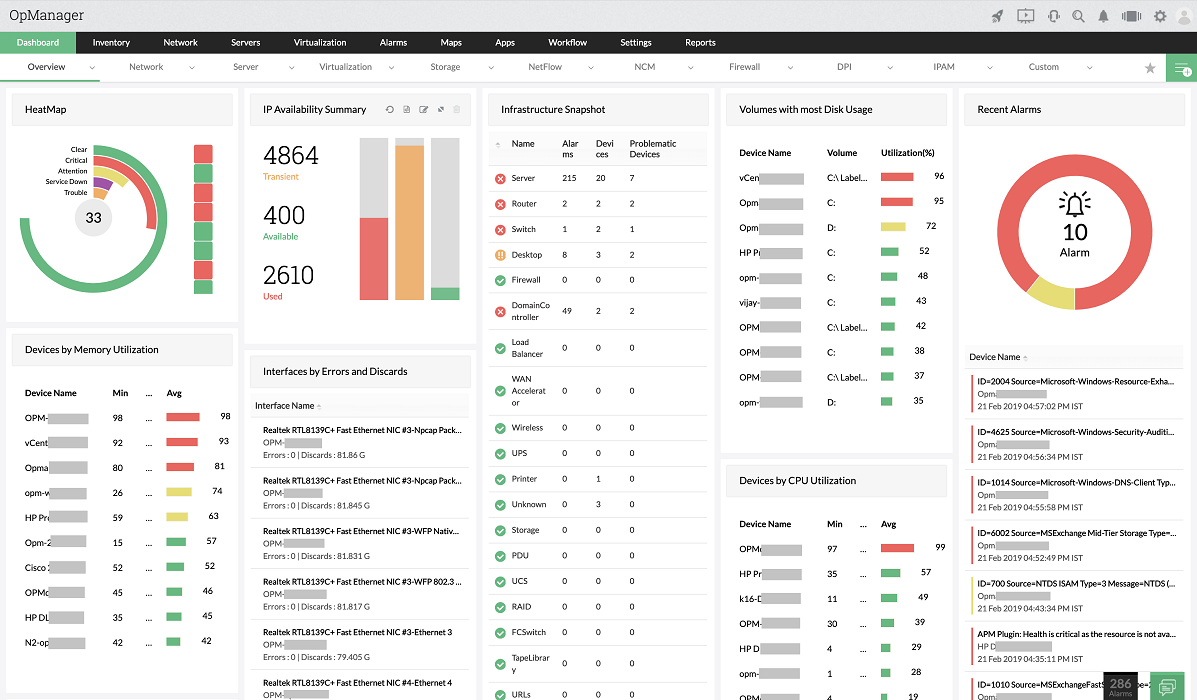
If you need real-time monitoring for all the devices on your network, we recommend using a professional tool such as ManageEngine OpManager.
First, with this tool, you don’t need to add the devices manually because it automatically detects and adds them to your software in the right category.
Then it applies one of the preexisting templates to all of them based on their category. OpManager has 9,500 device templates out-of-the-box and it supports over 53,000 vendor templates.
And these templates each contain a set of performance monitors that will help you supervise their health in real time.
Of course, you can customize the list of monitors as you need and then see the graphical representation of the output for each component right on your dashboard.
You may also select filters or thresholds and set the software to be alerted when these parameters are not on par with your specifications.
This will help you take action and troubleshoot the respective Windows computer before the situation gets critical.
Here are some of its most important features:
- 9,500 device templates out-of-the-box
- Real-time monitoring of all key metrics
- Graphical representation of the performance monitor’s output
- Cloud-based dashboard accessible from anywhere in the world
- The solution is scalable to any network size

ManageEngine OpManager
Follow the real-time metrics of all the Windows PC in a network and manage your network easily!
AIDA64 Extreme – Provides comprehensive monitoring

AIDA64 Extreme is a comprehensive system analyzer and benchmark tool which includes some powerful features such as CPU, RAM, GPU, and system functionalities monitoring.
It can also offer benchmarks and can provide a detailed audit of your system resources.
Its interface is very intuitive and similar to Microsoft Console Management. You can consult a large number of activity indicators.
This software also allows you to stress test all your components in a large variety of combinations.
You will also have great support from AIDA’s team at your disposal. Download and give it a try.

Aida64
Get real-time diagnostics about an overclocked system and support to measure your device’s performance.
Wise System Monitor – Offer a simple UI

Wise System Monitor, one of the best System Monitors in Windows 10, is another useful tool that can help you monitor system resources. The main tool allows you to see all your running processes and see how much of the computer resources they use.
How we test, review and rate?
We have worked for the past 6 months on building a new review system on how we produce content. Using it, we have subsequently redone most of our articles to provide actual hands-on expertise on the guides we made.
For more details you can read how we test, review, and rate at WindowsReport.
There’s also a Hardware monitor included that allows you to see all hardware-related information. You can see detailed information about your motherboard, CPU, graphics card, memory, etc.
If you want, you can also see relevant information about your operating system.
As for the resource monitor, it is at the bottom right corner, just above your Taskbar. The tool will display information such as download and upload speed, RAM and CPU usage, as well as CPU temperature.
If you want to see detailed information, you just need to click a certain field, and you’ll see which applications are using most of that resource.
Wise System Monitor is a decent tool for monitoring your system resources. The tool keeps all information easily accessible, so it’s perfect for basic users.
Wise System Monitor also allows you to see your system information which can be rather useful for some users.
This is a free and simple application, and the only flaw might be the lack of any customization.
If you’re looking for a straightforward application to monitor system resources, be sure to check Wise System Monitor.

Wise System Monitor
See detailed, but easy-to-understand information regarding your system and hardware status with this free tool.
Rainmeter – For easy monitoring
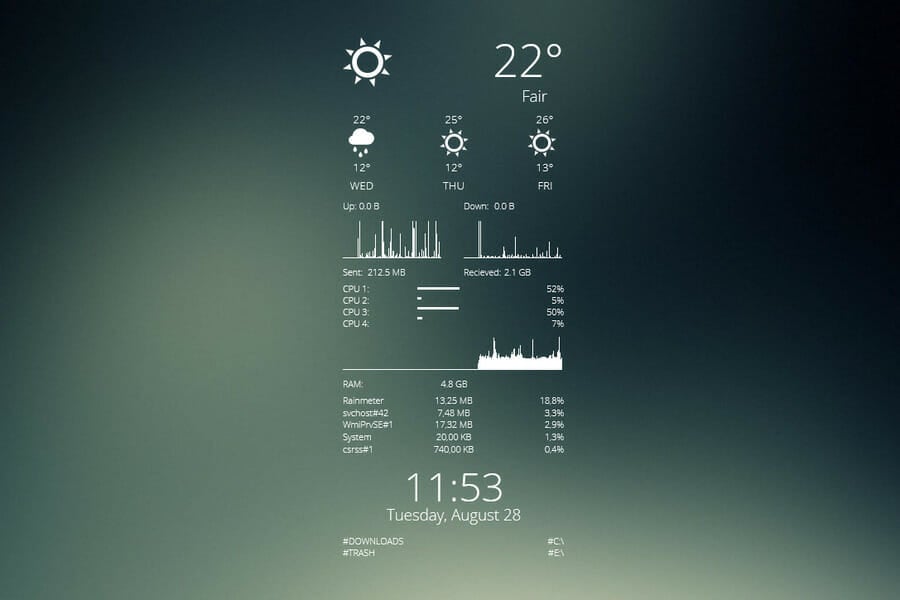
Rainmeter is a simple open-source tool that lets you monitor your system resources. The tool will display small gadgets on your desktop so you can easily monitor your CPU and RAM usage.
In addition, you can check the hard drive space as well as the speed for upload and download with the Resource Monitor.
You can easily choose which gadgets you want to display, and you can easily move the gadgets anywhere on your screen.
Although Rainmeter is simple to use, it offers extensive support for customization. By customizing this tool, you can add new skins and a new feature to the application.
If you’re not a developer, there’s an active community that is constantly developing new skins and features.
Rainmeter is available in a portable version, so there’s no need to install it on your PC to run it.
The tool offers all the basic features that you need, but if you want to use the full potential of Rainmeter, we strongly suggest that you try using different skins for the tool.
This is a great tool for system monitoring, but basic users might be turned away by extensive customization.
⇒ Get Rainmeter
FreeMeter – For graphical representation of resource consumption

If you’re looking for a reliable and easy-to-use tool to monitor system resources, you should consider FreeMeter. The application has a simple user interface, and it will show you all the necessary information in the form of graphs.
The tool offers comprehensive performance information that will help you tackle any issue in order to get the best experience possible.
FreeMeter shows easy-to-follow reports and real-time status updates of your system uptime as well as hard drive space.
Along with that, it monitors CPU usage. The professional version can display kernel CPU usage and user CPU usage separately.
In terms of Internet connection, the software is able to monitor both wireless and Ethernet speeds separately.
It can also help with troubleshooting and fixing latency issues. FreeMeter monitors network ping and helps with slow connections.
FreeMeter offers a free version as well as a premium one with a larger set of features. Give it a try and see if it meets your needs.
⇒ Get FreeMeter
Solarwind Network Performance Monitor – Best for network monitoring

This multi-solution company can offer multi-vendor network monitoring on your own PC that shows network connection data at a glance.
Using this comprehensive software, you can see detailed information for network performance aspects like hardware internet issues or cloud server monitoring.
According to your monitoring needs, it’s easy to control your IT infrastructure with a detailed view of physical network performance or cloud server data.
More so, you have absolute control over the network processes and document every matter regarding the connectivity with key metrics and drill-down analysis meant to cover everything.
It is also possible to monitor and analyze Cisco devices’ networks from the comfort of your home. More exactly, you have access to availability or performance graphics in one view.
If you need to detect Cisco routers or other devices, it can’t be more simple than automatically discovering and identifying the network.
Furthermore, for more insights, you can run packet inspections and see network slowdown problems and their causes.
Analyzing over 1.200 applications to see the response time or classifying network traffic gives you the perfect methods to resolve the issues.
Finally, you will efficiently manage the network performance with instant notifications when issues arrive and critical health data for network hardware.
⇒ Get Solarwind Network Performance Monitor
Process Explorer – A Task Manager alternative
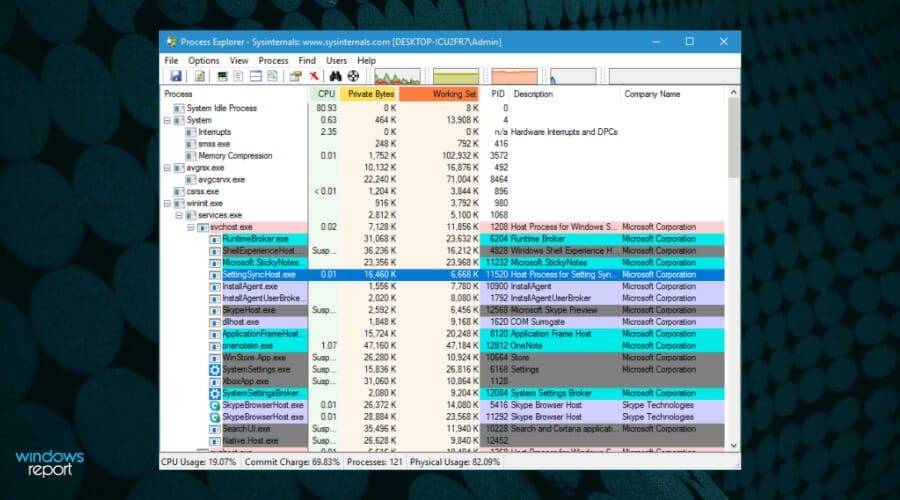
Process Explorer is designed as a Task Manager alternative, and this tool will list all your active processes. Using this tool, you can easily end a process or change its priority.
In addition, you can also monitor system resources by using Process Explorer.
There are four graphs available in Process Explorer, and each graph represents a single resource. If you want detailed information, simply click one of the graphs, and a new window will appear.
From there, you can see the summary or check the CPU, memory, I/O, and GPU usage individually.
This tool also comes with a small graph that will appear in your Taskbar so you can constantly monitor your system resources.
Process Explorer is a great Task Manager alternative, but it can also be used to monitor system resources. This application is free and portable, so be sure to give it a try.
⇒ Get Process Explorer
TinyResMeter – Lightweight application for older devices
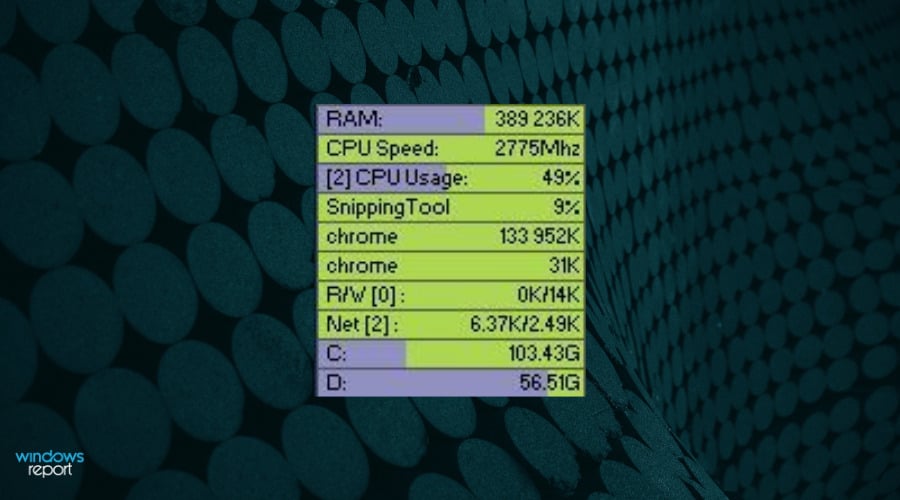
Another simple tool that allows you to monitor system resources is TinyResMeter. This is a portable and lightweight application, so it can run on almost any PC.
The application doesn’t have a visually appealing user interface, but it will show you all the necessary information.
System information can be displayed in a horizontal or vertical menu. If you want, you can customize the font and colors, but you can also customize available fields.
You can also enter your own labels for the fields. As for available fields, you can display RAM, CPU speed, CPU usage, network speed, etc.
TinyResMeter comes with a bit outdated interface, but it can still be useful. The tool allows you to right-click each field and see detailed information about it.
For example, by right-clicking your hard drive, you can see the total amount of space, label, system type, and all other necessary information.
As for the flaws, the tool feels a bit sluggish at times, and there’s also one visual bug that we noticed.
Every time you hover your mouse over the TinyResMeter, it will turn black, and after a second, it will turn back to normal. This is a small bug, but it can be irritating at times.
TinyResMeter is a simple and portable application that lets you monitor system resources. Despite its simplicity, the application feels a bit outdated, and it has a few minor bugs.
⇒ Get TinyResMeter
CPUID HWMonitor – For detailed system information

If you want to see detailed information regarding your system, HWMonitor is the perfect tool for you.
This system monitor tool is free, and it will allow you to monitor your hardware and see all the relevant information.
The application comes with a hardware tree that you can expand in order to see the necessary information. Using this tool, you can see important information such as temperature, fan speed, and utilization.
Although you can see the information about your motherboard, CPU, graphic card, and hard drive, it seems that you can’t see information regarding your RAM or network connection.
Unlike other tools on our list, HWMonitor doesn’t offer a real-time graph, and in order to check your system resources, you’ll need to keep the HWMonitor window open.
This tool offers a lot of information about your hardware, and it can be useful if you want to know more about your components. As for resource monitoring, the tool offers almost all necessary information, but some users might have issues finding the desired information.
HWMonitor is a decent tool, it’s free and portable, but it doesn’t show any information regarding your network connection or RAM, which is its biggest flaw, in our opinion.
⇒ Get HWMonitor
Moo0 System Monitor – Easily customizable

Moo0 System Monitor is a free and portable tool for monitoring system resources. This tool consists of several graphs that show you all the necessary system information.
Using this tool, you can see CPU usage and temperature, GPU usage and temperature, amount of free memory, HDD temperature, network speed, etc.
If you want, you can also add additional fields to show more information.
The tool supports some customization, and you can change the size of the tool or its transparency. You can also auto-hide this tool after a certain period of inactivity.
The tool also supports many different color schemes, and you can even set the color scheme to change automatically.
Moo0 System Monitor is a great tool, it’s simple and portable, so it will be perfect for both basic and advanced users.
We have to mention that this tool can sometimes take up a lot of space on your screen depending on the number of fields that you have, so keep that in mind.
Overall, Moo0 System Monitor is a great tool, and you should definitely check it out.
⇒ Get Moo0 System Monitor
TaskbarMeters – To quickly identify high resource consumption

Taskbar Meters is a set of applications that allows you to monitor your system resources. There are three applications available, and they all work the same way.
Each application will position itself in your Taskbar, showing your resource usage.
Every application is designed to change color in the Taskbar, so you’ll quickly notice if you’re using too much of your resources.
Using these tools, you can monitor your CPU, RAM, and disk usage, which is more than enough for primary users. Then, if you want, you can adjust the colors or update the frequency of each tool.
We have to mention that these applications use a simple method to display the usage of your system resources.
Unfortunately, using this method, you can’t see the exact numbers, which can be a flaw for some users.
The only flaw of these tools is the lack of ability to show detailed information about CPU, RAM, or disk usage, which can turn away some users.
⇒ Get TaskbarMeters
- Best PC performance monitoring software for Windows 10/11
- Best cloud monitoring & performance tools
- Best bandwidth monitors for Windows 10/11
- Fix: Low system resources on Windows 10/11 [Easy Guide]
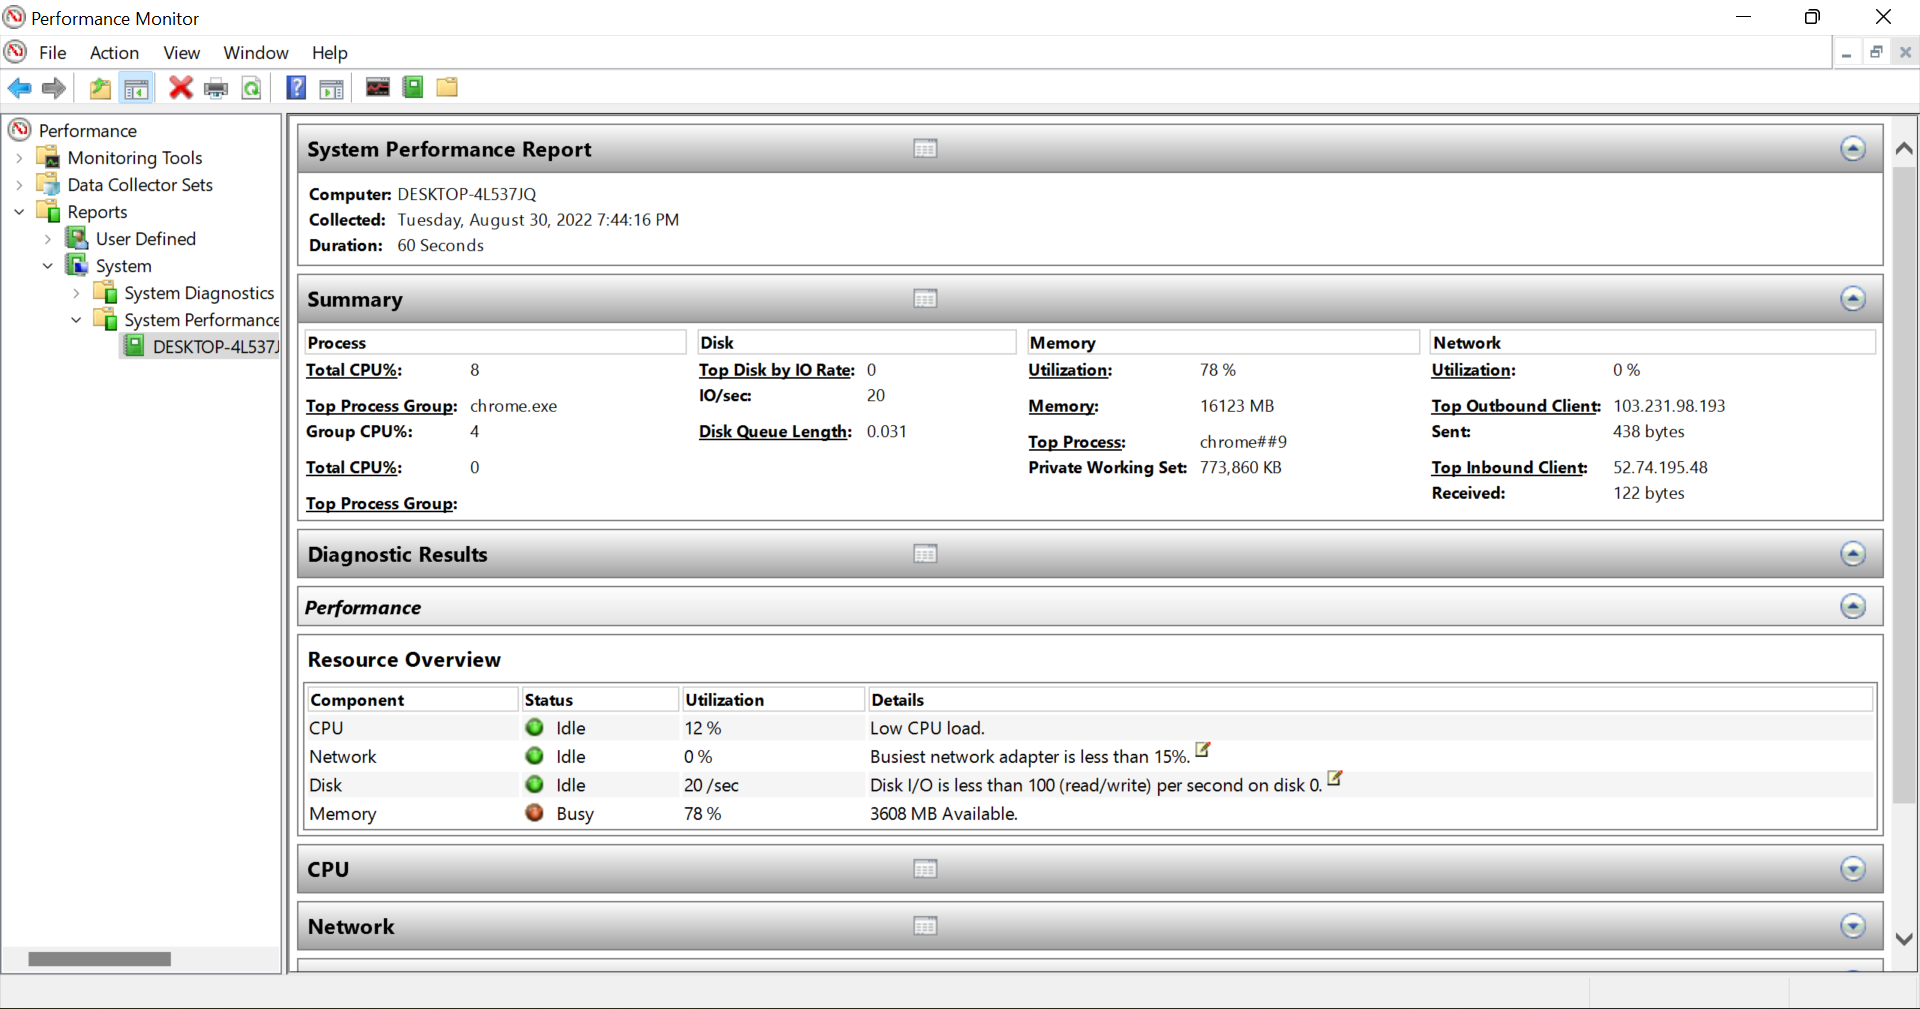
How do I check my system performance?
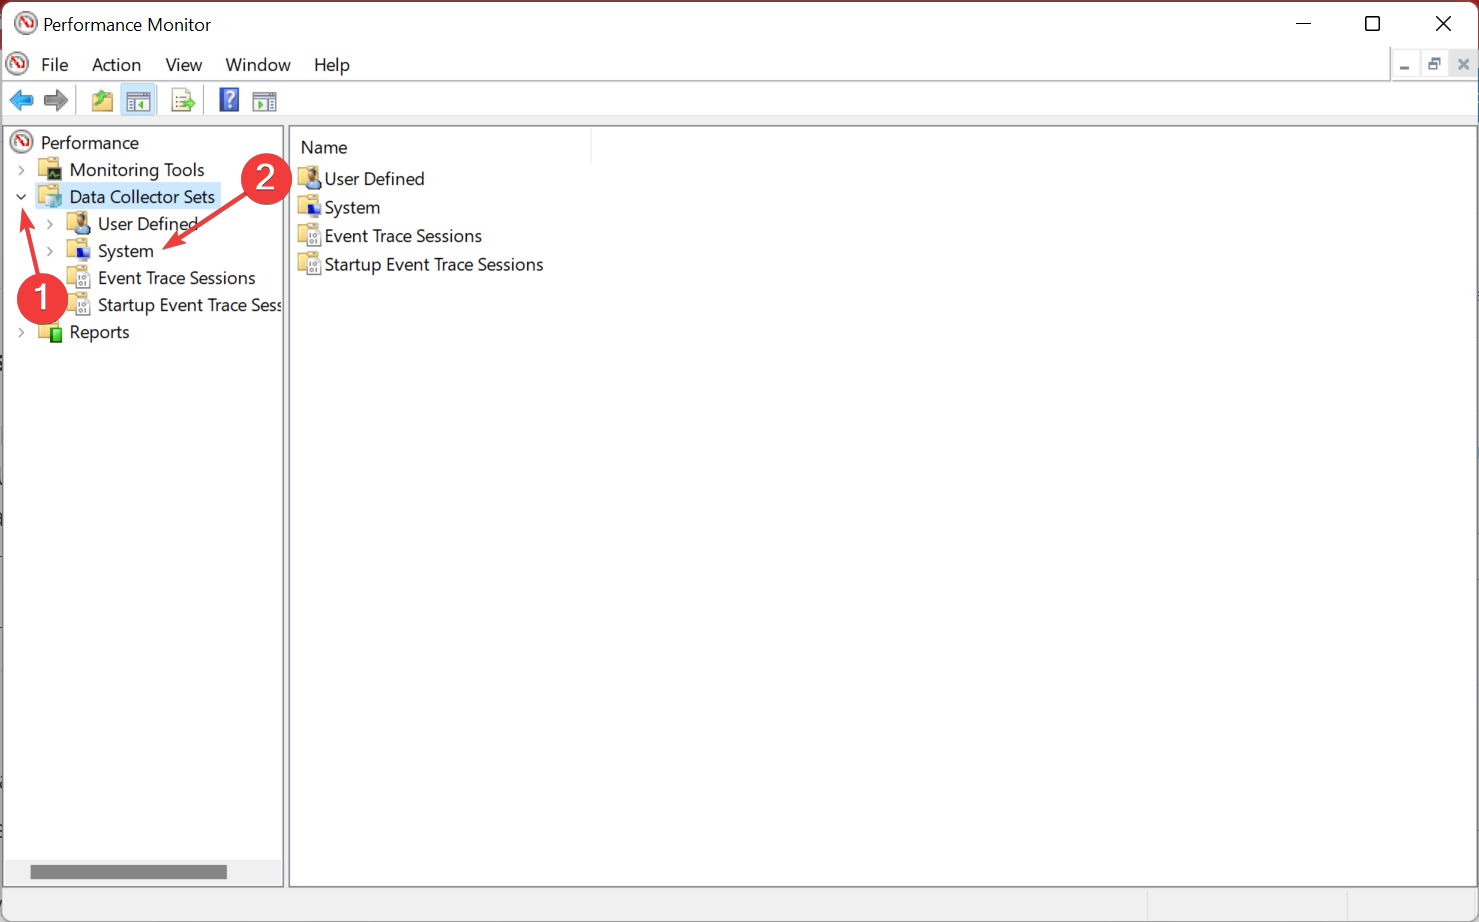
- Open the Performance Monitor, expand Data Collector Sets, and double-click on System under it.

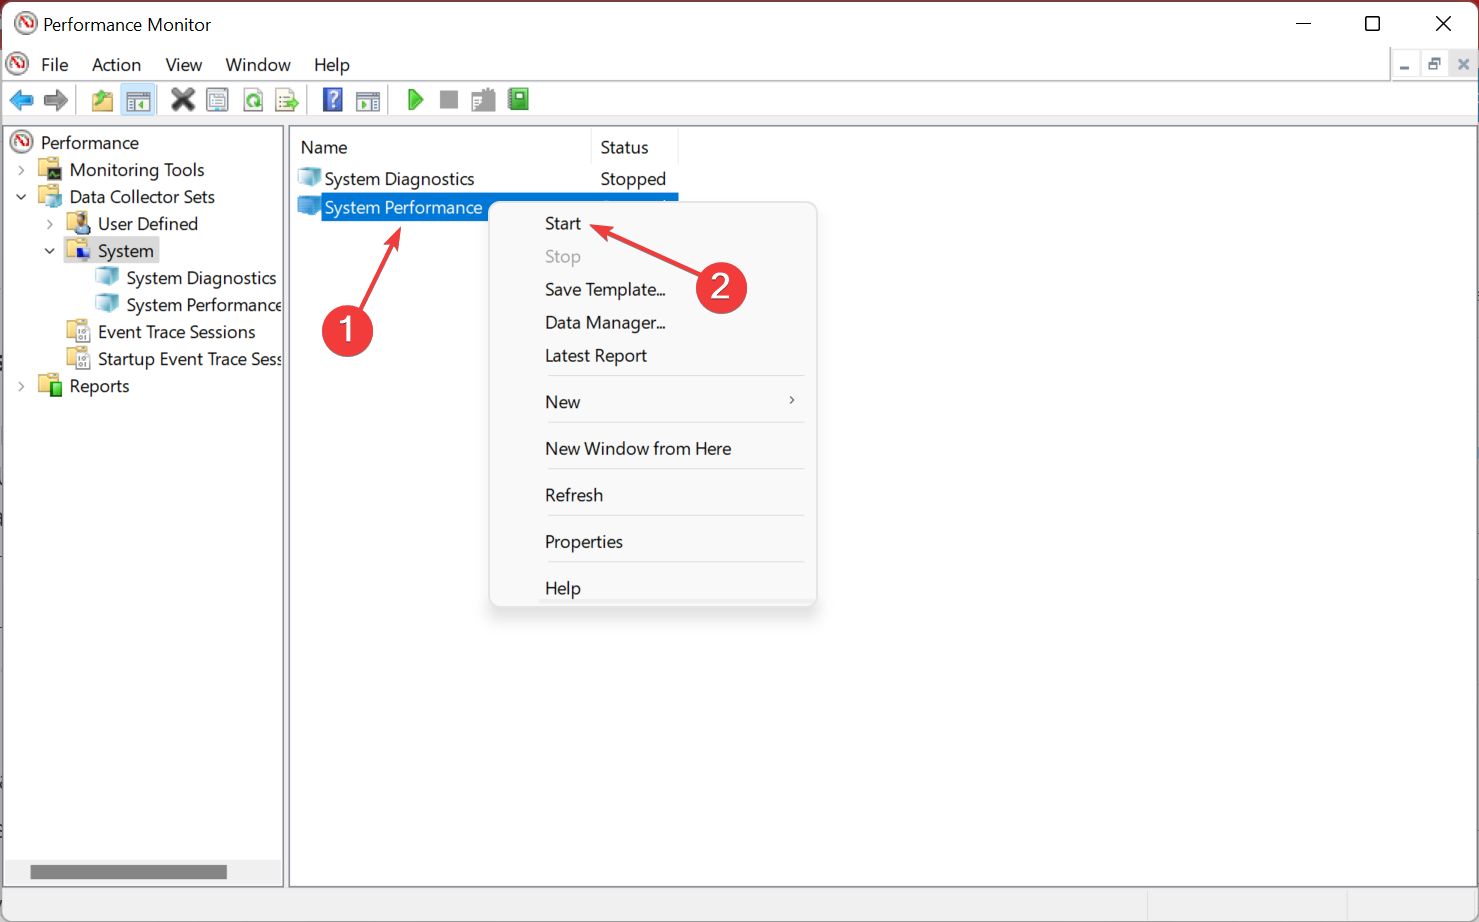
- Right-click on System Performance and select Start.
- This will trigger a 60-second test to analyze the computer’s performance.
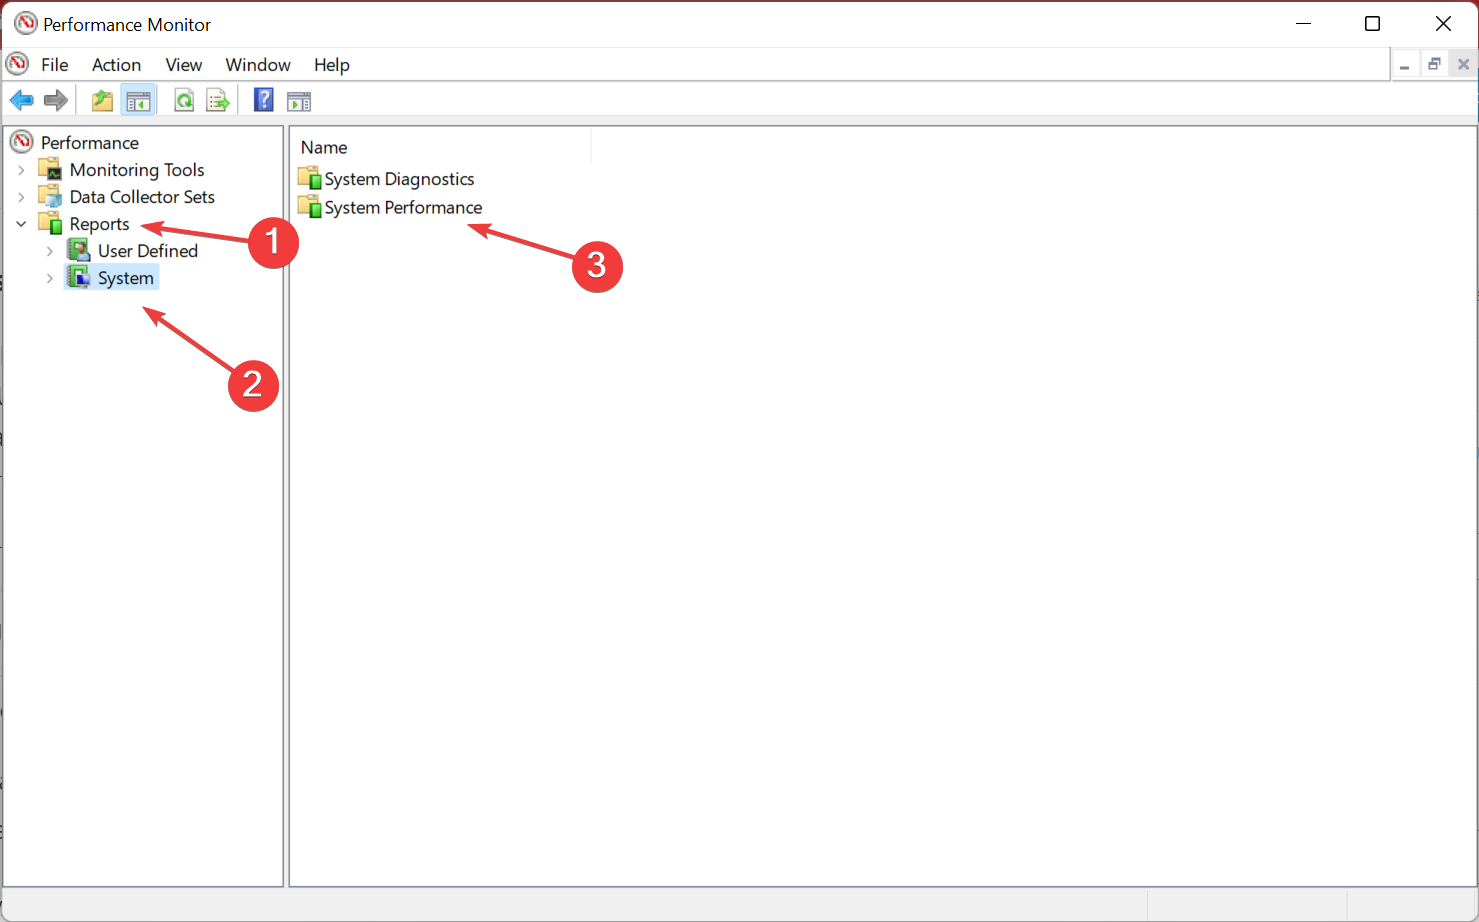
- After the period, expand Reports, select System under it, and then double-click on System Performance.
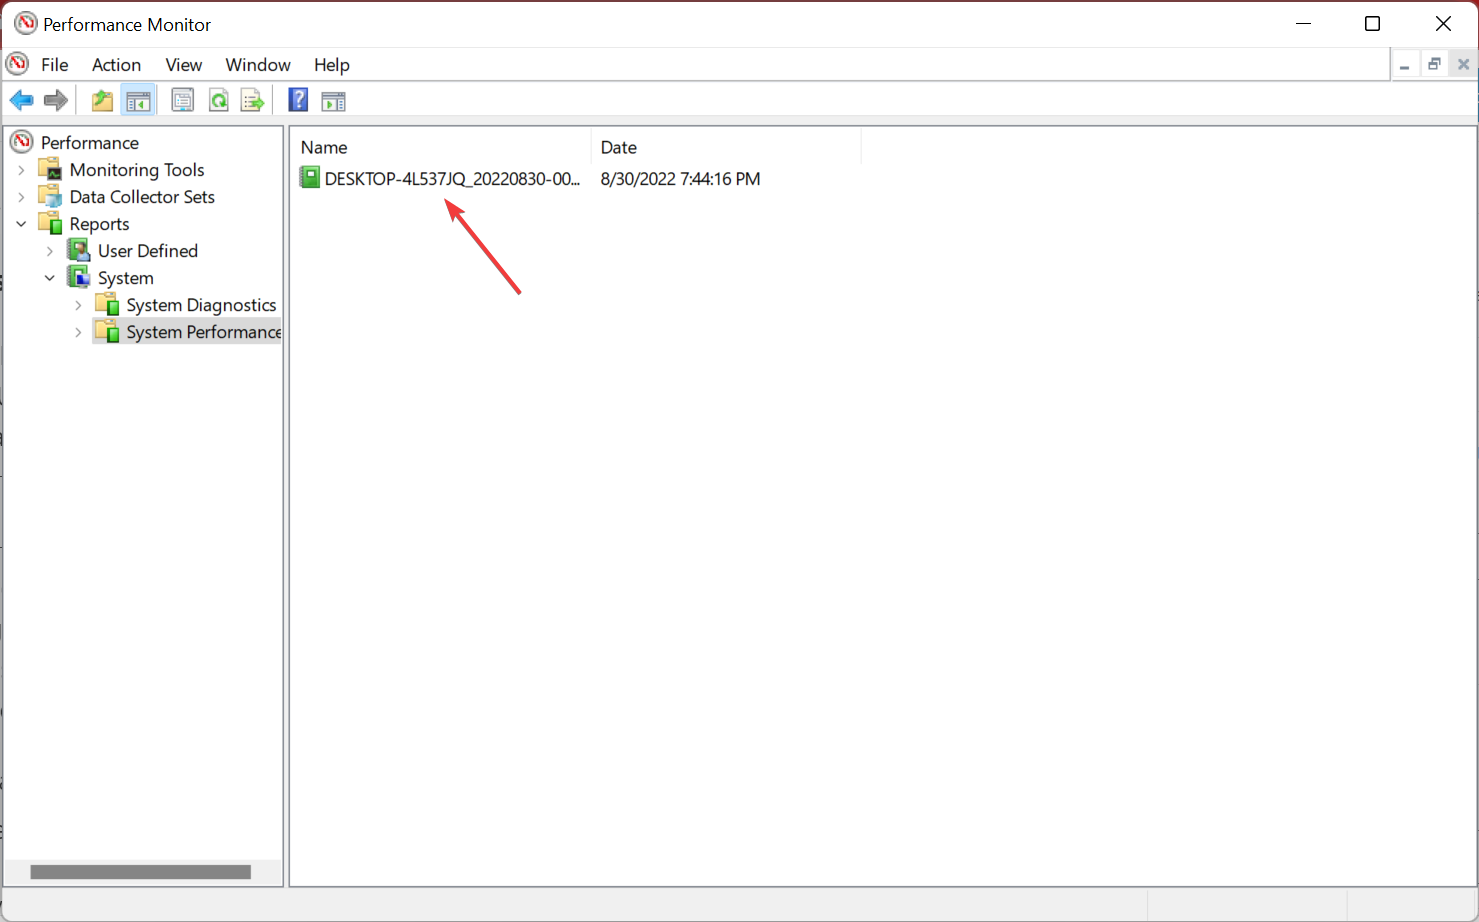
- Now, double-click on the report listed here.
- You can now view the system performance and identify what’s consuming the maximum resources and other critical information.

If you want to monitor system resources, feel free to use any of these tools because they will provide the necessary information.
It is essential to maintain your computer healthy. The first step is to monitor the system resources accordingly, and this list is more than sufficient to provide the best options for everyone and every PC.
You can use the Resource Monitor in Windows 10 for logging data or try the other third-party tools here.
If you found some problems, here’s what you should do if the system runs low on resources on Windows 10/11.
We’d like to hear which of these tools you prefer and why. Use the comments section to get in touch with us.
![]()
Популярные инструменты для Windows, macOS и Linux.
В каждой ОС есть встроенные утилиты вроде «Мониторинга системы» или «Диспетчера задач», которые позволяют отслеживать загрузку процессора, количество свободной оперативной памяти, сетевой трафик и другие параметры.
Они отлично подойдут для разового использования. Но если вам нужно часто отслеживать подобную информацию или вы хотите получить более расширенные данные — лучше воспользоваться специализированными инструментами.
1. Open Hardware Monitor
- Поддерживаемые платформы: Windows.
- Цена: бесплатно.
Удобная утилита для отслеживания температуры процессора и видеокарты, скорости вентиляторов, напряжения батареи, а также других сенсоров. Помимо параметров оборудования, Open Hardware Monitor умеет следить за потреблением ресурсов. Информацию можно просматривать не только в окне приложения, но и через аккуратный виджет, плавающие графики или в трее на панели задач.
Скачать с официального сайта →
2. CPUID HWMonitor
- Поддерживаемые платформы: Windows.
- Цена: бесплатно.
Ещё одна программа для мониторинга показаний сенсоров с большой базой оборудования, которую разработчики всегда поддерживают в актуальном состоянии. Датчики сгруппированы по типу и наглядно отображаются в главном окне. Наиболее востребованные параметры при желании можно вывести на панель задач и настроить их внешний вид.
Скачать с официального сайта →
3. Rainmeter
- Поддерживаемые платформы: Windows.
- Цена: бесплатно.
Мощный инструмент для кастомизации рабочего стола с открытым исходным кодом. Rainmeter поддерживает огромное количество пользовательских скинов, которые не только меняют внешний вид Windows, но и позволяют просматривать разнообразную системную информацию.
В приятных виджетах на рабочем столе отображается загрузка процессора, использование памяти и дискового процессора, а также данные сенсоров оборудования в зависимости от выбранной темы.
Скачать с официального сайта →
- Поддерживаемые платформы: macOS.
- Цена: 12 долларов.
Одна из самых продвинутых утилит для мониторинга, которая отображает любые параметры компьютера и дополнительные данные, вроде календаря или погоды. iStat Menus отличается невероятным количеством настроек и продуманным интерфейсом.
Краткую информацию можно просматривать в статусной строке macOS, а более подробную — в выпадающем меню. Причём в последнем случае она подаётся порционно: при наведении на любой параметр раскрываются детальные данные, которые, в свою очередь, тоже разворачиваются в ещё более подробный отчёт.
Скачать с официального сайта →
- Поддерживаемые платформы: macOS.
- Цена: 449 рублей.
Ещё один мощный инструмент для всестороннего отслеживания системных ресурсов и информации с датчиков внутренних компонентов. Процессор, память, диск, сеть, батарея, Bluetooth, температура — всё это будет у вас перед глазами в строке меню.
Нажатие на иконку одного из параметров откроет окошко с подробной статистикой. Последнюю можно просматривать в виде комбинированной сводки по всем данным или отдельно по каждому из элементов.
Скачать с официального сайта →
6. Stats
- Поддерживаемые платформы: macOS.
- Цена: бесплатно.
Полностью бесплатная альтернатива двум предыдущим приложениям, не уступающая им по возможностям. Stats очень похож на iStat Menus как по функциям, так и по дизайну. Самые важные показатели отображаются в строке меню, а подробная статистика по каждому из них — в небольшом окошке по клику. Любой из элементов легко настраивается, а для максимально гармоничного встраивания в систему реализована поддержка тёмной темы оформления.
Скачать с официального сайта →
7. Conky
- Поддерживаемые платформы: Linux.
- Цена: бесплатно.
Один из самых популярных инструментов для системного мониторинга в Linux, который умеет выводить на рабочий стол практически любую информацию: от количества памяти и температуры процессора до погоды и играющего в плеере трека.
Conky очень гибко настраивается до мельчайших деталей. Правда, делается это через конфигурационный файл. Но это не проблема, поскольку в Сети можно найти множество уже настроенных виджетов на любой вкус.
Скачать с официального сайта →
8. Bashtop
- Поддерживаемые платформы: Linux.
- Цена: бесплатно.
Ещё более функциональная утилита с огромными возможностями мониторинга и настройки. Bashtop работает внутри терминала и понравится всем, кто любит консоль и проводит там много времени. Несмотря на ограничения текстового интерфейса, программа имеет довольно симпатичный внешний вид и наглядно отображает массу параметров.
Скачать с официального сайта →
9. Stacer
- Поддерживаемые платформы: Linux.
- Цена: бесплатно.
Полезное приложение для оптимизации и настройки различных системных данных, которое в числе прочего предлагает и базовые возможности для мониторинга. На главном экране отображается конфигурация ПК, а также ключевые характеристики вроде памяти и процессора. Дополнительно можно вывести графики использования ресурсов в режиме реального времени и настроить их.
Скачать с официального сайта →
Читайте также 🧐
- Как установить SSD в ноутбук или стационарный ПК
- Как установить Linux: подробнейшая инструкция
- 12 программ на Windows 10, которые вы должны удалить прямо сейчас
- Как переустановить macOS
- 14 лучших программ для оптимизации Windows 10
 Монитор ресурсов — инструмент, позволяющий оценить использование процессора, оперативной памяти, сети и дисков в Windows. Часть его функций присутствуют и в привычном диспетчере задач, но если вам требуется более подробная информация и статистика, лучше воспользоваться описываемой здесь утилитой.
В этой инструкции подробно рассмотрим возможности монитора ресурсов и на конкретных примерах посмотрим, какую информацию с помощью него можно получить. См. также: Встроенные системные утилиты Windows, о которых полезно знать.
Другие статьи на тему администрирования Windows
- Администрирование Windows для начинающих
- Редактор реестра
- Редактор локальной групповой политики
- Работа со службами Windows
- Управление дисками
- Диспетчер задач
- Просмотр событий
- Планировщик заданий
- Монитор стабильности системы
- Системный монитор
- Монитор ресурсов (эта статья)
- Брандмауэр Windows в режиме повышенной безопасности
Запуск монитора ресурсов
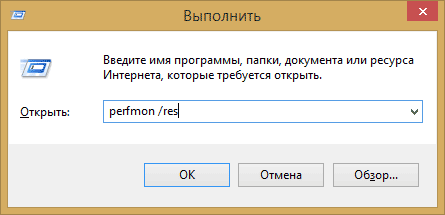
Способ запуска, который одинаково будет работать и в Windows 10 и в Windows 7, 8 (8.1): нажмите клавиши Win + R на клавиатуре и введите команду perfmon /res
Еще один способ, который так же подойдет для всех последних версий ОС — зайти в Панель управления — Администрирование, и выбрать там «Монитор ресурсов».
В Windows 8 и 8.1 вы можете использовать поиск на начальном экране для запуска утилиты.
Просмотр активности на компьютере с помощью монитора ресурсов
Многие, даже начинающие пользователи, сносно ориентируются в диспетчере задач Windows и умеют найти процесс, который тормозит систему, или который выглядит подозрительным. Монитор ресурсов Windows позволяет увидеть еще больше подробностей, которые могут потребоваться для решения возникших с компьютером проблем.
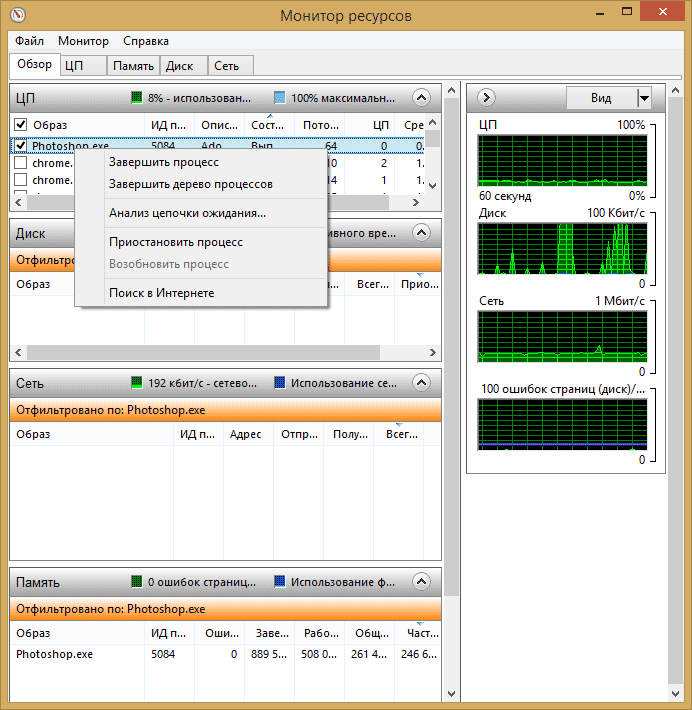
На главном экране вы увидите список запущенных процессов. Если отметить любой из них, внизу, в разделах «Диск», «Сеть» и «Память» отобразятся активности только выбранных процессов (используйте кнопку со стрелкой для того, чтобы открыть или свернуть любую из панелей в утилите). В правой части находится графическое отображение использования ресурсов компьютера, хотя на мой взгляд, лучше свернуть эти графики и опираться на цифры в таблицах.
Нажатие правой кнопкой мыши по любому процессу позволяет завершить его, а также все связанные процессы, приостановить или же найти информацию о данном файле в Интернете.
Использование центрального процессора
На вкладке «ЦП» вы можете получить более подробную информацию об использовании процессора компьютера.

Также, как и в главном окне, вы можете получить полные сведения только об интересующей вас запущенной программе — например, в разделе «Связанные дескрипторы» отображается информация об элементах системы, которые использует выбранный процесс. И, если к примеру, файл на компьютере не удаляется, так как занят каким-либо процессом, вы можете отметить все процессы в мониторе ресурсов, ввести имя файла в поле «Поиск дескрипторов» и узнать, какой именно процесс его использует.
Использование оперативной памяти компьютера
На вкладке «Память» в нижней части вы увидите график, отображающий использование оперативной памяти RAM на вашем компьютере. Обратите внимание, что если вы увидите «Свободно 0 мегабайт», не стоит переживать по этому поводу — это нормальная ситуация и в действительности, память, отображенная на графике в графе «Ожидание» — это тоже своего рода свободная память.

В верхней части — все тот же список процессов с подробной информацией по использованию ими памятью:
- Ошибки — под ними понимаются ошибки, когда процесс обращается к оперативной памяти, но не находит там чего-то, что нужно, так как информация была перемещена в файл подкачки из-за недостатка RAM. Это не страшно, но если вы видите много таких ошибок, следует задуматься об увеличении количества оперативной памяти на компьютере, это поможет оптимизировать скорость работы.
- Завершено — эта колонка показывает, какой объем файла подкачки был использован процессом за все время его работы после текущего запуска. Цифры там будут достаточно большие при любом количестве установленной памяти.
- Рабочий набор — количество памяти, используемое процессом в настоящий момент времени.
- Частный набор и общий набор — под общим объемом подразумевается тот, который может быть освобожден для другого процесса, если ему станет не хватать RAM. Частный набор — память, строго отведенная конкретному процессу и которая не будет передана другому.
Вкладка Диск
На данной вкладке вы можете просмотреть скорость операций чтения записи каждого процесса (и суммарный поток), а также увидеть список всех запоминающих устройств, а также свободного места на них.

Использование сети

С помощью вкладки «Сеть» монитора ресурсов вы можете просмотреть открытые порты различных процессов и программ, адреса, по которым они обращаются, а также узнать, разрешено ли данное соединение брандмауэром. Если вам кажется, что какая-то программа вызывает подозрительную сетевую активность, кое-какую полезную информацию можно почерпнуть именно на этой вкладке.
Видео об использовании монитора ресурсов
На этом завершаю статью. Надеюсь, для тех, кто не знал о существовании данного инструмента в Windows, статья будет полезной.
-
Home
-
News
- Top 6 Resource Monitor Software for Windows 10/11 or Mac
By Alisa |
Last Updated
This post introduces some top resource monitor software for Windows 10/11 or Mac to help you monitor and measure the real-time usage of your computer resources like CPU, disk, memory, network, etc. For more computer tips and tricks, you may visit MiniTool Software official website.
You can use a professional resource monitor software to monitor the resource usage of your computer hardware and software components. Check the top 6 free resource monitor apps for Windows 10/11 or Mac below.
Top 6 Resource Monitor Software for Windows 10/11
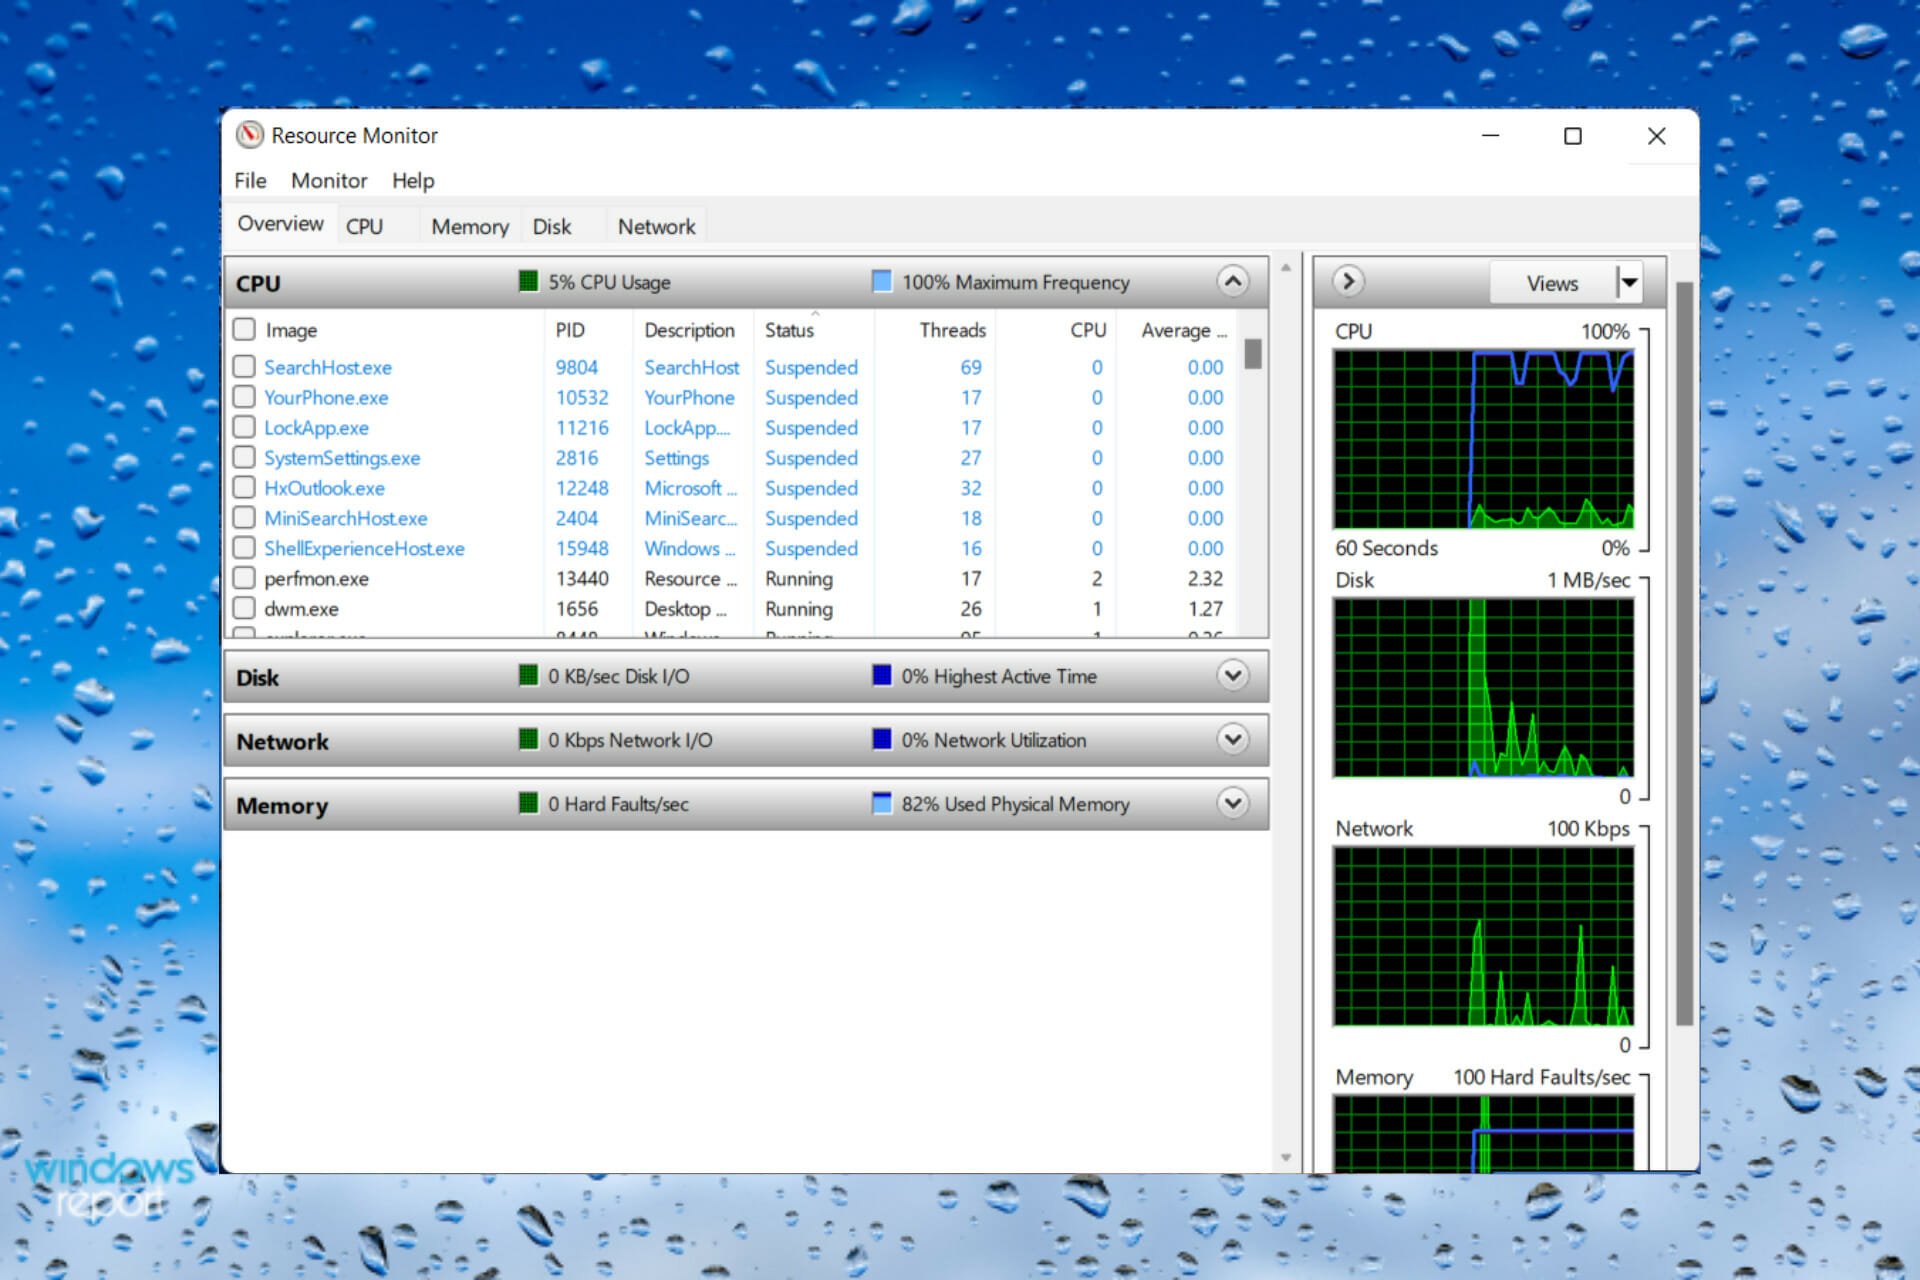
1. Resource Monitor
Windows has a built-in Resource Monitor that displays information about the use of computer hardware and software resources in real-time. You can see the information of CPU, memory, disk, and network.
To open the Resource Monitor on Windows 10/11, you can press Windows + R, type resmon.exe in the Run dialog, and press Enter to quickly open the Resource Monitor app on Windows 10/11.
Alternatively, you can also click Start, type resource monitor in the Search box, and choose Resource Monitor to open it.
2. Performance Monitor
Windows also has another resource monitor software named Performance Monitor that helps you detect your computer’s performance. Also called System Monitor, it is a system monitoring program that can monitor various activities on a computer like CPU and memory usage. It helps measure the performance of hardware and software services and applications. You may use it to determine the cause of problems of a computer.
3. Paessler PRTG
If you are looking for a third-party application to help track your computer component’s performance, you can try this program. Paessler PRTG is a professional network monitoring tool. You can use it to monitor and classify system conditions like bandwidth usage or uptime, and collect statistics from various hosts like switches, routers, servers, and other services and applications.
4. AIDA64 Extreme
This is a professional system information diagnostic tool that can diagnose and display detailed information about the hardware and installed software on your PC. It helps you diagnose hardware issues and offers benchmarks to measure the performance of your computer. It also supports overclocking. It is compatible with all Windows editions including Windows 11 and Windows Server 2022.
5. Wise System Monitor
To monitor the performance of various hardware components of your computer, you can also try this free resource monitor for Windows 11/10. It helps monitor processes, hardware, network traffic, memory, and many other things. It is a simple and comprehensive PC monitoring tool that lets you know what is consuming your RAM and CPU, which part of your PC is overheated, etc. It helps you keep an eye on all the running processes in your system. It displays detailed information of the main hardware components like CPU, motherboard, RAM, graphics card, hard disk, network card, sound card, etc.
6. Network Performance Monitor
This is also a professional network monitoring tool that features multi-vendor network monitoring, network insights for deeper visibility, intelligent maps, NetPath and PerfStack for easy troubleshooting, etc. It offers a free trial version.
Best Free Resource Monitor for Mac
For Mac users, you can use the built-in free Activity Monitor to monitor your CPU, network, disk usage, and other components’ performance. You can also use it to troubleshoot problems on a Mac computer.
To open Activity Monitor on Mac, you can go to Applications -> Utilities, and double-click Activity Monitor to open the app.
Bottom Line
This post introduces some top resource monitor software for Windows 10/11 or Mac to help you keep an eye on the performance and resource usage of various computer components. Hope it helps.
If you have other computer problems, you can visit MiniTool News Center. MiniTool Software also provides some tools like MiniTool Partition Wizard, MiniTool Power Data Recovery, MiniTool ShadowMaker, MiniTool MovieMaker, MiniTool Video Converter, and more.
About The Author
Position: Columnist
Alisa is a professional English editor with 4-year experience. She loves writing and focuses on sharing detailed solutions and thoughts for computer problems, data recovery & backup, digital gadgets, tech news, etc. Through her articles, users can always easily get related problems solved and find what they want. In spare time, she likes basketball, badminton, tennis, cycling, running, and singing. She is very funny and energetic in life, and always brings friends lots of laughs.