In this tutorial, you configure Visual Studio Code to use the Microsoft Visual C++ compiler and debugger on Windows.
After configuring VS Code, you will compile and debug a simple Hello World program in VS Code. This tutorial does not teach you details about the Microsoft C++ toolset or the C++ language. For those subjects, there are many good resources available on the Web.
If you have any problems, feel free to file an issue for this tutorial in the VS Code documentation repository.
Prerequisites
To successfully complete this tutorial, you must do the following:
-
Install Visual Studio Code.
-
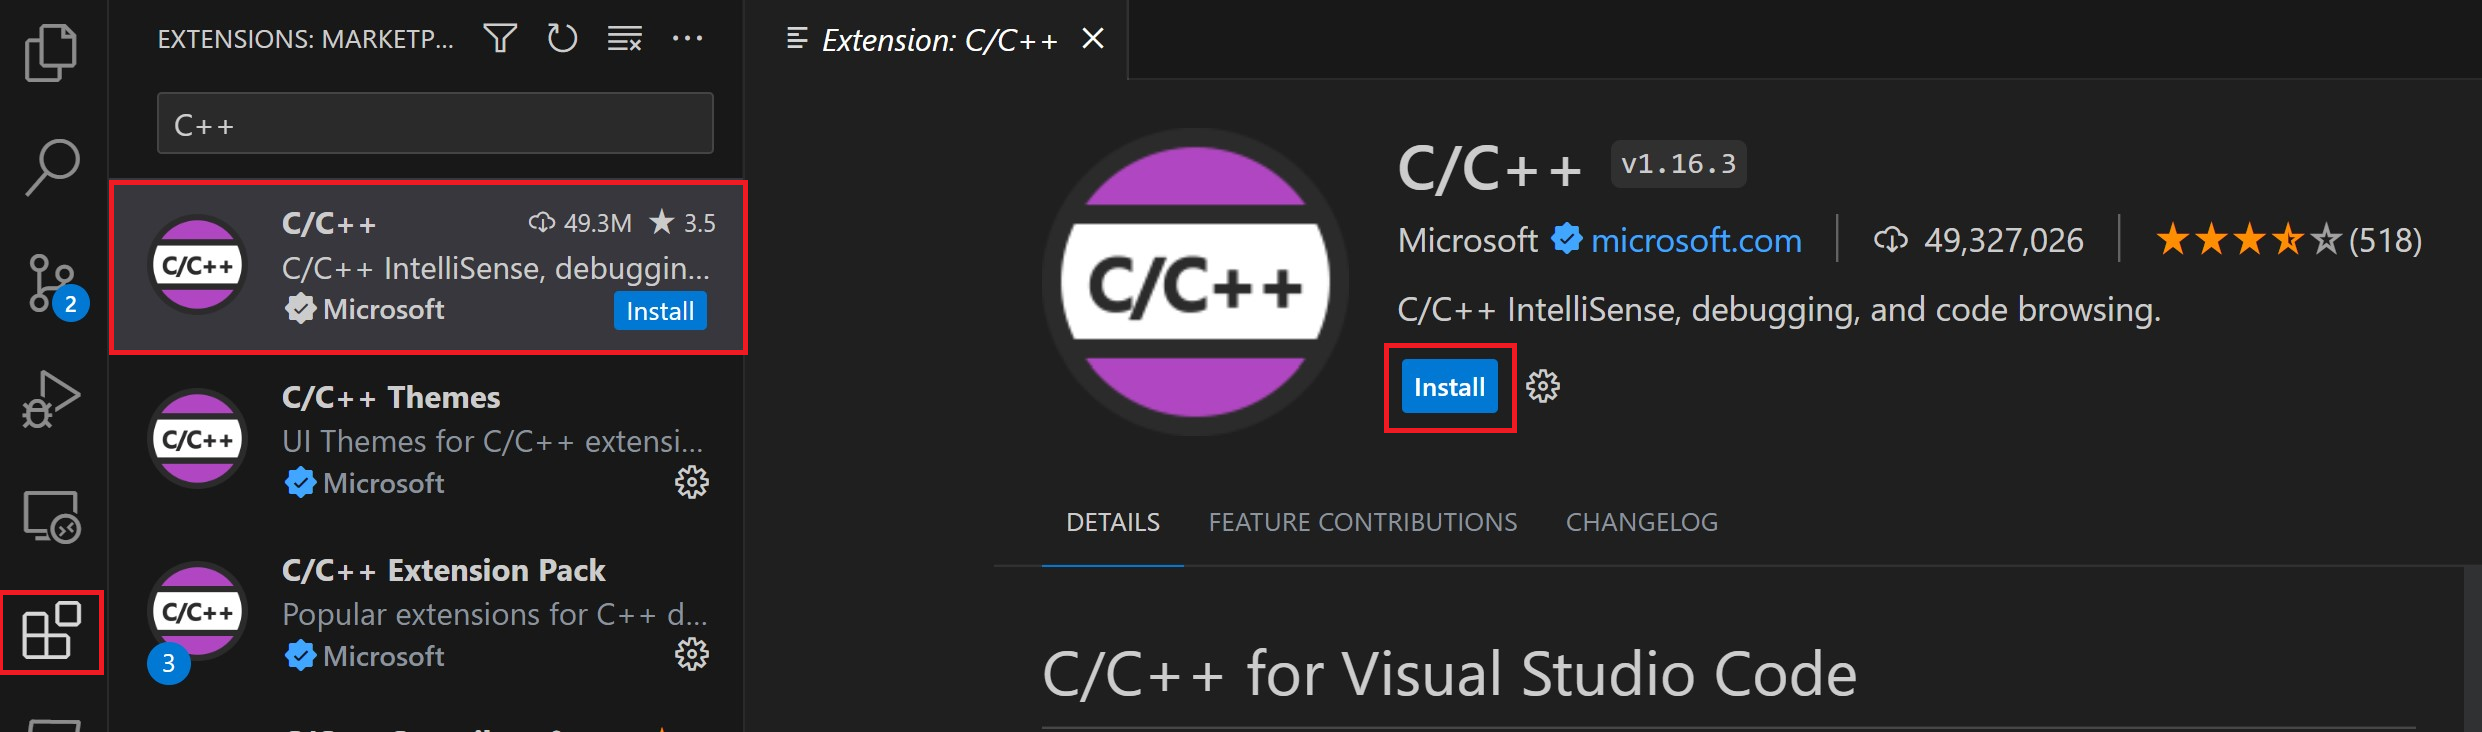
Install the C/C++ extension for VS Code. You can install the C/C++ extension by searching for ‘c++’ in the Extensions view (⇧⌘X (Windows, Linux Ctrl+Shift+X)).

-
Install the Microsoft Visual C++ (MSVC) compiler toolset.
If you have a recent version of Visual Studio, open the Visual Studio Installer from the Windows Start menu and verify that the C++ workload is checked. If it’s not installed, then check the box and select the Modify button in the installer.
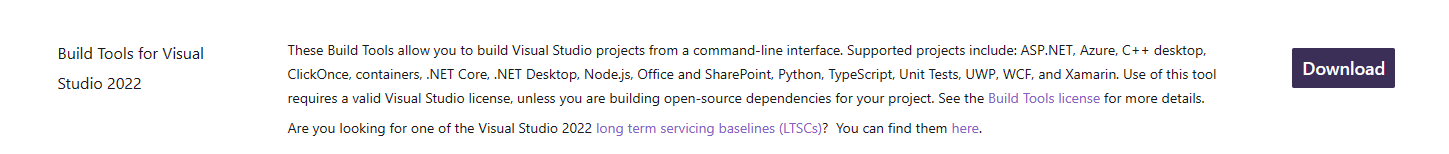
You can also install the Desktop development with C++ workload without a full Visual Studio IDE installation. From the Visual Studio Downloads page, scroll down until you see Tools for Visual Studio under the All Downloads section and select the download for Build Tools for Visual Studio 2022.
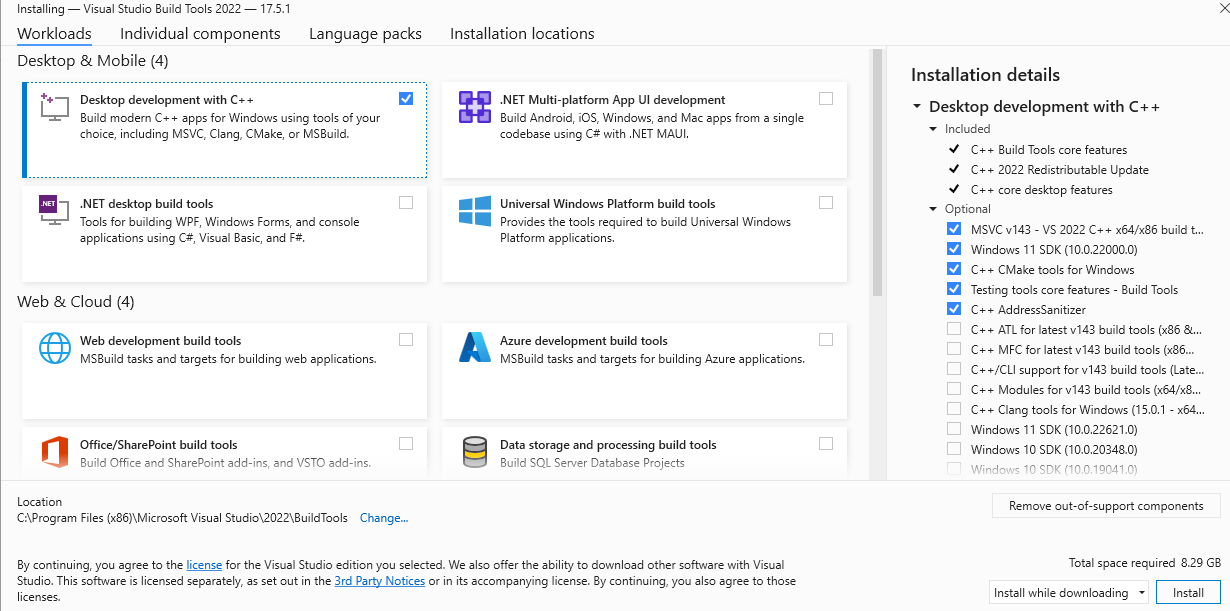
This will launch the Visual Studio Installer, which will bring up a dialog showing the available Visual Studio Build Tools workloads. Check the Desktop development with C++ workload and select Install.
Note: You can use the C++ toolset from Visual Studio Build Tools along with Visual Studio Code to compile, build, and verify any C++ codebase as long as you also have a valid Visual Studio license (either Community, Pro, or Enterprise) that you are actively using to develop that C++ codebase.
Check your Microsoft Visual C++ installation
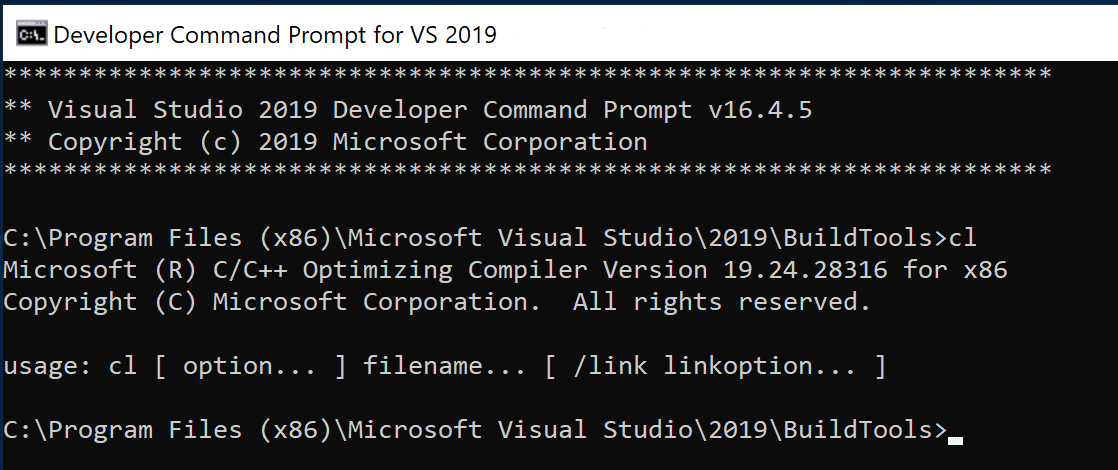
To use MSVC from a command line or VS Code, you must run from a Developer Command Prompt for Visual Studio. An ordinary shell such as PowerShell, Bash, or the Windows command prompt does not have the necessary path environment variables set.
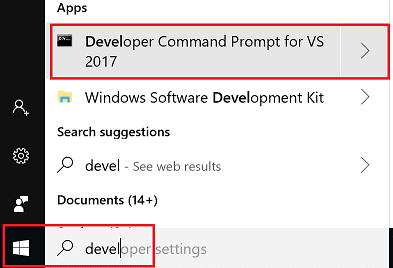
To open the Developer Command Prompt for VS, start typing ‘developer’ in the Windows Start menu, and you should see it appear in the list of suggestions. The exact name depends on which version of Visual Studio or the Visual Studio Build Tools you have installed. Select the item to open the prompt.
You can test that you have the C++ compiler, cl.exe, installed correctly by typing ‘cl’ and you should see a copyright message with the version and basic usage description.
If the Developer Command Prompt is using the BuildTools location as the starting directory (you wouldn’t want to put projects there), navigate to your user folder (C:\users\{your username}\) before you start creating new projects.
Note: If for some reason you can’t run VS Code from a Developer Command Prompt, you can find a workaround for building C++ projects with VS Code in Run VS Code outside a Developer Command Prompt.
Create Hello World
From the Developer Command Prompt, create an empty folder called «projects» where you can store all your VS Code projects, then create a subfolder called «helloworld», navigate into it, and open VS Code (code) in that folder (.) by entering the following commands:
mkdir projects
cd projects
mkdir helloworld
cd helloworld
code .
The «code .» command opens VS Code in the current working folder, which becomes your «workspace». As you go through the tutorial, you will see three files created in a .vscode folder in the workspace:
tasks.json(build instructions)launch.json(debugger settings)c_cpp_properties.json(compiler path and IntelliSense settings)
Add a source code file
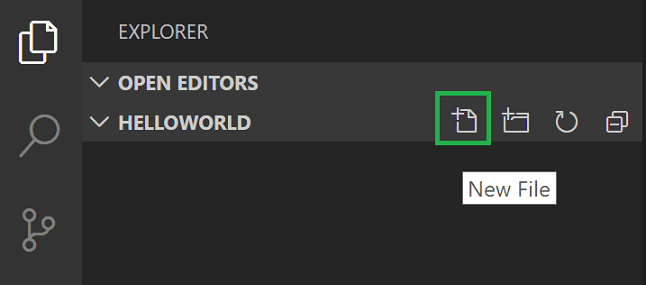
In the File Explorer title bar, select the New File button and name the file helloworld.cpp.
Add hello world source code
Now paste in this source code:
#include <iostream>
#include <vector>
#include <string>

using namespace std;

int main()
{
    vector<string> msg {"Hello", "C++", "World", "from", "VS Code", "and the C++ extension!"};

    for (const string& word : msg)
    {
        cout << word << " ";
    }
    cout << endl;
}
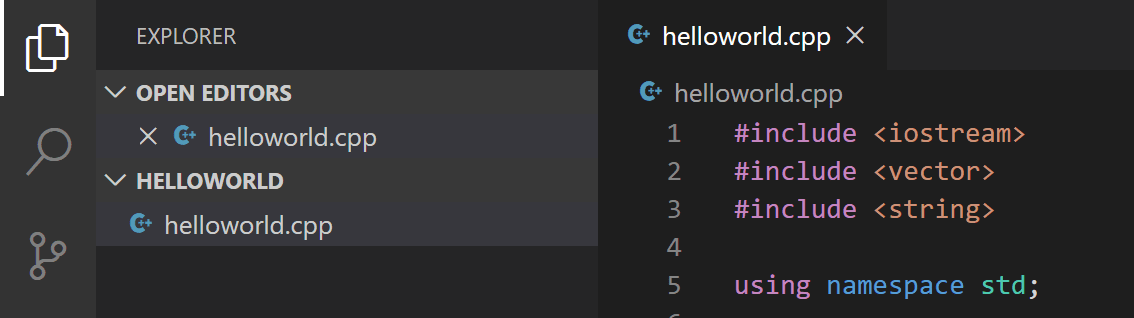
Now press ⌘S (Windows, Linux Ctrl+S) to save the file. Notice how the file you just added appears in the File Explorer view (⇧⌘E (Windows, Linux Ctrl+Shift+E)) in the side bar of VS Code:
You can also enable Auto Save to automatically save your file changes, by checking Auto Save in the main File menu.
The Activity Bar on the far left lets you open different views such as Search, Source Control, and Run. You’ll look at the Run view later in this tutorial. You can find out more about the other views in the VS Code User Interface documentation.
Note: When you save or open a C++ file, you may see a notification from the C/C++ extension about the availability of an Insiders version, which lets you test new features and fixes. You can ignore this notification by selecting the
X(Clear Notification).
Explore IntelliSense
In your new helloworld.cpp file, hover over vector or string to see type information. After the declaration of the msg variable, start typing msg. as you would when calling a member function. You should immediately see a completion list that shows all the member functions, and a window that shows the type information for the msg object:
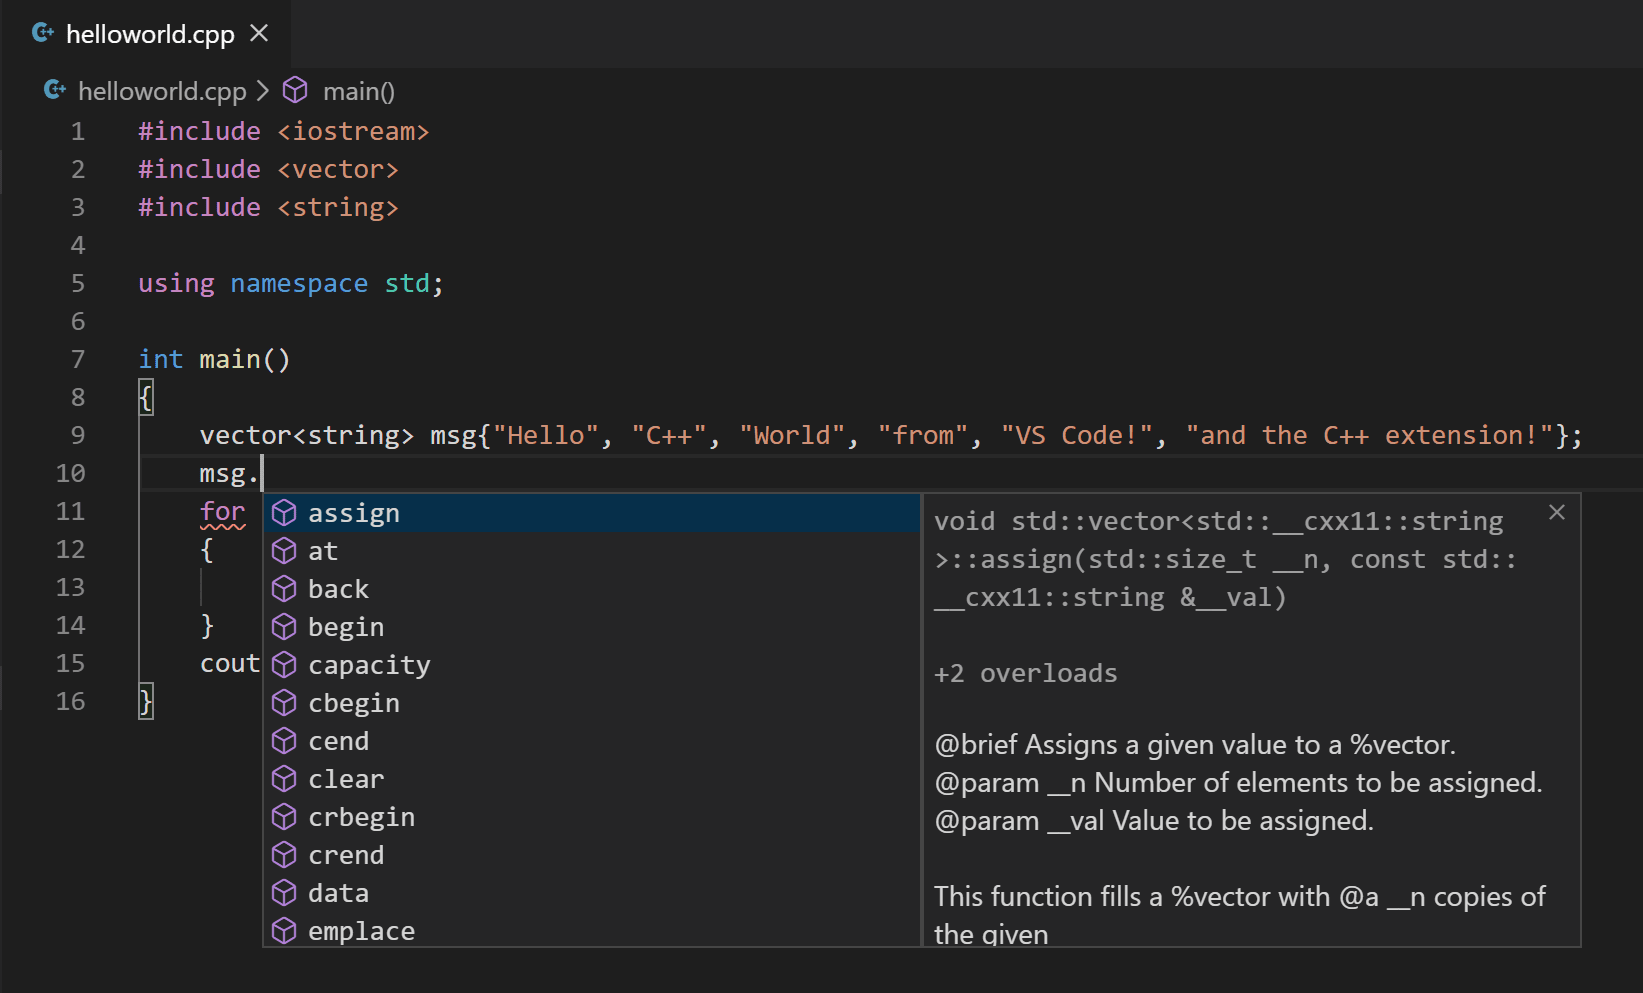
You can press the Tab key to insert the selected member; then, when you add the opening parenthesis, you will see information about any arguments that the function requires.
Run helloworld.cpp
Remember, the C++ extension uses the C++ compiler you have installed on your machine to build your program. Make sure you have a C++ compiler installed before attempting to run and debug helloworld.cpp in VS Code.
-
Open
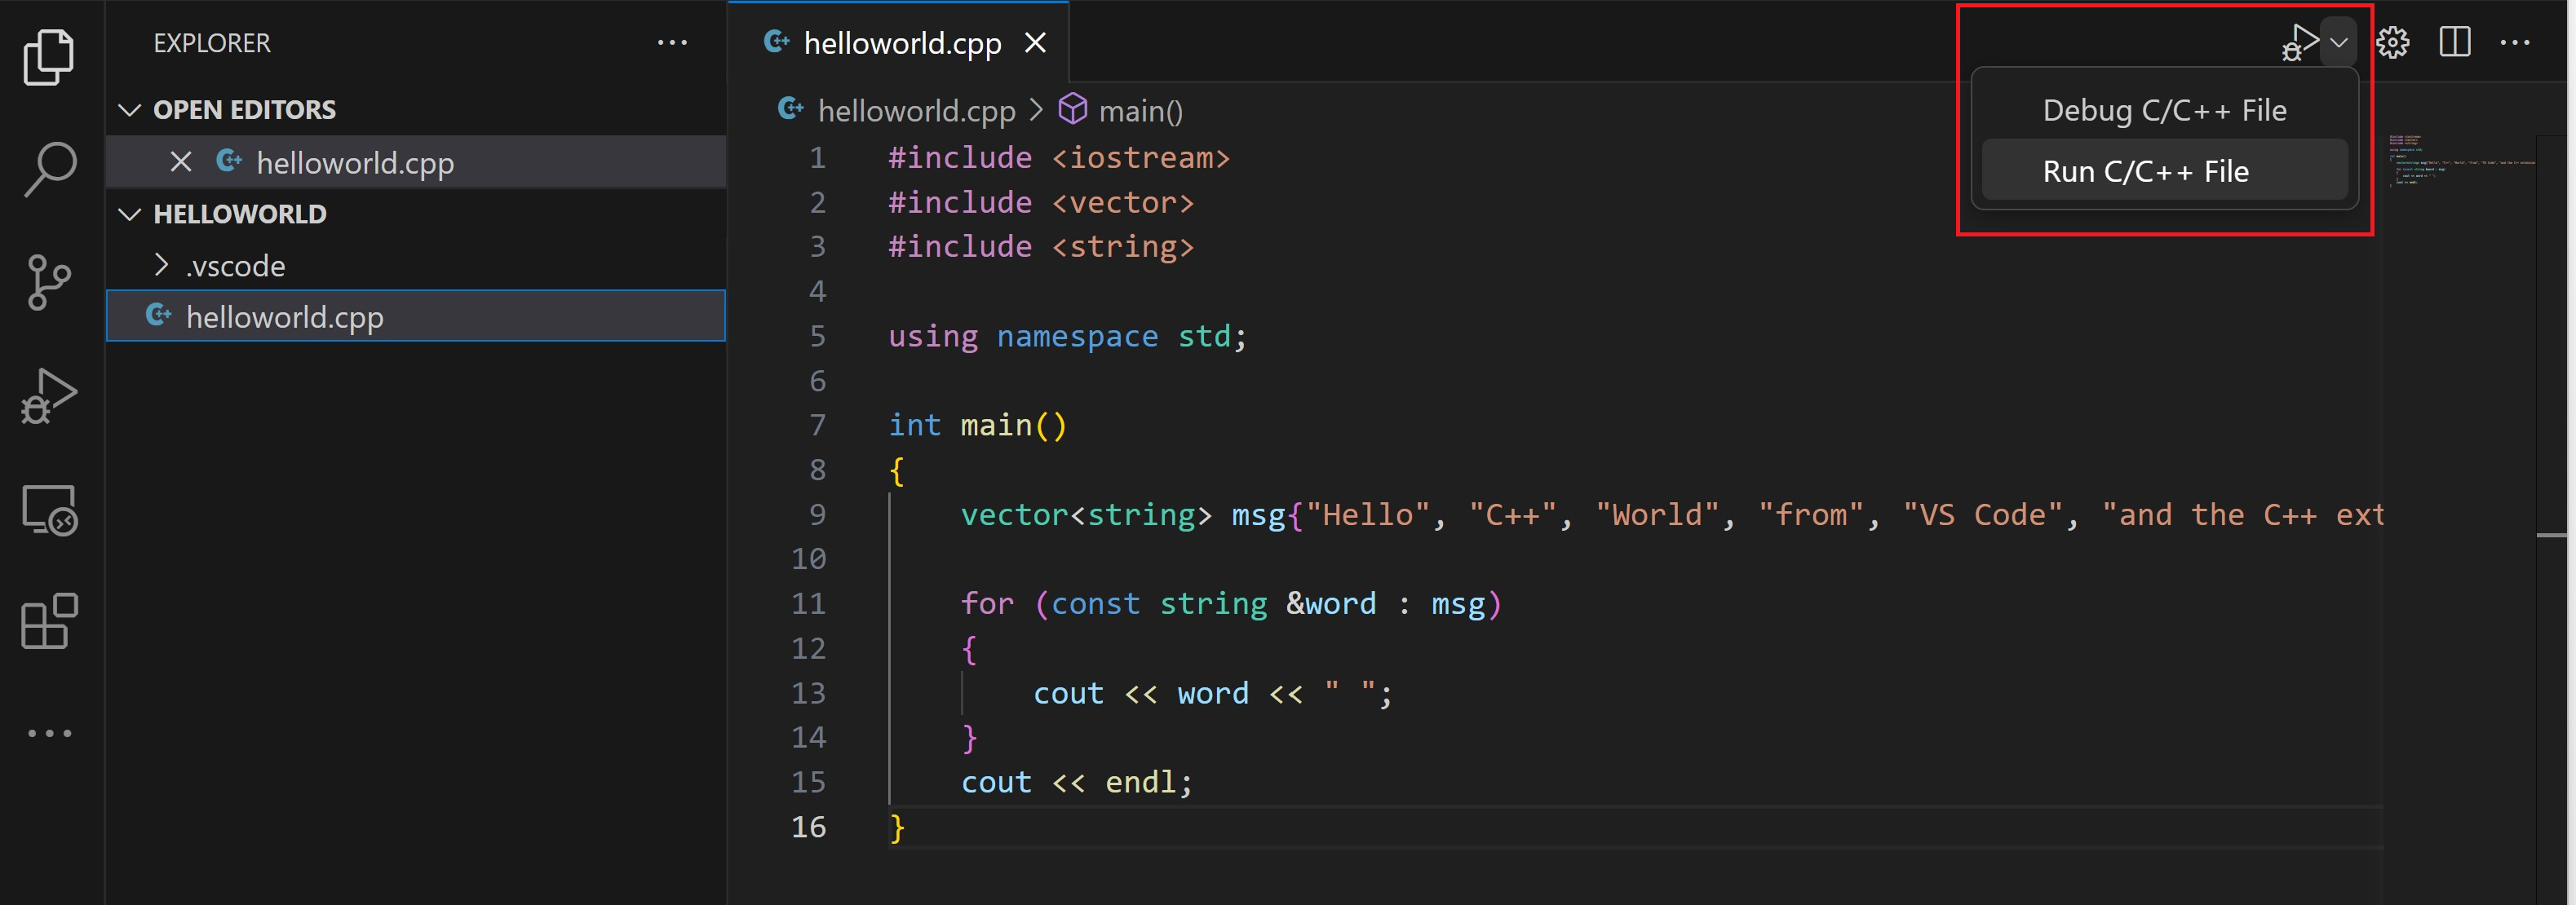
helloworld.cppso that it is the active file. -
Press the play button in the top right corner of the editor.
-
Choose C/C++: cl.exe build and debug active file from the list of detected compilers on your system.
You’ll only be asked to choose a compiler the first time you run helloworld.cpp. This compiler will be set as the «default» compiler in tasks.json file.
-
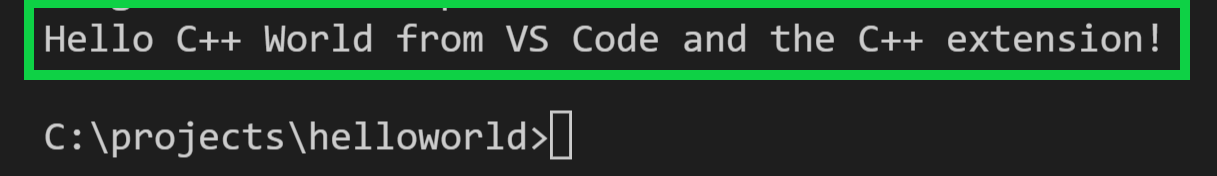
After the build succeeds, your program’s output will appear in the integrated Terminal.
If you get an error trying to build and debug with cl.exe, make sure you have started VS Code from the Developer Command Prompt for Visual Studio using the code . shortcut.

The first time you run your program, the C++ extension creates tasks.json, which you’ll find in your project’s .vscode folder. tasks.json stores build configurations.
Your new tasks.json file should look similar to the JSON below:
{
  "version": "2.0.0",
  "tasks": [
    {
      "type": "shell",
      "label": "C/C++: cl.exe build active file",
      "command": "cl.exe",
      "args": [
        "/Zi",
        "/EHsc",
        "/Fe:",
        "${fileDirname}\\${fileBasenameNoExtension}.exe",
        "${file}"
      ],
      "problemMatcher": ["$msCompile"],
      "group": {
        "kind": "build",
        "isDefault": true
      },
      "detail": "Task generated by Debugger."
    }
  ]
}
Note: You can learn more about
tasks.jsonvariables in the variables reference.
The command setting specifies the program to run; in this case that is «cl.exe». The args array specifies the command-line arguments that will be passed to cl.exe. These arguments must be specified in the order expected by the compiler.
This task tells the C++ compiler to take the active file (${file}), compile it, and create an executable file (/Fe: switch) in the current directory (${fileDirname}) with the same name as the active file but with the .exe extension (${fileBasenameNoExtension}.exe), resulting in helloworld.exe for our example.
The label value is what you will see in the tasks list; you can name this whatever you like.
The detail value is what you will as the description of the task in the tasks list. It’s highly recommended to rename this value to differentiate it from similar tasks.
The problemMatcher value selects the output parser to use for finding errors and warnings in the compiler output. For cl.exe, you’ll get the best results if you use the $msCompile problem matcher.
From now on, the play button will read from tasks.json to figure out how to build and run your program. You can define multiple build tasks in tasks.json, and whichever task is marked as the default will be used by the play button. In case you need to change the default compiler, you can run Tasks: Configure default build task. Alternatively you can modify the tasks.json file and remove the default by replacing this segment:
    "group": {
        "kind": "build",
        "isDefault": true
    },
with this:
"group": "build",
Modifying tasks.json
You can modify your tasks.json to build multiple C++ files by using an argument like "${workspaceFolder}/*.cpp" instead of ${file}.This will build all .cpp files in your current folder. You can also modify the output filename by replacing "${fileDirname}\\${fileBasenameNoExtension}.exe" with a hard-coded filename (for example "${workspaceFolder}\\myProgram.exe").
Debug helloworld.cpp
To debug your code,
- Go back to
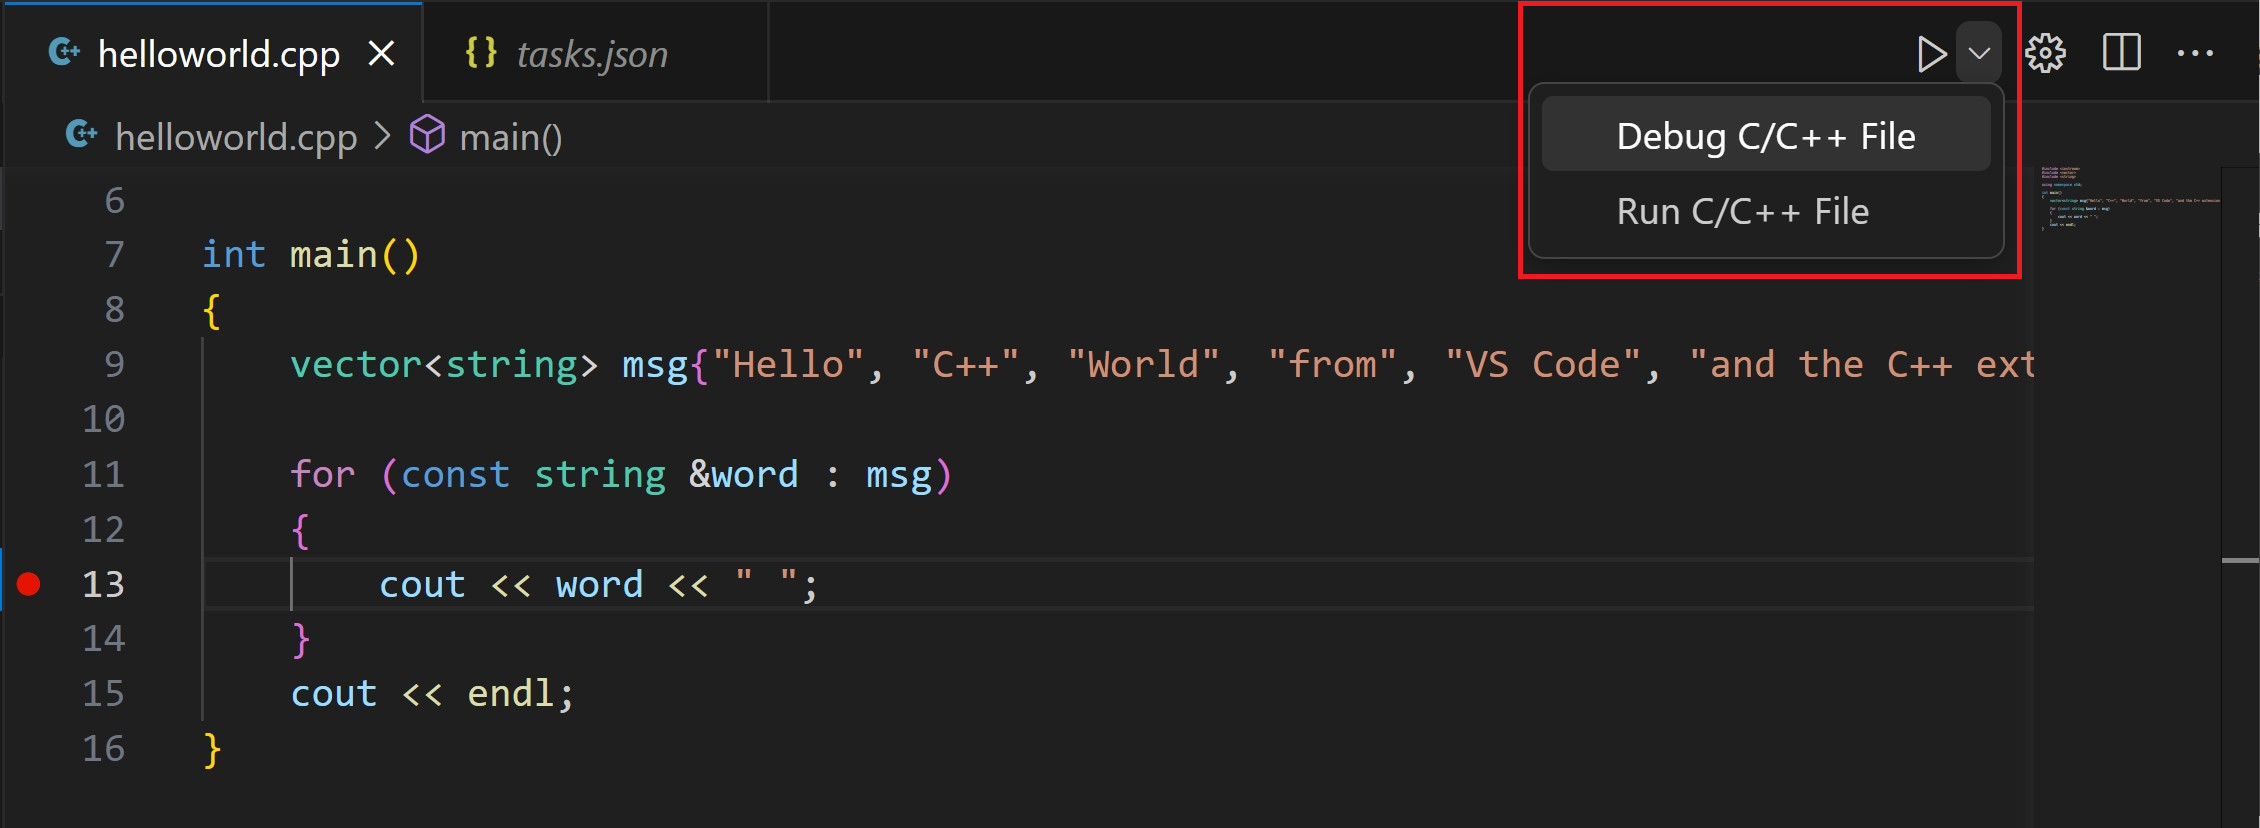
helloworld.cppso that it is the active file. - Set a breakpoint by clicking on the editor margin or using F9 on the current line.
- From the drop-down next to the play button, select Debug C/C++ File.
- Choose C/C++: cl.exe build and debug active file from the list of detected compilers on your system (you’ll only be asked to choose a compiler the first time you run or debug
helloworld.cpp).
The play button has two modes: Run C/C++ File and Debug C/C++ File. It will default to the last-used mode. If you see the debug icon in the play button, you can select the play button to debug, instead of selecting the drop-down menu item.
If you get an error trying to build and debug with cl.exe, make sure you have started VS Code from the Developer Command Prompt for Visual Studio using the code . shortcut.
Explore the debugger
Before you start stepping through the code, let’s take a moment to notice several changes in the user interface:
-
The Integrated Terminal appears at the bottom of the source code editor. In the Debug Output tab, you see output that indicates the debugger is up and running.
-
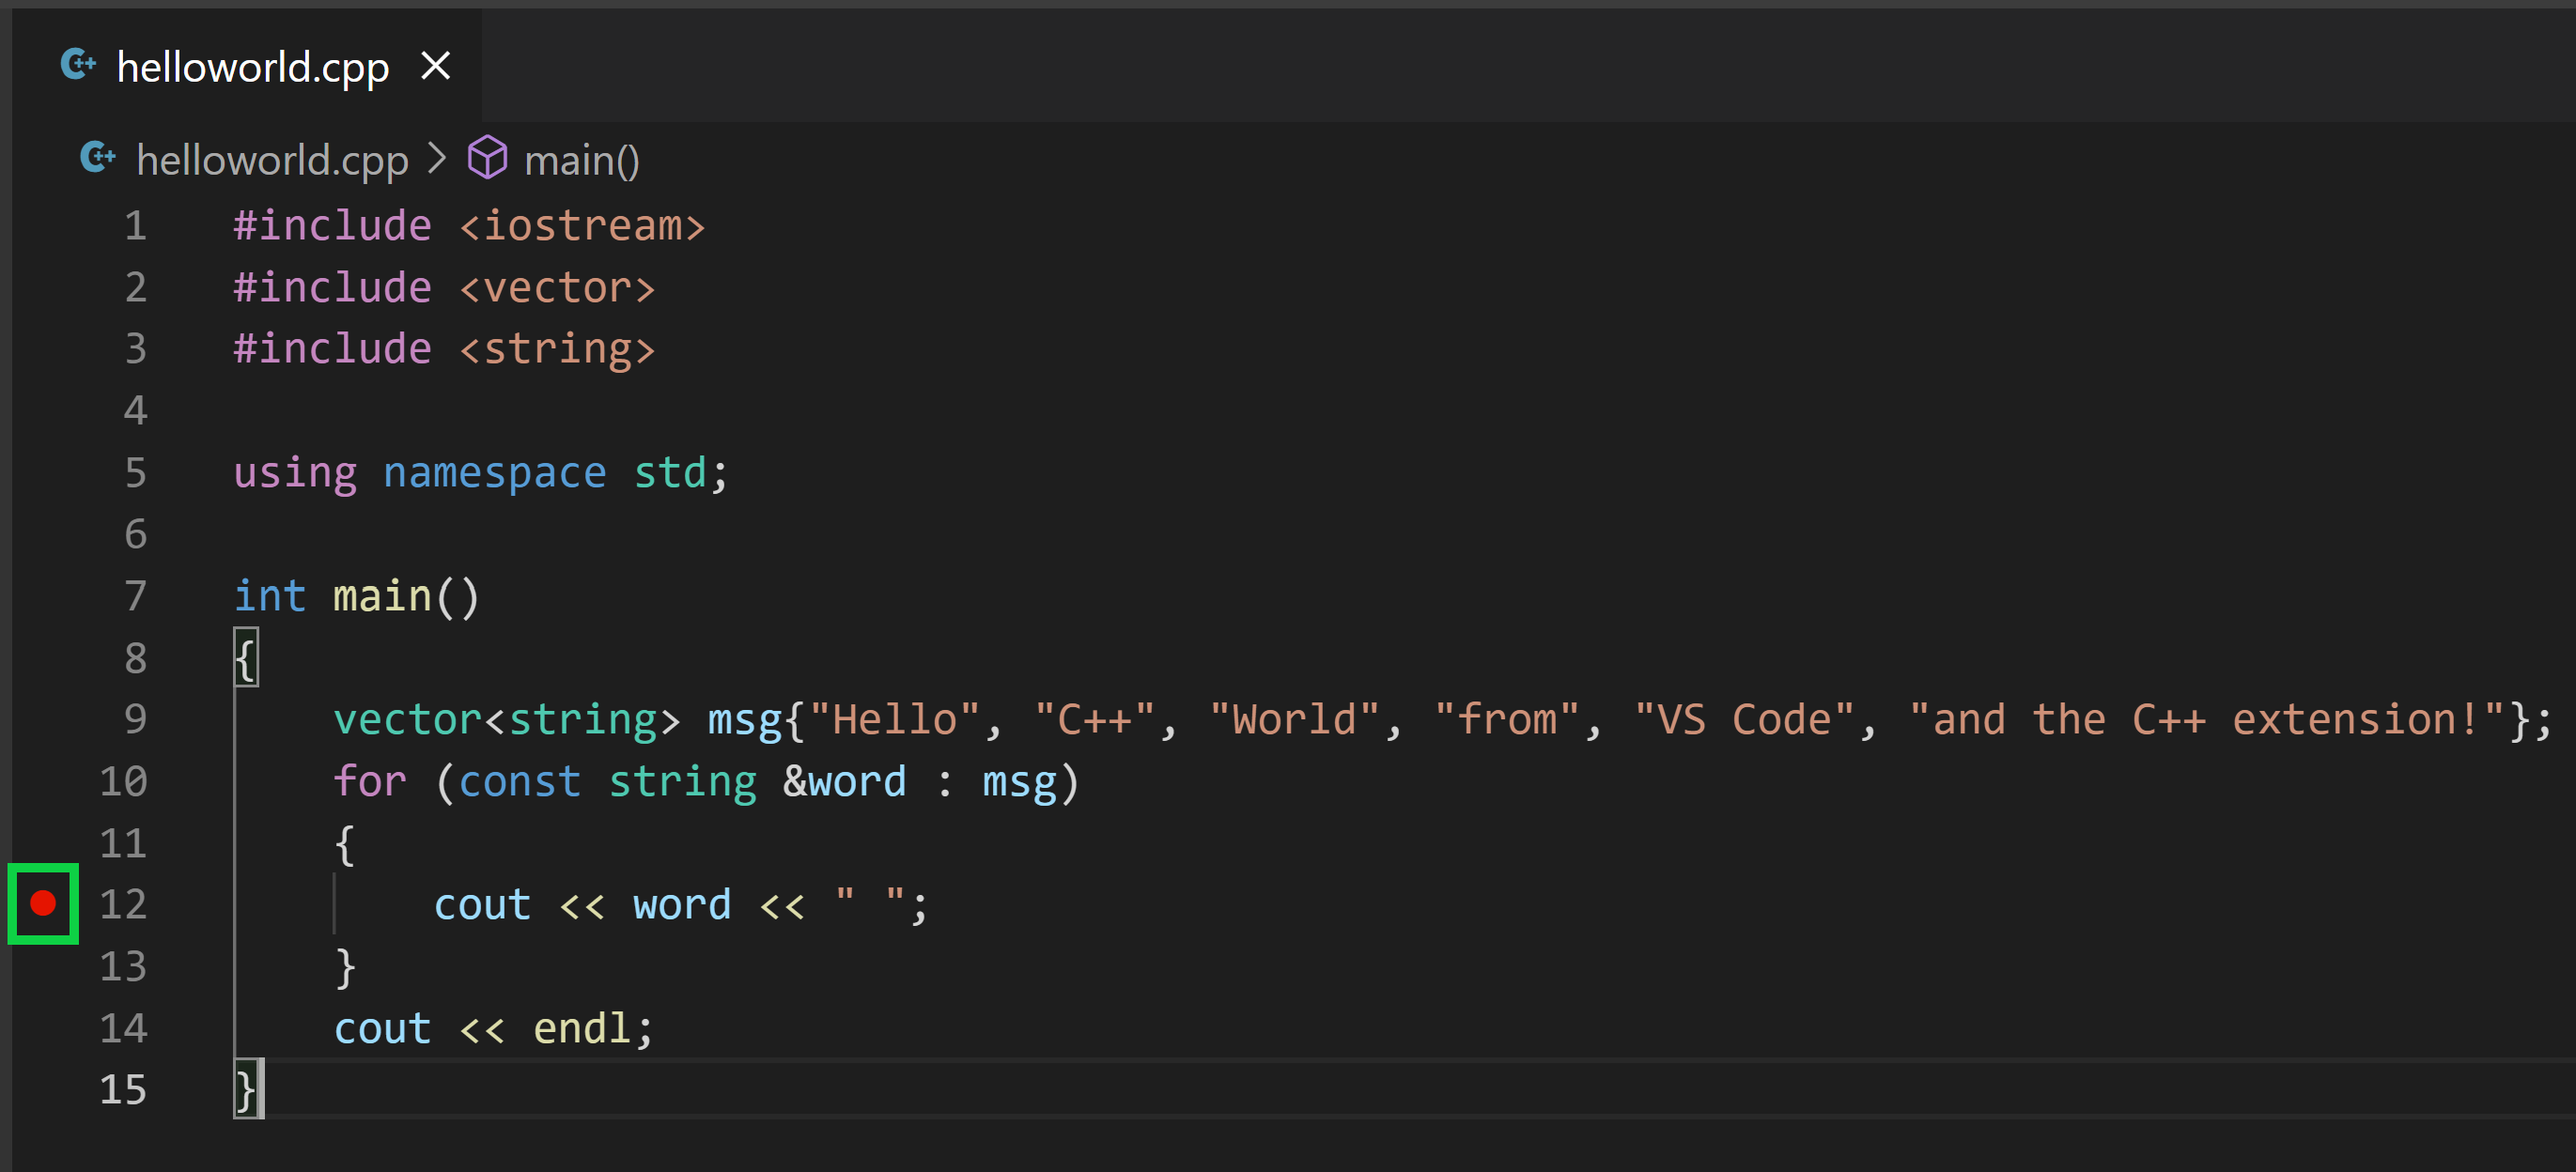
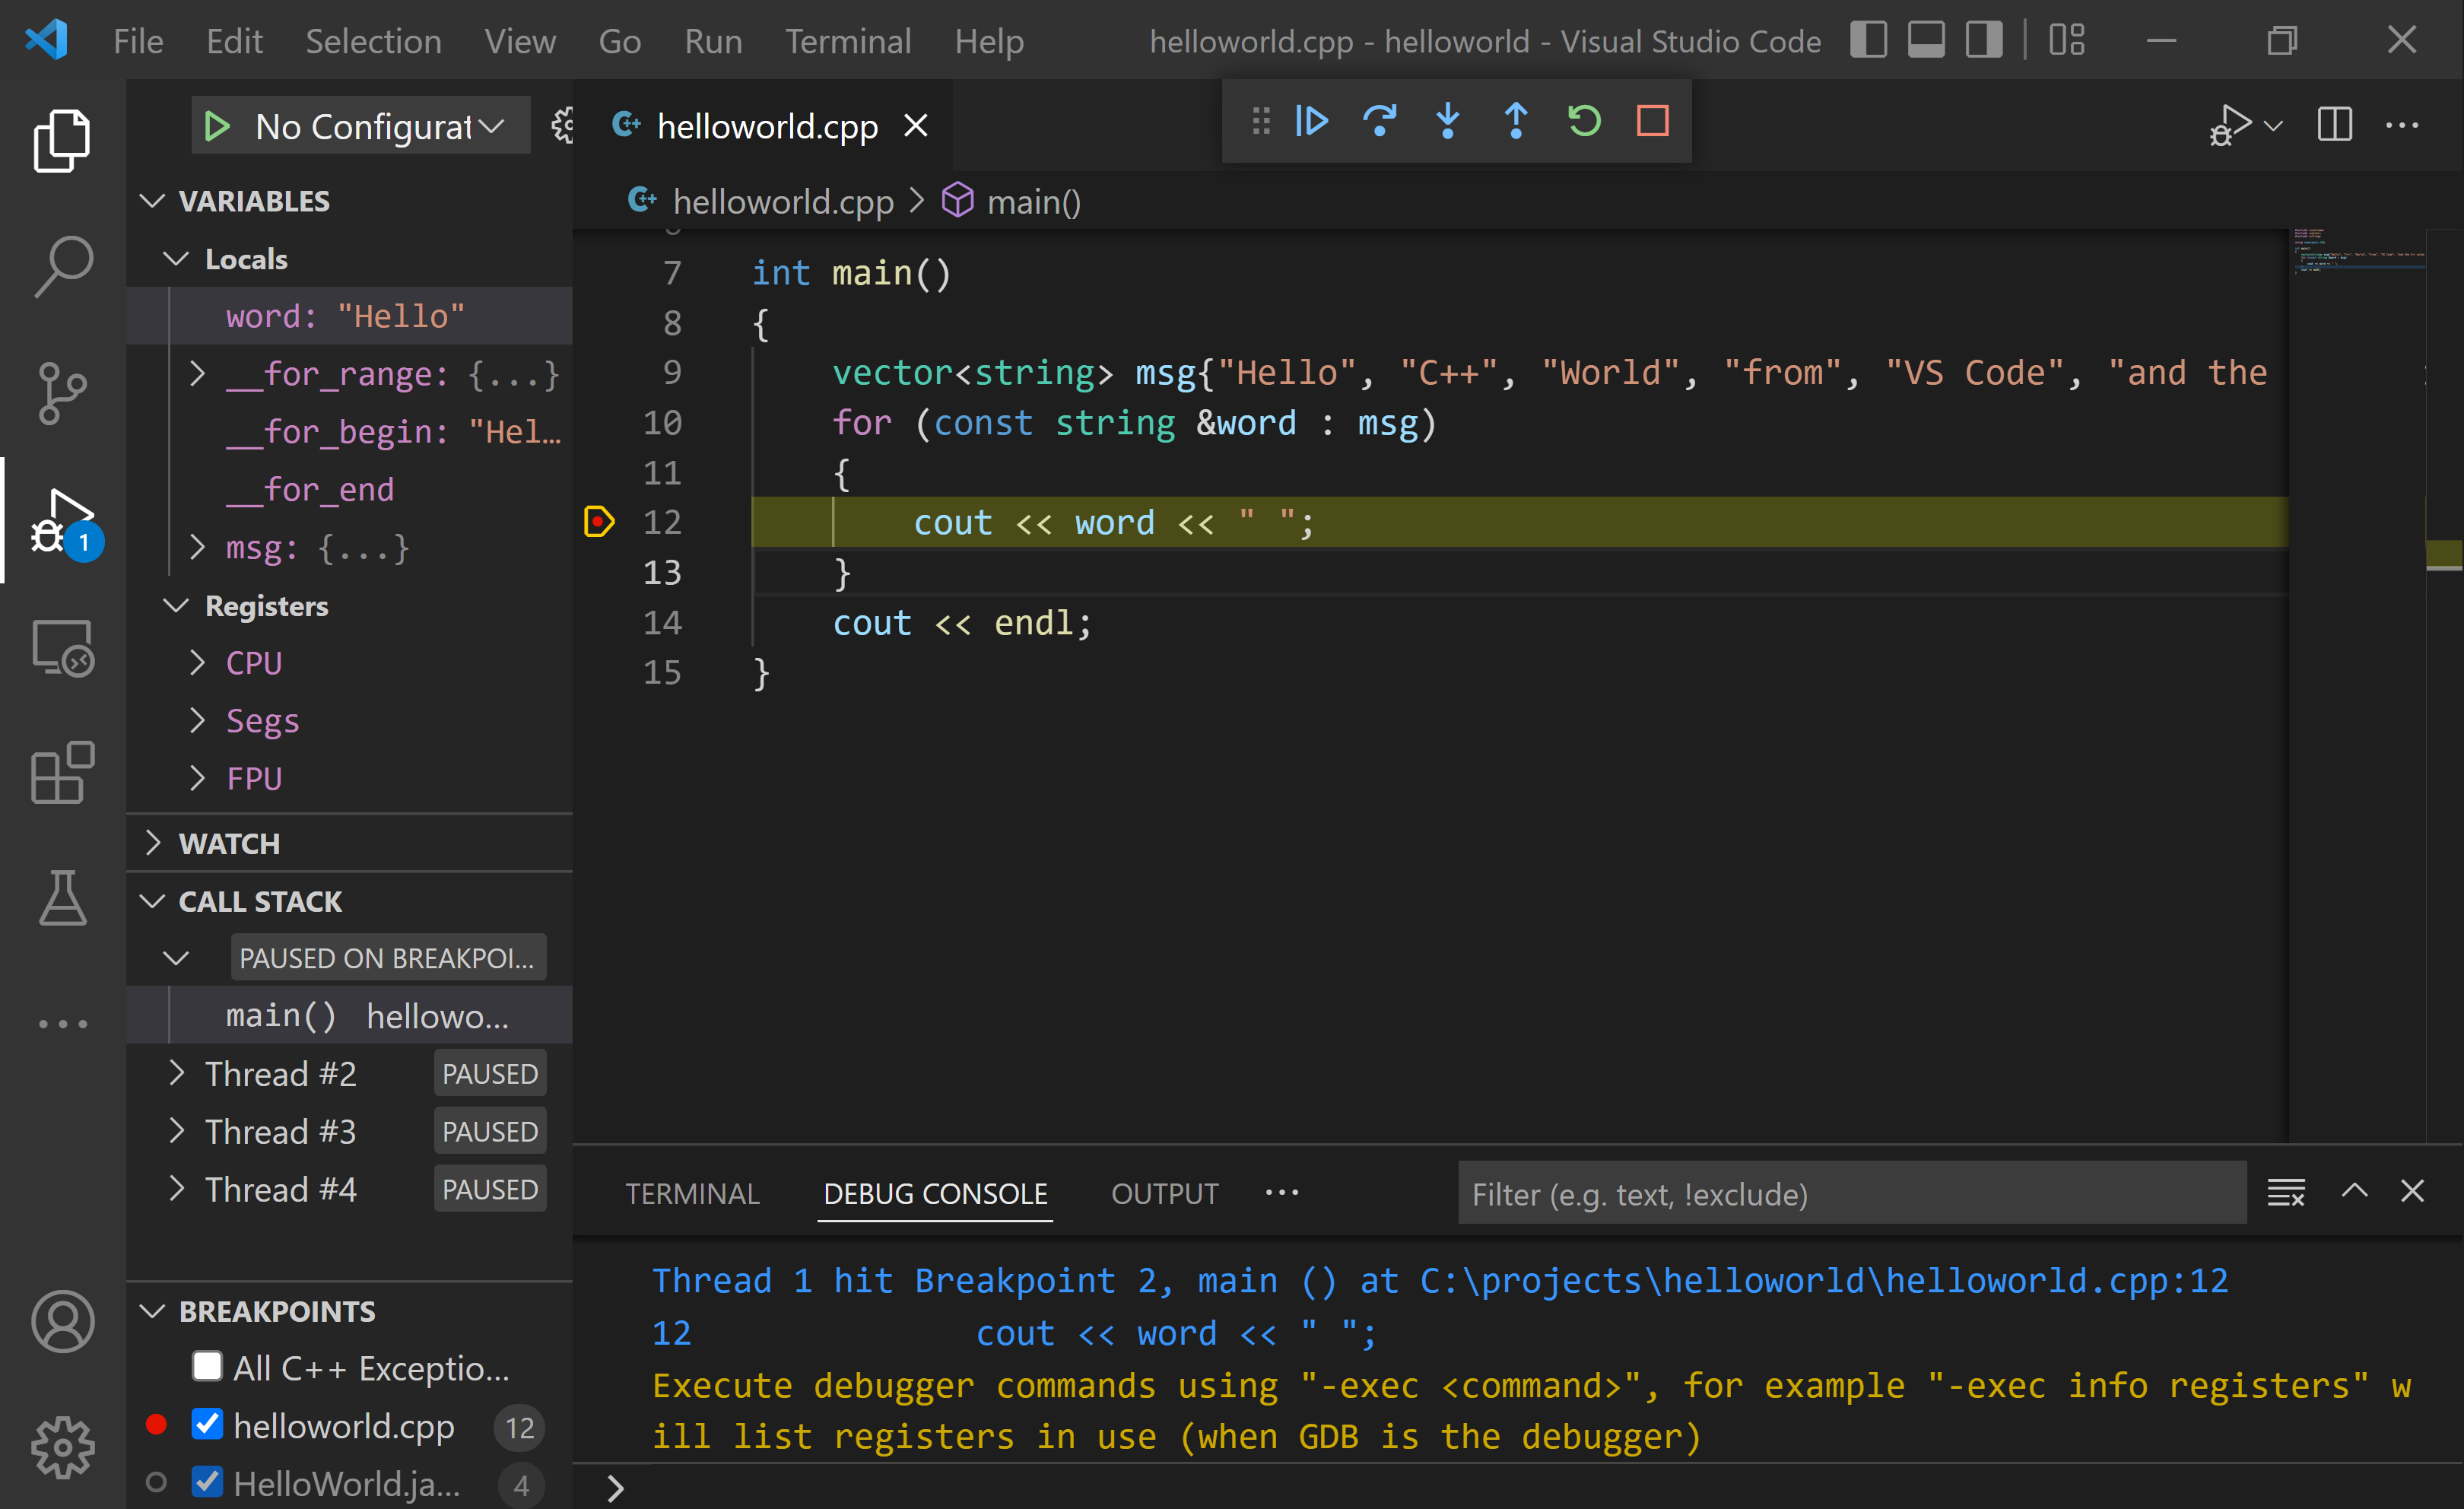
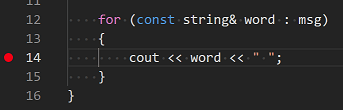
The editor highlights the line where you set a breakpoint before starting the debugger:
-
The Run and Debug view on the left shows debugging information. You’ll see an example later in the tutorial.
-
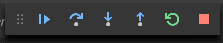
At the top of the code editor, a debugging control panel appears. You can move this around the screen by grabbing the dots on the left side.
Step through the code
Now you’re ready to start stepping through the code.
-
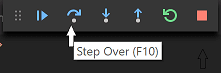
Click or press the Step over icon in the debugging control panel.
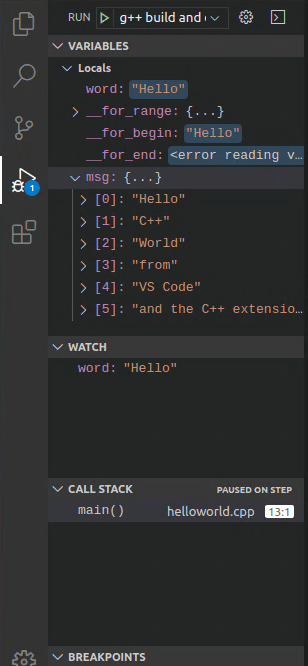
This will advance program execution to the first line of the for loop, and skip over all the internal function calls within the
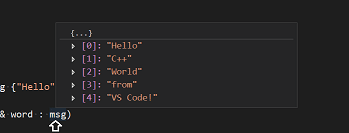
vectorandstringclasses that are invoked when themsgvariable is created and initialized. Notice the change in the Variables window on the left.In this case, the errors are expected because, although the variable names for the loop are now visible to the debugger, the statement has not executed yet, so there is nothing to read at this point. The contents of
msgare visible, however, because that statement has completed. -
Press Step over again to advance to the next statement in this program (skipping over all the internal code that is executed to initialize the loop). Now, the Variables window shows information about the loop variables.
-
Press Step over again to execute the
coutstatement. (Note that as of the March 2019 release, the C++ extension does not print any output to the Debug Console until the loop exits.) -
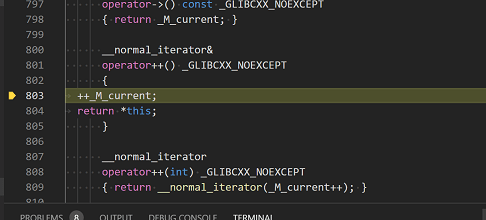
If you like, you can keep pressing Step over until all the words in the vector have been printed to the console. But if you are curious, try pressing the Step Into button to step through source code in the C++ standard library!
To return to your own code, one way is to keep pressing Step over. Another way is to set a breakpoint in your code by switching to the
helloworld.cpptab in the code editor, putting the insertion point somewhere on thecoutstatement inside the loop, and pressing F9. A red dot appears in the gutter on the left to indicate that a breakpoint has been set on this line.Then press F5 to start execution from the current line in the standard library header. Execution will break on
cout. If you like, you can press F9 again to toggle off the breakpoint.
Set a watch
Sometimes you might want to keep track of the value of a variable as your program executes. You can do this by setting a watch on the variable.
-
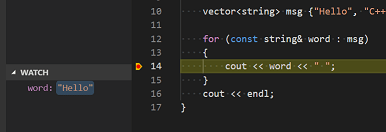
Place the insertion point inside the loop. In the Watch window, select the plus sign and in the text box, type
word, which is the name of the loop variable. Now view the Watch window as you step through the loop. -
Add another watch by adding this statement before the loop:
int i = 0;. Then, inside the loop, add this statement:++i;. Now add a watch forias you did in the previous step. -
To quickly view the value of any variable while execution is paused on a breakpoint, you can hover over it with the mouse pointer.
Customize debugging with launch.json
When you debug with the play button or F5, the C++ extension creates a dynamic debug configuration on the fly.
There are cases where you’d want to customize your debug configuration, such as specifying arguments to pass to the program at runtime. You can define custom debug configurations in a launch.json file.
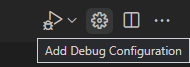
To create launch.json, choose Add Debug Configuration from the play button drop-down menu.
You’ll then see a dropdown for various predefined debugging configurations. Choose C/C++: cl.exe build and debug active file.

VS Code creates a launch.json file, which looks something like this:
{
  "version": "0.2.0",
  "configurations": [
    {
      "name": "C/C++: cl.exe build and debug active file",
      "type": "cppvsdbg",
      "request": "launch",
      "program": "${fileDirname}\\${fileBasenameNoExtension}.exe",
      "args": [],
      "stopAtEntry": false,
      "cwd": "${workspaceFolder}",
      "environment": [],
      "externalConsole": false,
      "preLaunchTask": "C/C++: cl.exe build active file"
    }
  ]
}
In the JSON above, program specifies the program you want to debug. Here it is set to the active file folder (${fileDirname}) and active filename with the .exe extension (${fileBasenameNoExtension}.exe), which if helloworld.cpp is the active file will be helloworld.exe. The args property is an array of arguments to pass to the program at runtime.
By default, the C++ extension won’t add any breakpoints to your source code and the stopAtEntry value is set to false.
Change the stopAtEntry value to true to cause the debugger to stop on the main method when you start debugging.
From now on, the play button and F5 will read from your
launch.jsonfile when launching your program for debugging.
C/C++ configurations
If you want more control over the C/C++ extension, you can create a c_cpp_properties.json file, which will allow you to change settings such as the path to the compiler, include paths, C++ standard (default is C++17), and more.
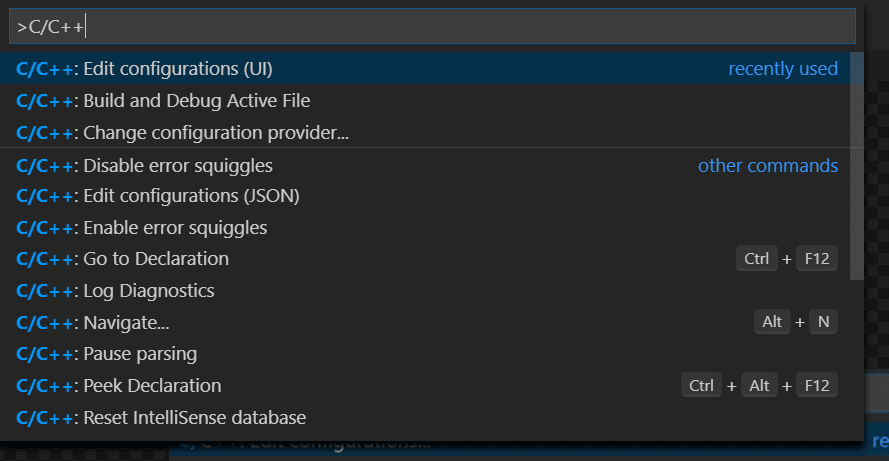
You can view the C/C++ configuration UI by running the command C/C++: Edit Configurations (UI) from the Command Palette (⇧⌘P (Windows, Linux Ctrl+Shift+P)).
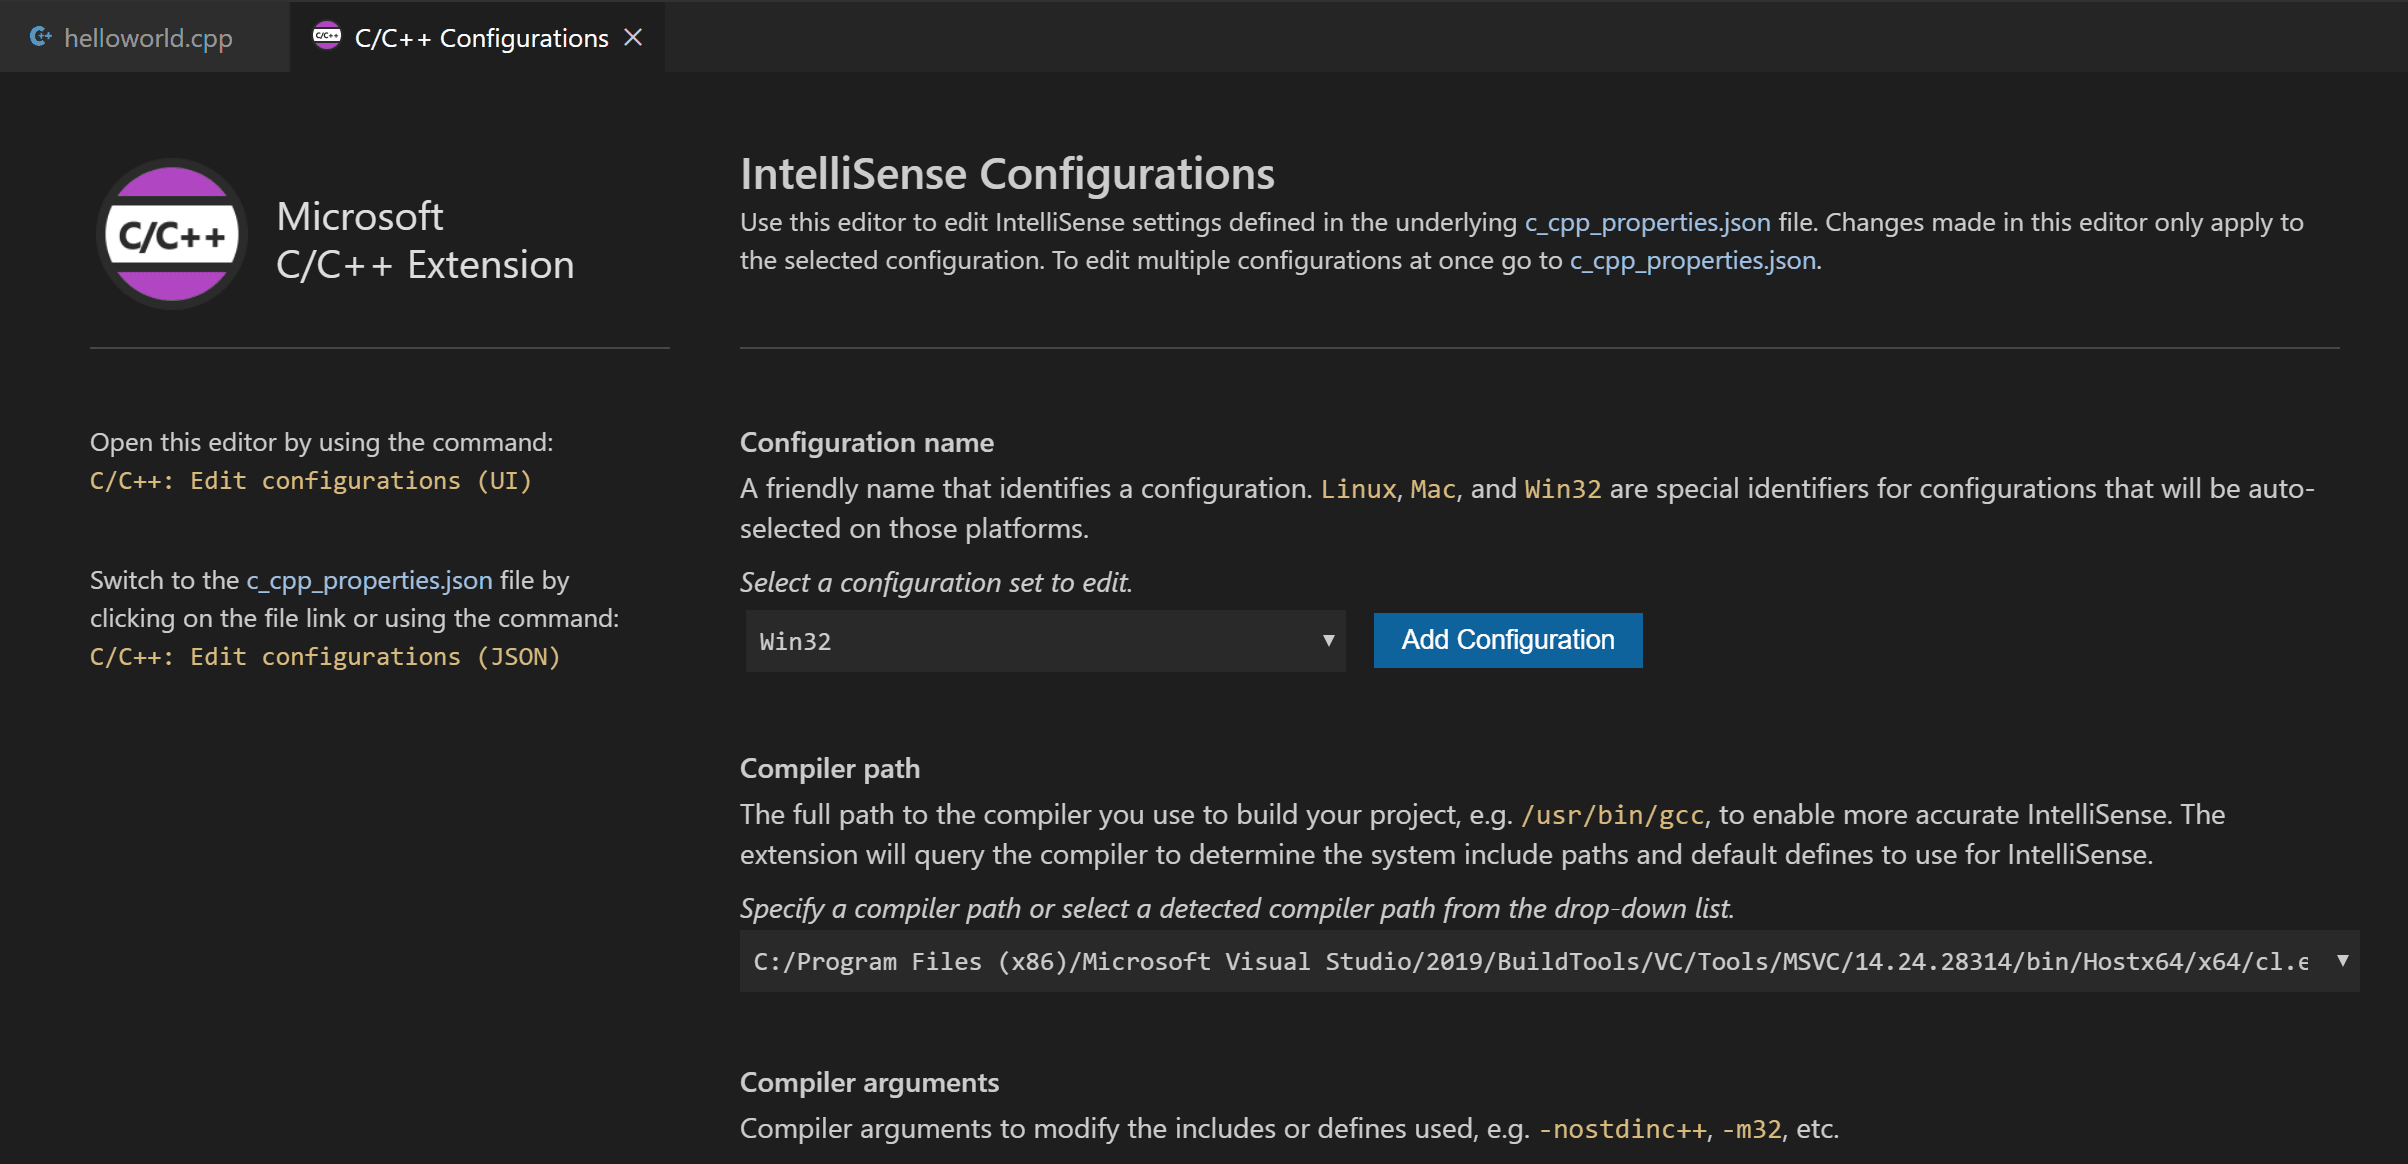
This opens the C/C++ Configurations page. When you make changes here, VS Code writes them to a file called c_cpp_properties.json in the .vscode folder.
Visual Studio Code places these settings in .vscode\c_cpp_properties.json. If you open that file directly, it should look something like this:
{
  "configurations": [
    {
      "name": "Win32",
      "includePath": ["${workspaceFolder}/**"],
      "defines": ["_DEBUG", "UNICODE", "_UNICODE"],
      "windowsSdkVersion": "10.0.18362.0",
      "compilerPath": "C:/Program Files (x86)/Microsoft Visual Studio/2019/BuildTools/VC/Tools/MSVC/14.24.28314/bin/Hostx64/x64/cl.exe",
      "cStandard": "c11",
      "cppStandard": "c++17",
      "intelliSenseMode": "msvc-x64"
    }
  ],
  "version": 4
}
You only need to add to the Include path array setting if your program includes header files that are not in your workspace or in the standard library path.
Compiler path
The compilerPath setting is an important setting in your configuration. The extension uses it to infer the path to the C++ standard library header files. When the extension knows where to find those files, it can provide useful features like smart completions and Go to Definition navigation.
The C/C++ extension attempts to populate compilerPath with the default compiler location based on what it finds on your system. The extension looks in several common compiler locations.
The compilerPath search order is:
- First check for the Microsoft Visual C++ compilerOpe
- Then look for g++ on Windows Subsystem for Linux (WSL)
- Then g++ for Mingw-w64.
If you have g++ or WSL installed, you might need to change compilerPath to match the preferred compiler for your project. For Microsoft C++, the path should look something like this, depending on which specific version you have installed: «C:/Program Files (x86)/Microsoft Visual Studio/2017/BuildTools/VC/Tools/MSVC/14.16.27023/bin/Hostx64/x64/cl.exe».
Reusing your C++ configuration
VS Code is now configured to use the Microsoft C++ compiler. The configuration applies to the current workspace. To reuse the configuration, just copy the JSON files to a .vscode folder in a new project folder (workspace) and change the names of the source file(s) and executable as needed.
Run VS Code outside the Developer Command Prompt
In certain circumstances, it isn’t possible to run VS Code from Developer Command Prompt for Visual Studio (for example, in Remote Development through SSH scenarios). In that case, you can automate initialization of Developer Command Prompt for Visual Studio during the build using the following tasks.json configuration:
{
  "version": "2.0.0",
  "windows": {
    "options": {
      "shell": {
        "executable": "cmd.exe",
        "args": [
          "/C",
          // The path to VsDevCmd.bat depends on the version of Visual Studio you have installed.
          "\"C:/Program Files (x86)/Microsoft Visual Studio/2019/Community/Common7/Tools/VsDevCmd.bat\"",
          "&&"
        ]
      }
    }
  },
  "tasks": [
    {
      "type": "shell",
      "label": "cl.exe build active file",
      "command": "cl.exe",
      "args": [
        "/Zi",
        "/EHsc",
        "/Fe:",
        "${fileDirname}\\${fileBasenameNoExtension}.exe",
        "${file}"
      ],
      "problemMatcher": ["$msCompile"],
      "group": {
        "kind": "build",
        "isDefault": true
      }
    }
  ]
}
Note: The path to
VsDevCmd.batmight be different depending on the Visual Studio version or installation path. You can find the path toVsDevCmd.batby opening a Command Prompt and runningdir "\VsDevCmd*" /s.
Troubleshooting
The term ‘cl.exe’ is not recognized
If you see the error «The term ‘cl.exe’ is not recognized as the name of a cmdlet, function, script file, or operable program.», this usually means you are running VS Code outside of a Developer Command Prompt for Visual Studio and VS Code doesn’t know the path to the cl.exe compiler.
VS Code must either be started from the Developer Command Prompt for Visual Studio, or the task must be configured to run outside a Developer Command Prompt.
You can always check that you are running VS Code in the context of the Developer Command Prompt by opening a new Terminal (⌃⇧` (Windows, Linux Ctrl+Shift+`)) and typing ‘cl’ to verify cl.exe is available to VS Code.
fatal error C1034: assert.h: no include path set
In this case, cl.exe is available to VS Code through the PATH environment variable, but VS Code still needs to either be started from the Developer Command Prompt for Visual Studio, or be configured to run outside the Developer Command Prompt. Otherwise, cl.exe does not have access to important environment variables such as INCLUDE.
Next steps
- Explore the VS Code User Guide.
- Review the Overview of the C++ extension.
- Create a new workspace, copy your
.vscodeJSON files to it, adjust the necessary settings for the new workspace path, program name, and so on, and start coding!
3/7/2023

Visual Studio Code — популярный редактор кода, бесплатный и с открытым исходным кодом. Но я уверен: каждый из нас, кто пытался настроить Visual Studio Code для разработки приложений на C++, Java или Python, прошел через стадию: “О Боже! Почему нельзя как-нибудь попроще?” Я сам пробовал настроить VS Code пару раз и в итоге закончил тем, что использовал CodeBlocks. 🙁
Прочитав много документации, посмотрев ряд роликов на YouTube и потратив несколько дней на саму настройку VS Code, я пишу эту статью, чтобы все это не пришлось проделывать уже вам!
Сегодня я покажу, как настроить среду разработки для спортивного программирования на C++, Java и Python в VS Code с нуля. Мы также посмотрим, какие расширения больше всего пригодятся, чтобы начать работу с VS Code. В конечном счете, ваша среда разработки будет выглядеть примерно так:
Давайте приступим!
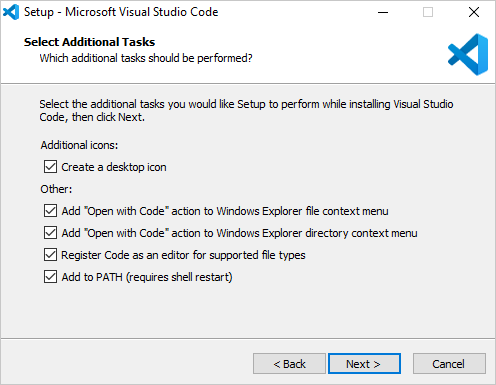
Скачайте последнюю версию Visual Studio Code с официального сайта. Рекомендуется загрузить системный установщик (System Installer), но если у вас нет прав администратора, то пользовательский установщик (User Installer) тоже подойдет. Выполните все обычные шаги по установке и обязательно проставьте все следующие чекбоксы:
Если у вас уже установлен VS Code, но вы все равно хотите начать с чистого листа, следуйте этим инструкциям, чтобы полностью удалить VS Code.
2. Настраиваем расширения
Ниже приведен список расширений, которые нам понадобятся для правильной настройки VS Code. Откройте VS Code и перейдите на панель расширений (Ctrl + Shift + X), которая находится на левой панели инструментов, и начните загружать друг за другом следующие расширения:
- C / C++ от Microsoft — [Важно] Для корректной работы этого расширения нам понадобится установленный и добавленный в PATH компилятор MinGW. Если у вас его нет, следуйте этому руководству.
- C++ Intellisense от austin.
- Python от Microsoft — вам нужно будет настроить Python для работы этого расширения. Загрузите и установите последнюю версию отсюда.
- Java Extension Pack от Microsoft — [Важно] Перед установкой убедитесь, что в вашей системе настроены Java 8 JDK и JRE и указаны все необходимые переменные среды для Java. Если нет, посмотрите это видео о том, как настроить Java на вашем компьютере.
- Code Runner от Jun Han — мы будем использовать это расширение для запуска всех наших программ. Для этого необходимо выполнить некоторые шаги по настройке. Мы увидим эти шаги в следующих разделах.
Расширения, перечисленные ниже, необязательны для дальнейшей настройки, но я рекомендую вам обратить на них внимание, посмотреть, заинтересуют ли они вас, и если нет, то перейти к следующему разделу.
- (Необязательно)Material Theme от Mattia Astronio — это расширение содержит множество приятных глазу тем. Вы можете выбрать любую, какая понравится. Лично я предпочитаю Monokai, которая доступна в VS Code по умолчанию, без каких-либо расширений.
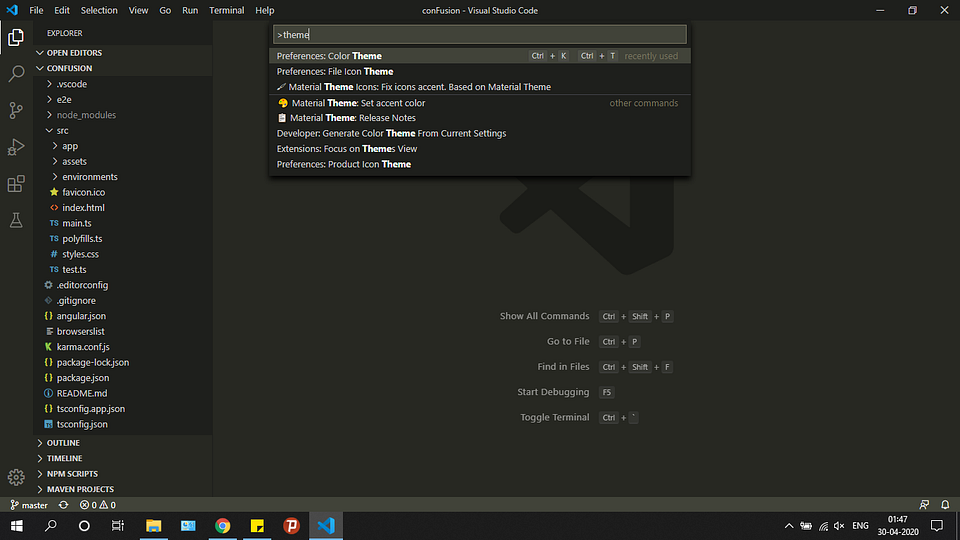
Чтобы выбрать тему, нажмите Ctrl + Shift + P. Откроется палитра команд. Осуществите поиск по слову “theme” и выберите опцию Color Theme. Чтобы настроить иконки, можете выбрать опцию File Icon Theme.
Расширения для тех, кто интересуется FrontEnd-фреймворками для веб-разработки, такими как Angular и React:
- (Необязательно) Angular Language Service от Angular.
- (Необязательно) Angular Snippets от John Papa.
- (Необязательно) ES7 React / Redux / GraphQL / React-Native snippets от dsznajder.
- (Необязательно) React Native Tools от Microsoft.
- (Необязательно) Live Server от Ritwick Dey.
3. Настраиваем внешний вид редактора
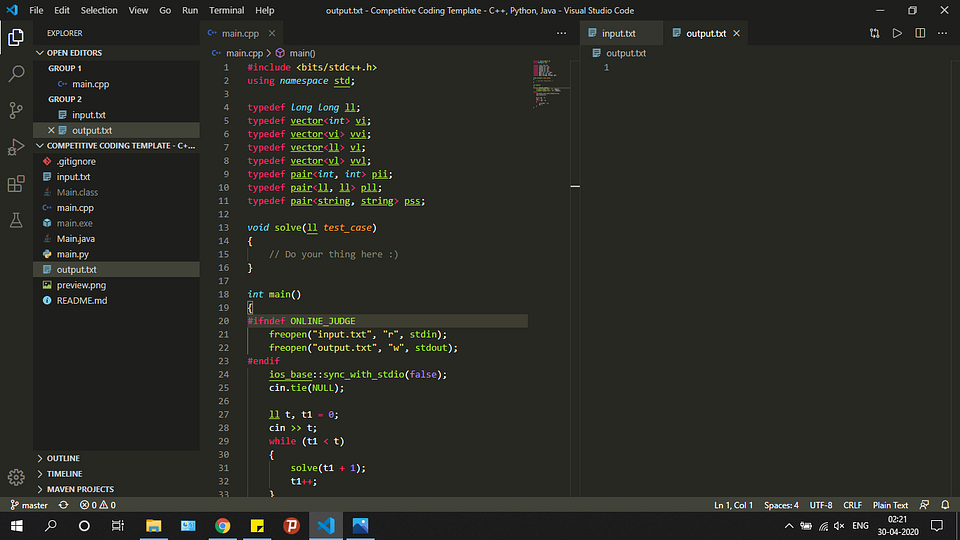
Итак, мы уже установили VS Code и несколько расширений. Теперь мы готовы настраивать среду разработки. Я создал шаблон для спортивного программирования в VS Code и загрузил его в свой профиль на Github.
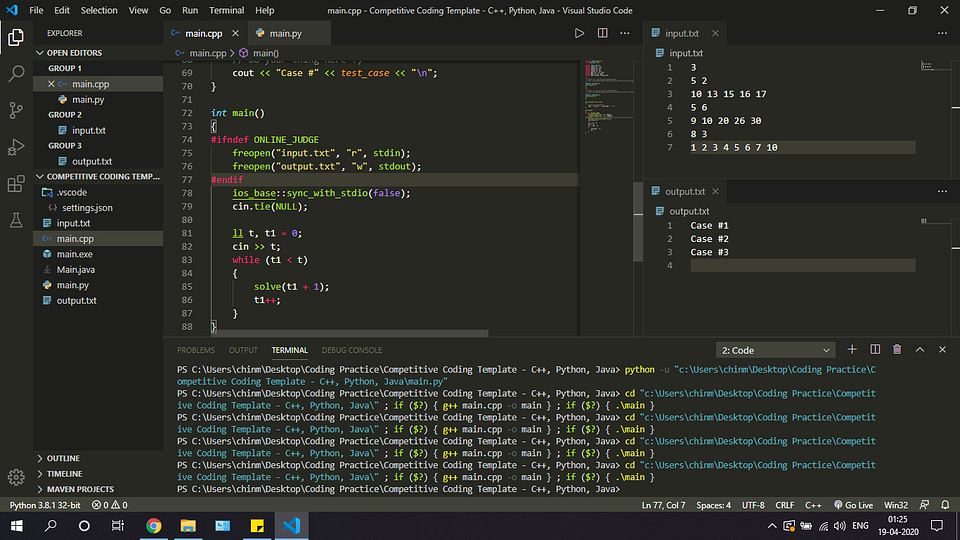
Перейдите по этой ссылке и загрузите шаблон себе на компьютер. Распакуйте его в любое место по вашему выбору. После этого откройте получившуюся папку в VS Code. Вы должны увидеть что-то вроде этого:
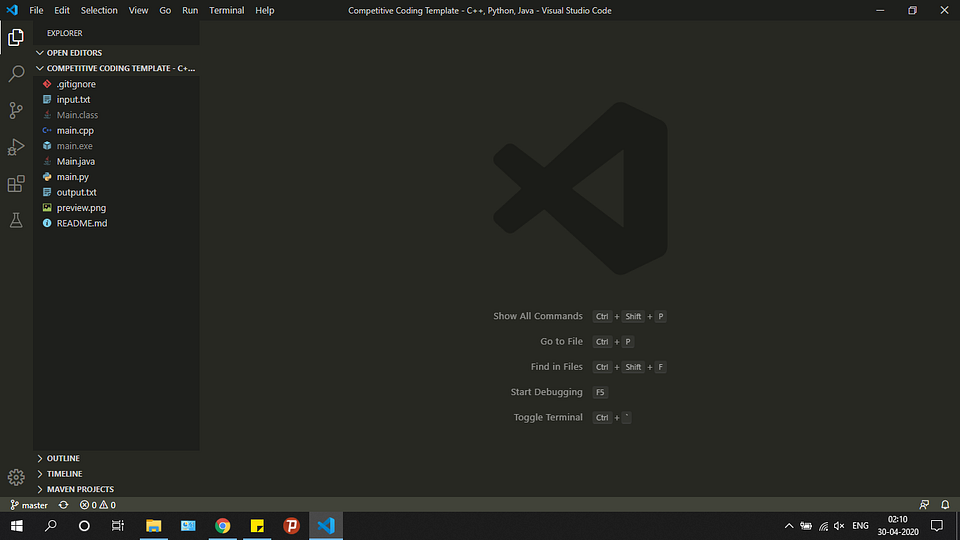
Пройдитесь по файлам main.cpp, Main.java и main.py и посмотрите на записанный в них образец кода. По сути, шаблонный код, предоставленный в образцах для каждого из этих трех языков, принимает входящие данные из файла input.txt и обеспечивает вывод в файл output.txt. Для каждой программистской задачи, которую вы хотите решить, просто создайте копию этого шаблона и напишите свой код в функции solve().
Теперь создадим ту разбивку экрана, которую вы могли видеть на самом первом изображении в этой статье. Эта разбивка позволяет сразу видеть как ввод, так и вывод вашего кода, что делает ее очень удобной в использовании.
- Откройте файлы в следующем порядке: main.cpp, input.txt, output.txt. Порядок, в каком были открыты файлы, можно видеть сверху на панели инструментов. Убедитесь, что порядок именно такой, как указано выше.
- Откройте input.txt. Выберите в меню View -> Editor Layout -> Split Right. Вы должны увидеть что-то подобное:
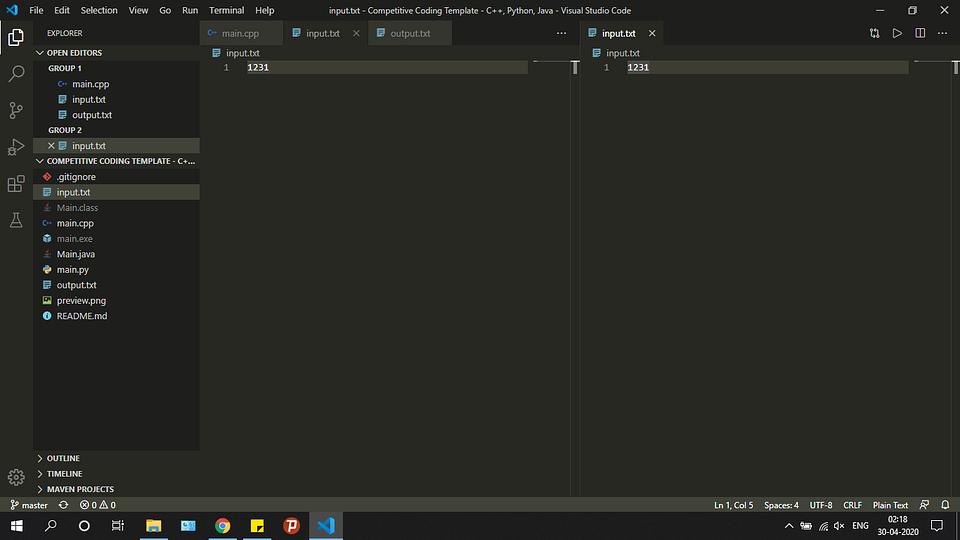
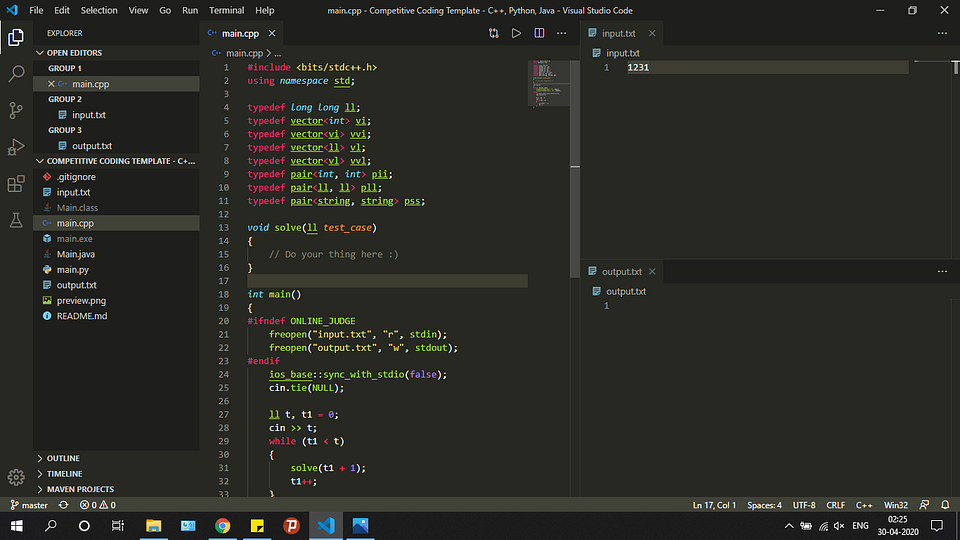
- У вас получится две группы. Перетащите output.txt из левой группы в правую. Закройте тот input.txt, что остался слева. Должно выйти примерно так:
- Далее откройте output.txt в правой группе. Выберите View -> Editor Layout -> Split Down. Уберите output.txt из верхней группы. После этого вы увидите:
Готово! Мы настроили внешний вид редактора. А теперь давайте запускать код.
4. Запускаем код!
Для запуска нашего кода мы будем использовать расширение Code Runner, потому что ручная настройка VS Code для каждого языка — весьма сложная задача и потребует много затрат времени и сил.
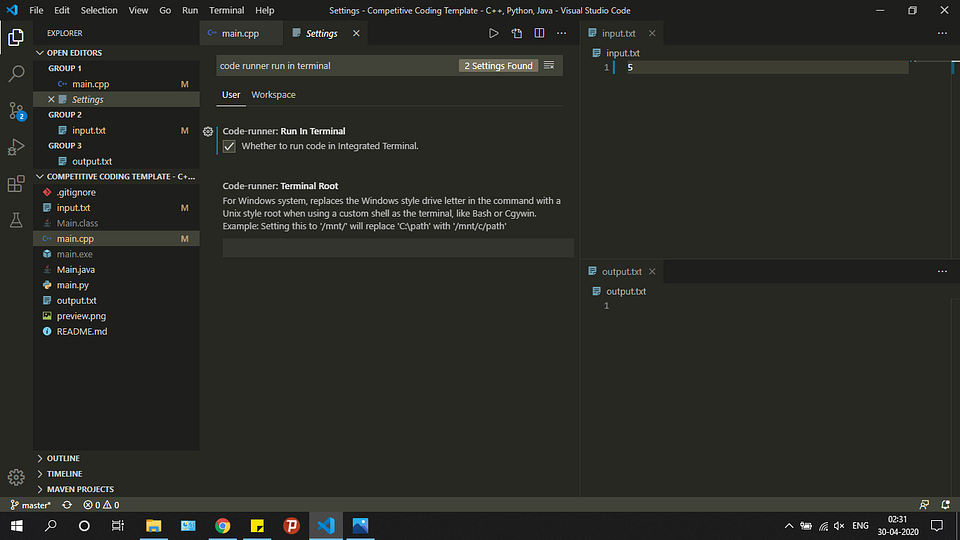
Прежде чем использовать это расширение, нам нужно настроить его так, чтобы оно работало через терминал, иначе мы не сможем обеспечить консольный ввод нашего кода. Эти шаги очень важно проделать в точности:
- Выберите File -> Preferences -> Settings.
- Введите “code runner run in terminal” в поле поиска и установите галку в чекбоксе:
- Добавьте флаг -std=c++14.
По умолчанию Code Runner не добавляет флаг -std=c++14 при компиляции кода. Это ограничивает ваши возможности как программиста. Например, если вы попытаетесь сделать так:
vector<vector<int>> temp;temp.push_back({1, 2, 3});
То это вызовет предупреждение: “Расширенные списки инициализаторов доступны только с -std=c++11 или -std=gnu++11”.
Выполните следующие действия, чтобы добавить флаг:
- Выберите File -> Preferences -> Settings.
- Введите в поиске “Run Code Configuration”.
- Определите местонахождение “Code-runner: Executor Map” и выберите “Edit in settings.json”. Это откроет файл settings.json. Добавьте туда следующий код:
"code-runner.executorMap": { "cpp": "cd $dir && g++ -std=c++14 $fileName -o $fileNameWithoutExt && $dir$fileNameWithoutExt"}
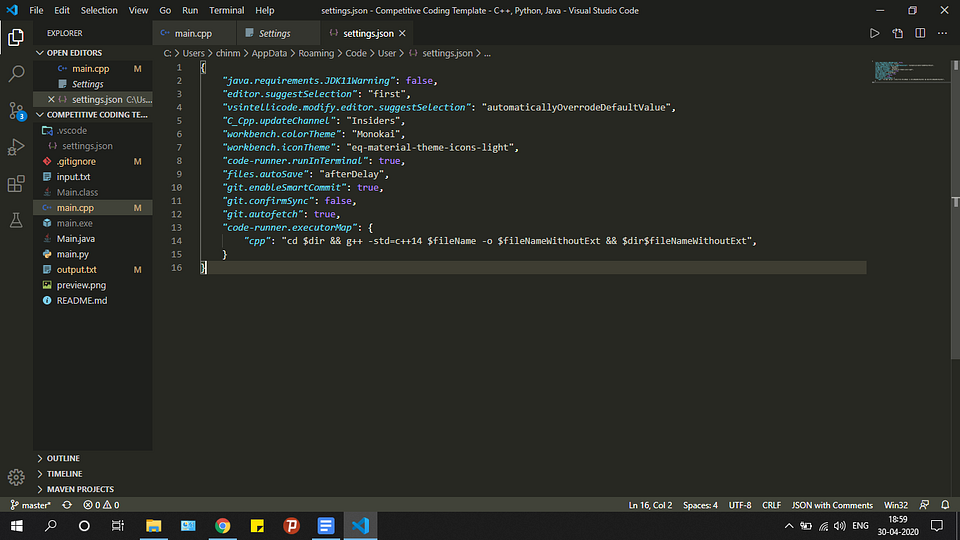
- Сохраните изменения — и готово!
Наконец-то всё настроено для запуска ваших программ на C++, Java и Python.
Откройте файл main.cpp. Нажмите правую кнопку мыши и выберите опцию Run Code. Попробуйте напечатать что-нибудь в функции solve(), чтобы проверить, происходит ли у вас вывод в файл output.txt или нет.
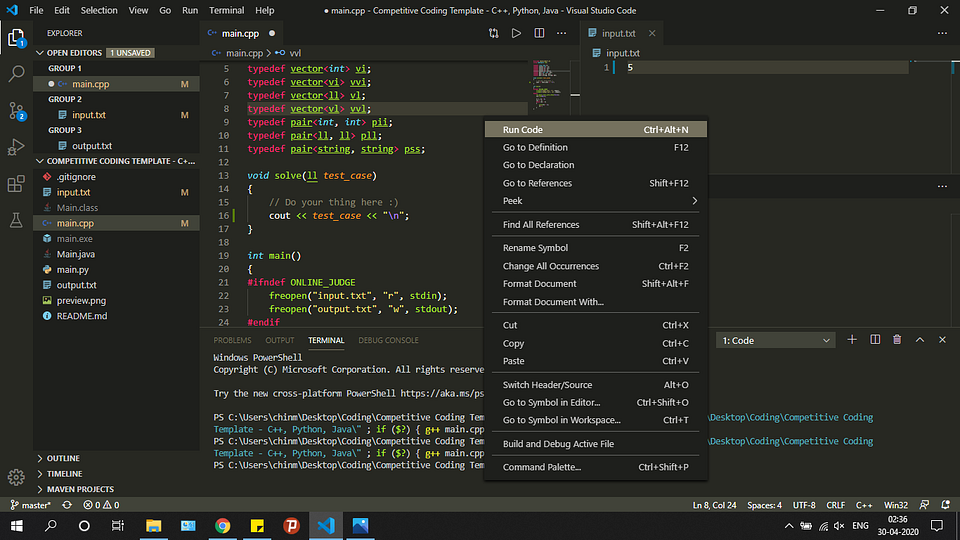
Следуйте той же процедуре с файлами Main.java и main.py. Расширение Code Runner возьмет на себя выполнение каждого из них.
Я надеюсь, что эта статья помогла вам настроить Visual Studio Code. Счастливого программирования!
Читайте также:
- Проекты на Python с помощью Visual Studio Code
- 10 рекомендаций по ускорению рабочего процесса в Visual Studio Code
- Как настроить отладчик для Chrome extension в Visual Studio Code
Перевод статьи Chinmay Kulkarni: “How to Setup Visual Studio Code for C, C++, Java, Python | Competitive Programming”
Уважаемый usernameusername,
примерно год назад я точно так же не мог с первого раза настроить VS Code.
Как справедливо указали в комментариях — есть прекрасная официальная документация по настройке. Тем не менее, я оставлю свой ответ, так как он более детальный в некоторых моментах. А в других моментах — менее детальный 
Чтобы настроить VSC, хорошо бы научиться компилировать и запускать Вашу программу из командной строки. А потом настройки, котрые для этого понадобились, добавить в правильные места в файлах конфигурации VS code.
Труднность этого процесса именно в «зоопарке» разных возможностей. На этого не стоит пугаться.
Кроме того, настройка немного отличатся для разных систем (Linux, windows, macos), а Вы не указали, какая система у вас.
Я приведу пример настройки для компилятора gcc под Win64. Можно повторить мои шаги, а когда получится — сделать самостотельную настройку, например, на другой компилятор.
-
Устанавливаем msys2. Я установил его в
C:\Programs\msys64. При этом сам msys2 позаботился о том, чтобы путь к его директорииC:\Programs\msys64\mingw64\binоказался в path. Проверить это можно, выполнив в консоли командуpath -
Устанавливаем компилятор и дебаггер. Я делаю это с помощью пакета msys2, выполнив в окне, котрое открывает msys2, следующие команды:
pacman -SyuuЭта команда обновляет msys2. Она может закрыть консоль — это нормально, нужно перезапустить ее и ввести ту же команду, чтобы завершить обновление. Хорошей идеей будет время от времени обновляться, чтобы всегда иметь последнюю версию компилятора.
Затем:
 pacman -S mingw-w64-x86_64-gcc
 pacman -S mingw-w64-x86_64-gdb
Теперь в Вашей системе есть компилятор и дебаггер. Проверить это просто: открываем новое окно консоли, пишем g++ --version
Если ответом не является версия — надо поискать, что пошло не так. Проверить path, возможно, отредактировать его вручную.
Такую же проверку хорошо бы сделат для дебаггера: gdb --version
-
Пишем hello world. Это позволит нам окончательно убедиться, что компилятор работает. в любой директории созадем файл hello.cpp с текстом
 #include <iostream>
 int main() {
     std::cout << "Hello world!" << std::endl;
     return 0;
 };
потом в этой папке в командной строке компилируем командой g++ hello.cpp -o hello.exe
Если появился файл hello.exe, и он запускается и вывоит строчку — ок, этот шаг завершен.
-
А вот теперь можно поставить VSC. Обратите внимание, что редакций есть несколько, во первых для 32 и 64 битных систем, а во вторых — то, что назывется «User Installer» и «System Installer». Выбираем 64 битный System Installer на странице загрузки
-
В VSC ставим расширение для работы с C++, оно называется
C/C++ for Visual Studio Codeи написано Microsoft -
Теперь запустим VSC в папке Вашего проекта. Пусть это будет папка
C:\Projects\. Делается это так: запускам консоль. Переходим в консоли в папку (cd C:\Projects\). Запускаем VSC командойcode ..
Важно то, что при этом создаётся папка настроек VSC, котрые находятся по пути C:\Projects\.vscode. В этой папке нужно создать 4 файла, я приведу их в минимальном варианте. Пути — для моей системы, где msys2 установлен в C:\Programs\msys64\.
Файл tasks.json — отвечает за то, чтобы работала комбинация клавиш Ctrl+shift+B для сборки программы:
    {
        "version": "2.0.0",
        "tasks": [
            {
                "type": "shell",
                "label": "g++.exe build active file",
                "command": "C:/Programs/msys64/mingw64/bin/g++.exe",
                "args": [
                    "-std=c++17",
                    "-g",
                    "${file}",
                    "-o",
                    "${fileDirname}\\${fileBasenameNoExtension}.exe"
                ],
                "options": {
                    "cwd": "C:\\Programs\\msys64\\mingw64\\bin"
                },
                "problemMatcher": [
                    "$gcc"
                ],
                "group": {
                    "kind": "build",
                    "isDefault": true
                }

            }
        ]
    }
Файл launch.json — отвечает за работу дебаггера:
    {
        "version": "0.2.0",
        "configurations": [
            {
                "name": "g++.exe build and debug active file",
                "type": "cppdbg",
                "request": "launch",
                "program": "${fileDirname}\\${fileBasenameNoExtension}.exe",
                "args": [],
                "stopAtEntry": false,
                "cwd": "${workspaceFolder}",
                "environment": [],
                "externalConsole": false,
                "MIMode": "gdb",
                "miDebuggerPath": "C:\\Programs\\msys64\\mingw64\\bin\\gdb.exe",
                "setupCommands": [
                    {
                        "description": "Enable pretty-printing for gdb",
                        "text": "-enable-pretty-printing",
                        "ignoreFailures": true
                    }
                ],
                "preLaunchTask": "g++.exe build active file",
                "internalConsoleOptions": "neverOpen"
            }
        ]
    }
Файл settings.json — как то отвечает за файловые ассоциации, возможно даже, что он не особо нужен. Но лишним не будет:
    {
        "files.associations": {
            "ostream": "cpp",
            "iostream": "cpp",
            "iomanip": "cpp",
            "chrono": "cpp",
            "iosfwd": "cpp",
            "thread": "cpp",
            "array": "cpp",
            "string_view": "cpp",
            "initializer_list": "cpp",
            "utility": "cpp",
            "valarray": "cpp",
            "optional": "cpp",
            "sstream": "cpp"
        }
    }
Файл c_cpp_properties.json — отвечает за расположение include — файлов:
    {
        "configurations": [
            {
                "name": "Win32",
                "includePath": [
                    "${workspaceFolder}/**",
                    "C:/Programs/msys64/mingw64/include/**"
                ],
                "defines": [
                    "_DEBUG",
                    "UNICODE",
                    "_UNICODE"
                ],
                "windowsSdkVersion": "8.1",
                "compilerPath": "C:\\Programs\\msys64\\mingw64\\bin\\g++.exe",
                "cStandard": "c11",
                "cppStandard": "c++17",
                "intelliSenseMode": "gcc-x86"
            }
        ],
        "version": 4
    }
Если Вы создадите эти файлы, а потом заново запустите в этой директории VSC — то всё уже должно работать. То есть, программы на C++ будут компилироваться, запускаться в отладке (по F5) и показывать значения переменных в окне отладчика.
Теперь — самое важное. Как только заработает — Вам нужно эту папку .vscode копировать к корень каждой папки с проектом на C++. Это позволит VSC запускаться с Вашими настройками.
Даже если мой способ Вам не подходит напрямую — у Вас теперь есть все необходимые ключевые слова, чтобы использовать их для гуглежа.
Успехов!
PS. Время от времени попадаются полезные дополнительные возможности для настройки.
Вот такой фрагмент файла tasks.json позволяет очищать окно терминала перед каждым билдом — полезно, чтобы уже не видеть уже исправленных ошибок, оставшихся от предыдущей попытки сборки (Источник):
    "presentation": {
            "clear": true                        // <-- this line
      }
Hello everyone in this article we will discuss C and C++ programming setup in visual studio code for windows, Linux, and macOS. C and C++ are high-level programming languages for building software, browsers, etc. It is usually recommended to use a code editor to compile them as they come with a lot of additional features. Visual studio code is one of the popular code editors among the developer community. In this article, we will show you how to install all the compilers(gcc, g++), and the extensions required step by step.
Visual studio code
If you are familiar with vs code I guess you don’t need any introduction. For those who are not familiar with VS code make sure you install it first. Microsoft developed VS code in 2015 since its release, it has become one of the most popular code editors. It has many other features like an integrated terminal, support for IntelliSense code completion, code snippets, git control, etc. Once you download it starts reading the docs to get familiar with the editor and their features.
Installing compilers
C and C++ have compiled languages. So we need to install the compilers to run the code. A compiler is a software used to translate your computer-written code into machine code. To run C and C++ we need to install the MinGW compiler. We need to install the gcc and g++ compiler and gdb debugger. The process is different for different operating systems let’s now discuss them in detail.
Windows
On Windows, we need to install several software to install the compilers. First, visit the official MinGW website and go to the download sections there click on MSYS2 then click on installation GitHub. Now it will redirect to its official MSYS2 website now scroll down there you can see the installer, download the .exe file and follow the instructions mentioned below.

MSYS is a software library you can download a lot of stuff using this software on windows. Here our goal is to install C and C++ compilers. Once the installation is done the terminal will open automatically if it isn’t click on Windows and search for MSYS2 UCRT64 and open it.
Firstly we will update the packages so that we can download the latest version of it. Make sure you have a stable internet connection before you start downloading packages. To start downloading enter the following command
Code language: Bash (bash)
$ pacman -Syu
It will show some details about the size to proceed with installation enter y and hit the enter button it will start updating the packages. To complete the process enter y and hit the enter button the terminal will be closed. Now click on Windows and search for MSYS2 MSYS here we will update some base packages to do that enter the following command. And enter y and hit the enter button where ever required.
Code language: Bash (bash)
$ pacman -Su
Now click on the windows button and search MSYS2 MINGW64 for 64-bit devices for 32-bit devices it is MSYS MINGW32 and opens it. Here we will install the gcc and g++ compilers. To do that enter the following commands
For 64 bit
Code language: Bash (bash)
$ pacman -S mingw-w64-x86_64-gcc
For 32 bit
pacman -S mingw-w64-i686-gccCode language: Bash (bash)
Enter y and hit the enter button to proceed with the installation. Once the installation is done check the version of gcc and g++ to do that enter the gcc --version g++ --version command and hit enter in your MSYS terminal, not in your system terminal. It will show the version if it shows any error do the above process again. As of now, the latest version is 12.2.0 it will be greater if you are seeing this in the future it will be a greater number than this.
Now we will install the debugger so that we can debug our code. To do that enter the following commands
For 64 bit
Code language: Bash (bash)
$ pacman -S mingw-w64-x86_64-gdb
For 32 bit
Code language: Bash (bash)
$ pacman -S mingw-w64-i686-gdb
After the installation checks the version of gdb and enters the gdb --version in you are terminal. And one last thing we are going to do is set up the path environment variables. This is the most important step lot of people get stuck here so read it carefully. Now open your command prompt and check the version of gcc it is showing an error right you will get an error message that “gcc is not recognized as the internal or external command “ it is because we didn’t add gcc to the path variables. Close the command prompt.
Firstly we have to copy the path where the compilers have been installed. Open the file explorer we have installed compilers in the c drive open the msys64 folder there you can see mingw64 and mingw32 open them according to your device. Then open the bin folder and copy the path. To copy the path go to the navigation bar and left click now you can see click on copy address. It looks like this C:\msys64\mingw64\bin for 64-bit and for 32-bit it is C:\msys64\mingw32\bin
Now go to your search bar and search environment variables and open it. Click on environmental variables now in system variables click on the path and click on edit. Now in the new window click on new and paste your path over there. Finally, click on ok on every new window that has opened during this process. That’s it hell of a process, isn’t it? To confirm this open your command prompt and enter the command gcc --version now you can see the version of the gcc. Read the extensions section before you start writing the code.
Linux
The process is very simple in Linux(Ubuntu). Firstly let’s update to the latest version
Code language: Bash (bash)
$ sudo apt-get update
Enter your password. Once the update is done we need to install the compiler packages to do that enter the following command
Code language: Bash (bash)
$ sudo apt-get install build-essential gdb g++
Once the installation is done check the version of gcc and gdb. And install the extensions mentioned in the extensions section to run your code
macOS
The process is very simple in macOS you just have to enter two commands in the terminal to download the MinGW compiler. Now open your terminal and paste the following command
Intel Mac
Code language: Bash (bash)
/bin/bash -c "$(curl -fsSL https://raw.githubusercontent.com/Homebrew/install/HEAD/install.sh)"
M1 Mac
Code language: Bash (bash)
arch -x86_64 ruby -e "$(curl -fsSL https://raw.githubusercontent.com/Homebrew/install/HEAD/install)" < /dev/null 2> /dev/null
This command will install homebrew in your mac system. Now we will install the MinGW compiler
Intel Mac
Code language: Bash (bash)
brew install MinGW-w64
M1 Mac
Code language: Bash (bash)
arch -x86_64 brew install MinGW-w64
Wait for the installation to complete. That’s it the MinGW compilers are installed in your system. Check the version of the compiler to that and enter the following command gcc --version. Install the extensions mentioned in the extensions section to run your programs.
Extensions
Once you installed the required compilers you need to install some extensions. You can find this extension on the left side of your interface just click on it or else click ctrl+shift+X on windows and Linux on the mac cmd+shift+X will open extensions. Now search for C/C++ and install it.


Another extension you need to install is code runner this extension will help you to run your code easily by clicking the run button. Once the installation is done restart the vs code and you are good to go now you can run your programs easily from vscode. Now there is one last thing we need to do. That is open your settings ctrl+, on windows and Linux on the mac cmd+,. Once you open the settings search for Run In Terminal in the search bar. And scroll down there you will find a Code-runner section tick the box.

Run a simple program to confirm if everything is working or not.
Code language: C++ (cpp)
#include<iostream> using namespace std; int main() { cout<<"Welcome to codedamn!"; return 0; }
Codedamn playground
As of now, you should have installed the compilers and be able to run the programs in the vs code. It’s a heck of a process, isn’t it? Especially for windows users, it will take a lot of effort and patience. Often when compiling your code you get a lot of errors like compilers not being installed properly or if you didn’t add them to your path the code won’t compile. And if you are using low-end devices becomes difficult to run your programs. To overcome these problems codedamn has come up with a new online C/C++ playground where you can write, edit and run your code. The big advantage is you can write code within your browser and no need to download any software all you need is a device with a good internet connection.

To use the playground go to your browser and search for codedamn playground open the first link. Signup to codedamn if you are new to codedamn. Now click on the C/C++ playground and create a new project. Now you can write your code and run it. This feature is also available for mobile devices just follow the above-mentioned steps. And more importantly, you can share your playground and collaborate with other developers\friends. You can use the terminal at the bottom to enter into interactive mode and run your code line by line. More importantly, you can save your code after you compiled it will be there in the browser until you delete it. There are other playgrounds as well totally free of cost check them out.

Conclusion
By now you must be able to run your C/C++ programs in the vs code. We have discussed all the software required to run the code. It’s a bit long process for windows compared to Linux and mac users. Make sure you add the compiler path to environmental variables in the windows systems you do not need to do that for Linux and mac. Make sure you install the extensions C/C++ and coderunner you need to install them inside the vs code it is mandatory for every OS. codedamn offers a free online C/C++ playground where you can write and run your code. That’s it from this article. If you have any doubts or queries comment below in the comment section. Check out other articles from codedamn about C/C++ language. Thank you!
In this tutorial, you configure Visual Studio Code to use the Microsoft Visual C++ compiler and debugger on Windows.
After configuring VS Code, you will compile and debug a simple Hello World program in VS Code. This tutorial does not teach you details about the Microsoft C++ toolset or the C++ language. For those subjects, there are many good resources available on the Web.
If you have any problems, feel free to file an issue for this tutorial in the VS Code documentation repository.
Prerequisites
To successfully complete this tutorial, you must do the following:
-
Install Visual Studio Code.
-
Install the C/C++ extension for VS Code. You can install the C/C++ extension by searching for ‘c++’ in the Extensions view (⇧⌘X (Windows, Linux Ctrl+Shift+X)).
-
Install the Microsoft Visual C++ (MSVC) compiler toolset.
If you have a recent version of Visual Studio, open the Visual Studio Installer from the Windows Start menu and verify that the C++ workload is checked. If it’s not installed, then check the box and select the Modify button in the installer.
You can also install the Desktop development with C++ workload without a full Visual Studio IDE installation. From the Visual Studio Downloads page, scroll down until you see Tools for Visual Studio under the All Downloads section and select the download for Build Tools for Visual Studio 2022.
This will launch the Visual Studio Installer, which will bring up a dialog showing the available Visual Studio Build Tools workloads. Check the Desktop development with C++ workload and select Install.
Note: You can use the C++ toolset from Visual Studio Build Tools along with Visual Studio Code to compile, build, and verify any C++ codebase as long as you also have a valid Visual Studio license (either Community, Pro, or Enterprise) that you are actively using to develop that C++ codebase.
Check your Microsoft Visual C++ installation
To use MSVC from a command line or VS Code, you must run from a Developer Command Prompt for Visual Studio. An ordinary shell such as PowerShell, Bash, or the Windows command prompt does not have the necessary path environment variables set.
To open the Developer Command Prompt for VS, start typing ‘developer’ in the Windows Start menu, and you should see it appear in the list of suggestions. The exact name depends on which version of Visual Studio or the Visual Studio Build Tools you have installed. Select the item to open the prompt.
You can test that you have the C++ compiler, cl.exe, installed correctly by typing ‘cl’ and you should see a copyright message with the version and basic usage description.
If the Developer Command Prompt is using the BuildTools location as the starting directory (you wouldn’t want to put projects there), navigate to your user folder (C:\users\{your username}\) before you start creating new projects.
Note: If for some reason you can’t run VS Code from a Developer Command Prompt, you can find a workaround for building C++ projects with VS Code in Run VS Code outside a Developer Command Prompt.
Create Hello World
From the Developer Command Prompt, create an empty folder called «projects» where you can store all your VS Code projects, then create a subfolder called «helloworld», navigate into it, and open VS Code (code) in that folder (.) by entering the following commands:
mkdir projects
cd projects
mkdir helloworld
cd helloworld
code .
The «code .» command opens VS Code in the current working folder, which becomes your «workspace». As you go through the tutorial, you will see three files created in a .vscode folder in the workspace:
tasks.json(build instructions)launch.json(debugger settings)c_cpp_properties.json(compiler path and IntelliSense settings)
Add a source code file
In the File Explorer title bar, select the New File button and name the file helloworld.cpp.
Add hello world source code
Now paste in this source code:
#include <iostream>
#include <vector>
#include <string>

using namespace std;

int main()
{
    vector<string> msg {"Hello", "C++", "World", "from", "VS Code", "and the C++ extension!"};

    for (const string& word : msg)
    {
        cout << word << " ";
    }
    cout << endl;
}
Now press ⌘S (Windows, Linux Ctrl+S) to save the file. Notice how the file you just added appears in the File Explorer view (⇧⌘E (Windows, Linux Ctrl+Shift+E)) in the side bar of VS Code:
You can also enable Auto Save to automatically save your file changes, by checking Auto Save in the main File menu.
The Activity Bar on the far left lets you open different views such as Search, Source Control, and Run. You’ll look at the Run view later in this tutorial. You can find out more about the other views in the VS Code User Interface documentation.
Note: When you save or open a C++ file, you may see a notification from the C/C++ extension about the availability of an Insiders version, which lets you test new features and fixes. You can ignore this notification by selecting the
X(Clear Notification).
Explore IntelliSense
In your new helloworld.cpp file, hover over vector or string to see type information. After the declaration of the msg variable, start typing msg. as you would when calling a member function. You should immediately see a completion list that shows all the member functions, and a window that shows the type information for the msg object:
You can press the Tab key to insert the selected member; then, when you add the opening parenthesis, you will see information about any arguments that the function requires.
Run helloworld.cpp
Remember, the C++ extension uses the C++ compiler you have installed on your machine to build your program. Make sure you have a C++ compiler installed before attempting to run and debug helloworld.cpp in VS Code.
-
Open
helloworld.cppso that it is the active file. -
Press the play button in the top right corner of the editor.
-
Choose C/C++: cl.exe build and debug active file from the list of detected compilers on your system.
You’ll only be asked to choose a compiler the first time you run helloworld.cpp. This compiler will be set as the «default» compiler in tasks.json file.
-
After the build succeeds, your program’s output will appear in the integrated Terminal.
If you get an error trying to build and debug with cl.exe, make sure you have started VS Code from the Developer Command Prompt for Visual Studio using the code . shortcut.
The first time you run your program, the C++ extension creates tasks.json, which you’ll find in your project’s .vscode folder. tasks.json stores build configurations.
Your new tasks.json file should look similar to the JSON below:
{
  "version": "2.0.0",
  "tasks": [
    {
      "type": "shell",
      "label": "C/C++: cl.exe build active file",
      "command": "cl.exe",
      "args": [
        "/Zi",
        "/EHsc",
        "/Fe:",
        "${fileDirname}\\${fileBasenameNoExtension}.exe",
        "${file}"
      ],
      "problemMatcher": ["$msCompile"],
      "group": {
        "kind": "build",
        "isDefault": true
      },
      "detail": "Task generated by Debugger."
    }
  ]
}
Note: You can learn more about
tasks.jsonvariables in the variables reference.
The command setting specifies the program to run; in this case that is «cl.exe». The args array specifies the command-line arguments that will be passed to cl.exe. These arguments must be specified in the order expected by the compiler.
This task tells the C++ compiler to take the active file (${file}), compile it, and create an executable file (/Fe: switch) in the current directory (${fileDirname}) with the same name as the active file but with the .exe extension (${fileBasenameNoExtension}.exe), resulting in helloworld.exe for our example.
The label value is what you will see in the tasks list; you can name this whatever you like.
The detail value is what you will as the description of the task in the tasks list. It’s highly recommended to rename this value to differentiate it from similar tasks.
The problemMatcher value selects the output parser to use for finding errors and warnings in the compiler output. For cl.exe, you’ll get the best results if you use the $msCompile problem matcher.
From now on, the play button will read from tasks.json to figure out how to build and run your program. You can define multiple build tasks in tasks.json, and whichever task is marked as the default will be used by the play button. In case you need to change the default compiler, you can run Tasks: Configure default build task. Alternatively you can modify the tasks.json file and remove the default by replacing this segment:
    "group": {
        "kind": "build",
        "isDefault": true
    },
with this:
"group": "build",
Modifying tasks.json
You can modify your tasks.json to build multiple C++ files by using an argument like "${workspaceFolder}/*.cpp" instead of ${file}.This will build all .cpp files in your current folder. You can also modify the output filename by replacing "${fileDirname}\\${fileBasenameNoExtension}.exe" with a hard-coded filename (for example "${workspaceFolder}\\myProgram.exe").
Debug helloworld.cpp
To debug your code,
- Go back to
helloworld.cppso that it is the active file. - Set a breakpoint by clicking on the editor margin or using F9 on the current line.
- From the drop-down next to the play button, select Debug C/C++ File.
- Choose C/C++: cl.exe build and debug active file from the list of detected compilers on your system (you’ll only be asked to choose a compiler the first time you run or debug
helloworld.cpp).
The play button has two modes: Run C/C++ File and Debug C/C++ File. It will default to the last-used mode. If you see the debug icon in the play button, you can select the play button to debug, instead of selecting the drop-down menu item.
If you get an error trying to build and debug with cl.exe, make sure you have started VS Code from the Developer Command Prompt for Visual Studio using the code . shortcut.
Explore the debugger
Before you start stepping through the code, let’s take a moment to notice several changes in the user interface:
-
The Integrated Terminal appears at the bottom of the source code editor. In the Debug Output tab, you see output that indicates the debugger is up and running.
-
The editor highlights the line where you set a breakpoint before starting the debugger:
-
The Run and Debug view on the left shows debugging information. You’ll see an example later in the tutorial.
-
At the top of the code editor, a debugging control panel appears. You can move this around the screen by grabbing the dots on the left side.
Step through the code
Now you’re ready to start stepping through the code.
-
Click or press the Step over icon in the debugging control panel.
This will advance program execution to the first line of the for loop, and skip over all the internal function calls within the
vectorandstringclasses that are invoked when themsgvariable is created and initialized. Notice the change in the Variables window on the left.In this case, the errors are expected because, although the variable names for the loop are now visible to the debugger, the statement has not executed yet, so there is nothing to read at this point. The contents of
msgare visible, however, because that statement has completed. -
Press Step over again to advance to the next statement in this program (skipping over all the internal code that is executed to initialize the loop). Now, the Variables window shows information about the loop variables.
-
Press Step over again to execute the
coutstatement. (Note that as of the March 2019 release, the C++ extension does not print any output to the Debug Console until the loop exits.) -
If you like, you can keep pressing Step over until all the words in the vector have been printed to the console. But if you are curious, try pressing the Step Into button to step through source code in the C++ standard library!
To return to your own code, one way is to keep pressing Step over. Another way is to set a breakpoint in your code by switching to the
helloworld.cpptab in the code editor, putting the insertion point somewhere on thecoutstatement inside the loop, and pressing F9. A red dot appears in the gutter on the left to indicate that a breakpoint has been set on this line.Then press F5 to start execution from the current line in the standard library header. Execution will break on
cout. If you like, you can press F9 again to toggle off the breakpoint.
Set a watch
Sometimes you might want to keep track of the value of a variable as your program executes. You can do this by setting a watch on the variable.
-
Place the insertion point inside the loop. In the Watch window, select the plus sign and in the text box, type
word, which is the name of the loop variable. Now view the Watch window as you step through the loop. -
Add another watch by adding this statement before the loop:
int i = 0;. Then, inside the loop, add this statement:++i;. Now add a watch forias you did in the previous step. -
To quickly view the value of any variable while execution is paused on a breakpoint, you can hover over it with the mouse pointer.
Customize debugging with launch.json
When you debug with the play button or F5, the C++ extension creates a dynamic debug configuration on the fly.
There are cases where you’d want to customize your debug configuration, such as specifying arguments to pass to the program at runtime. You can define custom debug configurations in a launch.json file.
To create launch.json, choose Add Debug Configuration from the play button drop-down menu.
You’ll then see a dropdown for various predefined debugging configurations. Choose C/C++: cl.exe build and debug active file.
VS Code creates a launch.json file, which looks something like this:
{
  "version": "0.2.0",
  "configurations": [
    {
      "name": "C/C++: cl.exe build and debug active file",
      "type": "cppvsdbg",
      "request": "launch",
      "program": "${fileDirname}\\${fileBasenameNoExtension}.exe",
      "args": [],
      "stopAtEntry": false,
      "cwd": "${workspaceFolder}",
      "environment": [],
      "externalConsole": false,
      "preLaunchTask": "C/C++: cl.exe build active file"
    }
  ]
}
In the JSON above, program specifies the program you want to debug. Here it is set to the active file folder (${fileDirname}) and active filename with the .exe extension (${fileBasenameNoExtension}.exe), which if helloworld.cpp is the active file will be helloworld.exe. The args property is an array of arguments to pass to the program at runtime.
By default, the C++ extension won’t add any breakpoints to your source code and the stopAtEntry value is set to false.
Change the stopAtEntry value to true to cause the debugger to stop on the main method when you start debugging.
From now on, the play button and F5 will read from your
launch.jsonfile when launching your program for debugging.
C/C++ configurations
If you want more control over the C/C++ extension, you can create a c_cpp_properties.json file, which will allow you to change settings such as the path to the compiler, include paths, C++ standard (default is C++17), and more.
You can view the C/C++ configuration UI by running the command C/C++: Edit Configurations (UI) from the Command Palette (⇧⌘P (Windows, Linux Ctrl+Shift+P)).
This opens the C/C++ Configurations page. When you make changes here, VS Code writes them to a file called c_cpp_properties.json in the .vscode folder.
Visual Studio Code places these settings in .vscode\c_cpp_properties.json. If you open that file directly, it should look something like this:
{
  "configurations": [
    {
      "name": "Win32",
      "includePath": ["${workspaceFolder}/**"],
      "defines": ["_DEBUG", "UNICODE", "_UNICODE"],
      "windowsSdkVersion": "10.0.18362.0",
      "compilerPath": "C:/Program Files (x86)/Microsoft Visual Studio/2019/BuildTools/VC/Tools/MSVC/14.24.28314/bin/Hostx64/x64/cl.exe",
      "cStandard": "c11",
      "cppStandard": "c++17",
      "intelliSenseMode": "msvc-x64"
    }
  ],
  "version": 4
}
You only need to add to the Include path array setting if your program includes header files that are not in your workspace or in the standard library path.
Compiler path
The compilerPath setting is an important setting in your configuration. The extension uses it to infer the path to the C++ standard library header files. When the extension knows where to find those files, it can provide useful features like smart completions and Go to Definition navigation.
The C/C++ extension attempts to populate compilerPath with the default compiler location based on what it finds on your system. The extension looks in several common compiler locations.
The compilerPath search order is:
- First check for the Microsoft Visual C++ compilerOpe
- Then look for g++ on Windows Subsystem for Linux (WSL)
- Then g++ for Mingw-w64.
If you have g++ or WSL installed, you might need to change compilerPath to match the preferred compiler for your project. For Microsoft C++, the path should look something like this, depending on which specific version you have installed: «C:/Program Files (x86)/Microsoft Visual Studio/2017/BuildTools/VC/Tools/MSVC/14.16.27023/bin/Hostx64/x64/cl.exe».
Reusing your C++ configuration
VS Code is now configured to use the Microsoft C++ compiler. The configuration applies to the current workspace. To reuse the configuration, just copy the JSON files to a .vscode folder in a new project folder (workspace) and change the names of the source file(s) and executable as needed.
Run VS Code outside the Developer Command Prompt
In certain circumstances, it isn’t possible to run VS Code from Developer Command Prompt for Visual Studio (for example, in Remote Development through SSH scenarios). In that case, you can automate initialization of Developer Command Prompt for Visual Studio during the build using the following tasks.json configuration:
{
  "version": "2.0.0",
  "windows": {
    "options": {
      "shell": {
        "executable": "cmd.exe",
        "args": [
          "/C",
          // The path to VsDevCmd.bat depends on the version of Visual Studio you have installed.
          "\"C:/Program Files (x86)/Microsoft Visual Studio/2019/Community/Common7/Tools/VsDevCmd.bat\"",
          "&&"
        ]
      }
    }
  },
  "tasks": [
    {
      "type": "shell",
      "label": "cl.exe build active file",
      "command": "cl.exe",
      "args": [
        "/Zi",
        "/EHsc",
        "/Fe:",
        "${fileDirname}\\${fileBasenameNoExtension}.exe",
        "${file}"
      ],
      "problemMatcher": ["$msCompile"],
      "group": {
        "kind": "build",
        "isDefault": true
      }
    }
  ]
}
Note: The path to
VsDevCmd.batmight be different depending on the Visual Studio version or installation path. You can find the path toVsDevCmd.batby opening a Command Prompt and runningdir "\VsDevCmd*" /s.
Troubleshooting
The term ‘cl.exe’ is not recognized
If you see the error «The term ‘cl.exe’ is not recognized as the name of a cmdlet, function, script file, or operable program.», this usually means you are running VS Code outside of a Developer Command Prompt for Visual Studio and VS Code doesn’t know the path to the cl.exe compiler.
VS Code must either be started from the Developer Command Prompt for Visual Studio, or the task must be configured to run outside a Developer Command Prompt.
You can always check that you are running VS Code in the context of the Developer Command Prompt by opening a new Terminal (⌃⇧` (Windows, Linux Ctrl+Shift+`)) and typing ‘cl’ to verify cl.exe is available to VS Code.
fatal error C1034: assert.h: no include path set
In this case, cl.exe is available to VS Code through the PATH environment variable, but VS Code still needs to either be started from the Developer Command Prompt for Visual Studio, or be configured to run outside the Developer Command Prompt. Otherwise, cl.exe does not have access to important environment variables such as INCLUDE.
Next steps
- Explore the VS Code User Guide.
- Review the Overview of the C++ extension.
- Create a new workspace, copy your
.vscodeJSON files to it, adjust the necessary settings for the new workspace path, program name, and so on, and start coding!
3/7/2023