 Ok first off let me start by saying that this is probably the coolest piece of home computing hardware that I have ever laid my hands on. Yes the setup was easy, and yes the thing is rock solid, and yes wireless range is awesome. But for approx $200 USD you really should not expect anything less. I’m not going to go into its specs or features, as I’ll leave that to the professionals. Read up on it here.
Anyway out of the box it supported telnet, but I wanted ssh, so I dropped the default firmware and went with Asuswrt-Merlin. It was at this point I started to explore the Busybox OS and decided I wanted to monitor the device via my HomeLab Zenoss install.
However, much to my chagrin net-snmp was not installed out of the box.
So how do you install it you ask? Would you believe via a package manager?
First, you need to find the package name
#ipkg list | grep snmp
Then install the snmp package
#ipkg install net-snmp
Then configure it to start at boot time.
#app_set_enabled.sh net-snmp yes
In order to configure it, you are going to have to search for the snmp.conf
#find / -name snmpd.conf
I found two files and one of them clearly states that you should not edit it directly. The other one does not so this is the one that I modified to include my custom rocommunity. See below.
rocommunity lab
Now I just need to figure out how to allow port 161 udp/tcp on my local LAN segment and I am in business. However, I will probably tackle that tomorrow.
Additional Info (2016)
Note, you can restart snmp as shown below.
Stopping:
admin@RT-AC66U:/tmp/home/root# app_stop.sh net-snmp
killall: dm2_transmission-daemon: no process killed
killall: asus_lighttpd: no process killed
killall: dm2_snarfmaster: no process killed
killall: dm2_nzbget: no process killed
killall: dm2_amuled: no process killed
iptables: No chain/target/match by that name
iptables: Bad rule (does a matching rule exist in that chain?)
Starting:
admin@RT-AC66U:/tmp/home/root# app_set_enabled.sh net-snmp yes
The field(Enabled) was set “yes” already.
Restarting the package…
2016 Update – Configuring SNMP via the WebUI
Figured that I would add an update to this post as it seems that there are plenty of folks who are looking to setup SNMP on their Asus routers. Note that SNMP can now be configured directly from the WebUI.
In the left pane, click on “Advanced Setting”. Then click on the “SNMP” tab. See example below. Note that the webui does not seem to pick up your configuration if you have configured it via the cli. I have not tested to see if the WebUI overwrites the CLI configuration or if it creates another configuration file.

Additional Resources
Fatmin: How to Add a Static Route on the Asus RT-AC66U
Fatmin: Install and Configure SNMP on the Asus RT-AC66U
Recently I wanted to monitor an ASUS RT-N66U, a brilliant router with many feature, one of which did NOT appear to be SNMP.
After some rooting around on the Internet (pun intended?), I discovered that it is actually quite easy to set up.
For this you will need a small USB stick, I used an old tiny 4GB thumb drive.
Ensure it’s partitioned and formatted to ext2. If you’re using Windows then EaseUS Partition Master can help, there’s a free version for home use. Otherwise the Gnome Partition Editor, otherwise known as GParted, will work.
Just pop the USB drive into the back of the router and go to the «USB application» page in the UI, it’s one of the options under «General» on the left hand index.
At the bottom of that page is the «Download Master» which you can then choose to install onto your USB.
What this does is into install a package manager, along with various packages for the Download Master, but this gives you the ability to install other packages!
Next, in the «Advanced Settings» -> «Adminstration» section, about half way down the page in the «Miscellaneous» section is the «Enable Telnet» option. Set this to «Yes» so you can log into the router via telnet.
Telnet to the router and log in with your admin account.
Execute the following:
ipkg update
ipkg install net-snmp
app_set_enabled.sh net-snmp yes
the config file, should you need to change it, is /opt/etc/snmpd.conf
I found that after changing the file, to modify the community string for example, I had to execute S70net-snmp.1 in the /opt directory which, if you look at its contents, shuts down any snmpd and starts it again.
I noticed I have previously also tried to monitor my ASUS RT-N66U router to see what traffic passes through. You know, just your regular paranoid stuff. However, this time I was trying to monitor the router CPU load and bandwidth use to figure out if delays in my performance tests were somehow related to the router performance (as illustrated in some previous posts). Somehow this did not turn out to be quite so simple. I will just document my experiments in relation to setting up the CPU monitoring here for whatever that’s worth..
First off, I needed to enable SNMP on the router. Of course, I had done this long time ago, but anyway, on this particular router this is done in the admin panel under Administration->SNMP. The SNMP communities set on this panel are by default “public” for the reading operations and “private” for the write operations. So I will use these in my examples..
Secondly, I needed to find the OID’s to monitor. An OID is an Object ID that uniquely identifies some property we want to monitor/manage with SNMP. These are listed in something called MIB (Management Information Base) files, which there are plenty of, and browsing these gets complicated to try to find what you are interested in. So for me, I just Googled for “SNMP CPU OID” etc. Some potential ones I found:
Average CPU load
over last 1 minute: .1.3.6.1.4.1.2021.10.1.3.1
over last 5 minutes: .1.3.6.1.4.1.2021.10.1.3.2
over last 15 minutes: .1.3.6.1.4.1.2021.10.1.3.3
Percentages:
user CPU time: .1.3.6.1.4.1.2021.11.9.0
system CPU time: .1.3.6.1.4.1.2021.11.10.0
idle CPU time: .1.3.6.1.4.1.2021.11.11.0
raw user cpu time: .1.3.6.1.4.1.2021.11.50.0
raw system cpu time: .1.3.6.1.4.1.2021.11.52.0
raw idle cpu time: .1.3.6.1.4.1.2021.11.53.0
raw nice cpu time: .1.3.6.1.4.1.2021.11.51.0
So, looking at these, I figured if I wanted to figure out why my client-server performance gets hit when running the performance tests over the router with high numbers of concurrent clients, I would want a very fine granularity of information on the CPU load. Averages of 1-15 minutes are then not very useful for me. The percentage values seemed much more interesting. However, even though these are listed the same way all over the internet, nowhere does it really say what is their granularity. That is, percentage over what time? Or I am sure it is said somewhere but I did not stumble onto it. Anyway, I hopefully assumed it was “real-time” percentage. That is, load percentage at the time of measurement.
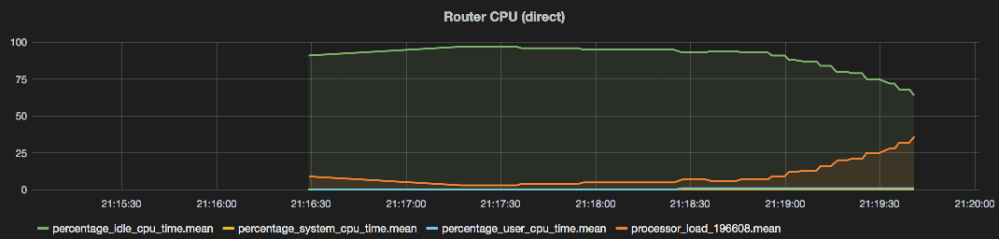
So I set up my system to query these from the router:

I was expecting system+user CPU time to equal to what would be the actual CPU load. Obviously not, as the idle time shows going down by about 25% on the right end, while the system+user loads sum up to less than 2%. So I am missing a large chunk of actual CPU load somewhere (about 23% in the right side here). Also, the idle graph might be correct but it is definitely not “real-time”. When I look at the CPU load graph shown in the router admin interface itself, this is quite obvious:

The admin interface shows a shorter timeframe, so the right hand side of the SNMP idle graph matches generally the slope of CPU load shown in the router admin interface. However, it is much less “bumpy” than the router graph, meaning it is an average over a longer period than the one shown in the router interface. Even though my “system+user” measure is obviously broken, I could get the CPU load from this by using a formula of “100 – idle”. However, obviously I would prefer something more fine-grained.
Another hopeful approach I found is the OID for something called ProcessorLoad (.1.3.6.1.2.1.25.3.3.1.2.x). This one is a bit odd though, I believe the “x” part identifies the processor for which I want the statistics for (in this case my router only has one core, in more modern ones there are multiple). To find this out I do an snmpwalk on commandline:
snmpwalk -v2c -c public 192.168.2.1 .1.3.6.1.2.1.25.3.3.1.2
Which on my N66U gives me:
iso.3.6.1.2.1.25.3.3.1.2.196608 = INTEGER: 1
And on another AC68U that I also had access to it also gives another core with id 196609 (the AC68U is a dual-core router). The value (INTEGER:1) is the load of the processor. Using this, I get a load graph that is the opposite of the idle graph, so obviously it is now correctly measuring the load average over the same period as the idle graph is:
However, as before, this is obviously not as fine grained as I was hoping. For comparison, the admin graph again:

So is there another way I can get a finer granularity of information somehow? Looking and asking around a bit I did not find much information on this. However, somewhere on the mighty internet I did find information that the average value OIDs (1-15min) would be deprecated because the same information can be derived using the “raw” values. I already listed most of these “raw” measure OIDs in the beginning, but what is a raw value and how do I use them?
After some Google-fu (or flu) it turns out the “raw” values are something called CPU ticks. So what is such a tick? My understanding these are some values used internally to provide fine-grained time intervals that map to how much time the CPU spends in each state (system, user, idle, …). Anyway, they seem to be at quite granular level (much less than a second, and I was looking for one second precision), so maybe I can use these. And how do you calculate the percentage of CPU load from the raw values?
Again, not a huge amount of information on this. But I figure it can be done by adding all the different “raw” values together and calculating the percentage of busy values vs idle values in the observed time period. Here I use the diff of the values so if at second 1 the value is 5 and at second 2 it is 10, the actual number of ticks for the last period (second 2) is 10-5=5.
To calculate the percentage, if the raw values for “user”+”system”+”nice” sum up to 10 ticks in a second, and the raw value for “idle” is 90 ticks in the same second, I get a 10% CPU load for that second (with 90% idle). Of course, I cannot assume these values are not 0-100 or anything like that, but I have to assume there can be any number of ticks in a second. I also believe the number of ticks per second can also vary across a system, so I need a more dynamic calculation.
Formula I tried is (user+system+nice)/(user+system+nice+idle)*100 to get the percentage. As I mentioned, there is not much information on this that I found. However, I found some post(s) suggesting this was actually the way some commonly used SNMP monitoring tools also do it. So what does it look like if I do it like this? It looks like this:

As before, the idle line seems about correct (the router graph is the same one above), and in this case it is obviously at much finer granularity than before. Which is nice. However, when I compare the “system”, “nice” and “user” lines to the “idle” line they are obviously still nowhere near the actual load. They (“system”+”nice”+”user”) sum up to about 2% at most, while the idle line shows that something is consuming up to 65% or so of CPU load (right end of the graph, “100-idle”).
Why these broken results? After going through my SNMP polling code too many times to look for any bugs, trying various fixes, etc. I figure either the router SNMP implementation is broken or I am still doing it wrong. More likely the latter.
So finally I got the idea to SSH into the router (ASUS Merlin firmware at least has the option to enable an internal SSH server in the router). Then I run the “top” command to see if I the load reported by “top” is as far away from my SNMP graphs as the router admin panel charts.

Surprisingly, “top” shows values very close to what I was getting from my raw percentage calculations for “user”, “system”, and “nice”. So what gives? Well, the “idle” is also close to the same as my graph, so after looking around some more, I notice there is another value called “sirq” that I have not included in my formula. And it is big. Googling around for “sirq” just got me a bunch of questions on “top” and “sirq” and why it is sometimes high. But no explanation for what “sirq” actually stands for. After some time I finally figure out it must be related to “software interrupts”.
So after some more Googleing, I find there is an OID that seems relevant: 1.3.6.1.4.1.2021.11.61 (ssCpuRawSoftIRQ). Performing an SNMP walk over1.3.6.1.4.1.2021.11 actually shows this (the raw values are actually under the same hierarchy branch). I did the snmpwalk before but missed this as it was never mentioned elsewhere I looked and appeared later in the list of walk results.. Thats my excuse.
So I add the soft interrupt load to my formulas and now I finally get:

So summing up the user+system+nice+sirq should do the trick. However, even without this I see it is in my case mostly just the “sirq” value that makes up the load here. Which seems much closer to the router admin panel chart:
However, it is still not quite the same. Why is this? The number of ticks seems to be actually only updated every 5 seconds, so I guess this is the finest granularity that I can monitor on this router. But the admin panel seems finer, probably one second interval. But at least 5 seconds is better than one minute..
As a related note, I was interested in more metrics than just this. The metrics for bandwidth consumed on the router (maybe if my performance test was taking too much bandwidth it would cause problems) as well as other resource use on the router, such as memory. The bandwidth is a bit tricky. The router has a number of network interfaces. For the internet (WAN) connect, the wired ports, as well as the wireless. I could get a list of all these by performing another snmpwalk of the related OID:
snmpwalk -v2c -c public 192.168.2.1 .1.3.6.1.2.1.2.2.1.2
IF-MIB::ifDescr.1 = STRING: lo
IF-MIB::ifDescr.2 = STRING: eth0
IF-MIB::ifDescr.3 = STRING: eth1
IF-MIB::ifDescr.4 = STRING: eth2
IF-MIB::ifDescr.5 = STRING: vlan1
IF-MIB::ifDescr.6 = STRING: vlan2
IF-MIB::ifDescr.7 = STRING: br0
What is what here? I dont really know. But doing an snmpwalk on the bytes in/out OID values (1.3.6.1.2.1.31.1.1.1.6, 1.3.6.1.2.1.31.1.1.1.10) showed me that eth0 has much higher download than any other, so I am assuming that eth0 is the internet (WAN) connection shared by all devices in the LAN. From some Googleing I assume that “br0” is probably the wireless interface. The others, I am less sure about. Although I guess eth1 and eth2 are two more of the wired ports, and vlan1 and vlan2 are probably the remaining two others. Maybe they are just in a special mode (IPTV?). So I tried monitoring the OID for “br0” for traffic. Which produced nice graphs going up. So maybe I was right.
The rest (memory, etc) was quite simple. Just SNMP query the OIDs for those, the seem to give the actual “real-time” values. I will not repeat that here. However, for anyone who needs more details, I have the code on github. It is commonly in flux (until I find another thing to play with), the docs are usually not fully up to date, blaabllaa.. but the general idea could probably be found by browsing the source code if nothing else..: https://github.com/mukatee/pypro
Finally, what would be an interesting experiment would be to iteratively increase the length of the polling interval for the raw metrics to see how high it should be set to match the ProcessorLoad or CPUPercentage SNMP OID metrics. This would give me the actual averaging interval for those.. Arrrrr…
Anyway, that is that for how far I got in setting up my router monitoring at a fine granularity for my performance test analysis. Next I should see if I can correlate this with any delays or errors in the actual performance test…
Мониторинг домашнего роутера
Время на прочтение
3 мин
Количество просмотров 235K

Знакома ли вам ситуация «инет никакой»?
Обычно попытка исправления подразумевает:
— обход членов семьи (ну да, я качаю новый сезон «Доктор Хаус». А кому это может мешать?)
— перезагрузить роутер (ну завис я, завис — сутками всякую дрянь качаете..)
— не качаются ли обновления (приятная новость — новый Acrobat Reader…)
— нет ли у нас блошек (нашему ботнету сегодня дали большое домашнее задание)
— звонок провайдеру (наш канал работает как часы с самого основания компании)
— эм. может еще раз роутер?
…
Все получится, если ваш роутер поддерживает протокол SNMP — специальный протокол для телеметрии сетевых устройств и приложений. Разбираемся по инструкции к роутеру или веб-интерфейсу, есть ли у вас поддержка SNMP. В некоторых случаях появляется при установке неофициальных прошивок. Ищем его в веб интерфейсе, включаем. Запоминаем, как называется community name — это пароль, по которому показания SNMP вашего роутера доступны в сети (по умолчанию обычно public).

Рис. 1. Здесь все просто. Или поддержка SNMP есть, или ее нет.
Чтобы не потерять много времени впустую, давайте сделаем экспресс-проверку. Скачиваем библиотеку NET-SNMP. Из директории bin выполняем команду:
snmpstatus -c public -v 1 192.168.1.1
public — пароль для доступа к SNMP (community name)
192.168.1.1 — ip адрес роутера
Если роутер отозвался сводкой информации о себе (OS, uptime, …), идем дальше.
Open Source решения для мониторинга:
- oss.oetiker.ch/mrtg
- cacti.net
- www.zabbix.com
- www.nagios.org
Я буду разбирать использование MRTG. Не лучшее юзабилити, зато самая простая установка. Нам ведь пока не надо мониторить тысячи устройств. MRTG — это набор скриптов, который сгенерирует html станицы и png картинки со статистикой по параметрам, которые вы мониторите.
Устанавливаем MRTG. На сайте подробное руководство по установке для UNIX и Windows. Для работы под Windows требуется PERL. Наиболее распространенный бесплатный дистрибутив PERL для Windows — это ActivePerl. Отдельной инструкции для Mac не сайте видел, однако поскольку MRTG — это не более чем программа на PERL, тоже должно работать.
Короткий путь начать мониторить траффик на сетевых интерфейсах роутера — это создать конфигурационный файл MRTG командой cfgmaker. Например, мой роутер ASUS WL-500g premium имеет 8 сетевых интерфейсов, и это позволяет видеть траффик со стороны провайдера, со стороны WiFi устройств (телефон и ноутбук), со стороны рабочей станции через Ethernet
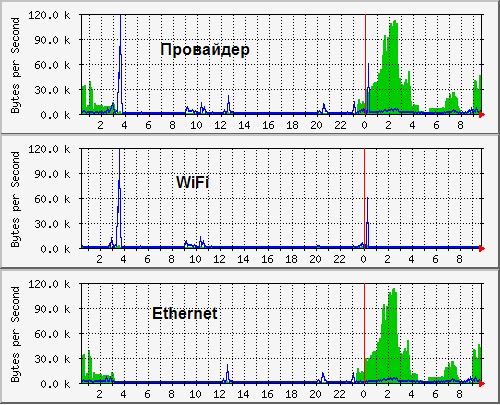
Рис. 2. Из сопоставления графиков на разных интерфейсах видно, откуда идет траффик.
Чуть сложнее мониторить нагрузку и использование памяти. Нужно иметь MIB спецификацию устройста. Если SNMP поддерживается официально, то она, скорее всего, есть на сайте производителя. Если это неофициальная прошивка, то, возможно, уже есть наработки у сообщества, которое сделало прошивку. Например, спецификация для ASUS WL-500g здесь. В моем случае OID для средней за 5 минут нагрузки на CPU .1.3.6.1.4.1.2021.10.1.5.2, используемая RAM .1.3.6.1.4.1.2021.4.6.0. При описании показаний нагрузки CPU и использования памяти в конфиге MRTG нужно с помощью опции gauge указать, что это текущие показания, а не интегральная величина, как для траффика, когда SNMP передает количество байт прошедшее через интерфейс с момента включения устройства (ну или обнуления счетчика, если долго работаем)
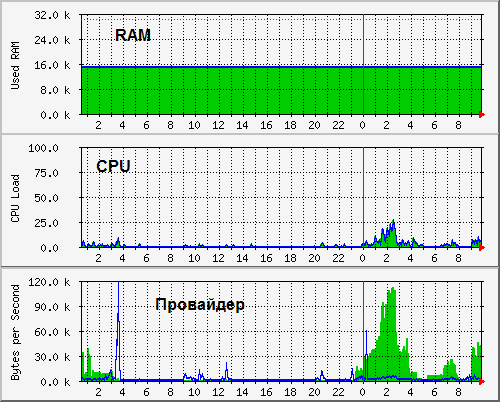
Рис. 3. Обычно нагрузка процессора на нуле. Она растет, когда качают несколько процессов на большой скорости. Используемая память меняется слабо.
Разумеется запускать mrtg вручную каждые 5 минут не нужно, а нужно создать задачу cron (Unix) пример:
*/5 * * * * root LANG=C LC_ALL=C /usr/bin/mrtg /etc/mrtg/mrtg.cfg --lock-file /var/lock/mrtg/mrtg_l --confcache-file /var/lib/mrtg/mrtg.ok
Если ставите mrtg из пакета, задача добавится сама.
или Sheduled Tasks (Windows) Пример:
Run: wperl mrtg --logging=eventlog mrtg.cfg

Start in: c:\httpd\htdocs\mrtg\bin
Возможно, возможности вашего роутера значительно шире, и вы можете получать значительно больше информации — МАС адреса клиентов, траффик по MAC адресам, и так далее. Да поможет вам Google!
P.S. Данная заметка, разумеется, не ориентирована на специалистов по сетевой инфраструктуре. Просто я совершенно случайно открыл для себя букавы SNMP и уверен, что не одинок в этом. Возможно, кому-то это поможет при выборе нового роутера.
В комментариях открыл для себя суперпрошивку DD-WRT. Теперь вот думаю…
Skip to content
Search code, repositories, users, issues, pull requests…
Provide feedback
Saved searches
Use saved searches to filter your results more quickly
Sign up
- Notifications
-
Fork
4
Name already in use
A tag already exists with the provided branch name. Many Git commands accept both tag and branch names, so creating this branch may cause unexpected behavior. Are you sure you want to create this branch?
1
branch
0
tags
Code
-
Use Git or checkout with SVN using the web URL.
-
Open with GitHub Desktop
-
Download ZIP
Latest commit
Files
Permalink
Failed to load latest commit information.
Type
Name
Latest commit message
Commit time
ASUS router metrics in Grafana (via SNMP)
Config files and scripts for pulling ASUS router metrics into TIG stack via SNMP.


The implementation takes advantage of SNMP Extend to pull additional metrics (not covered by MIBs) through custom commands, as well as a shell script to pull wireless client metrics (second image) and push the data directly into InfluxDB.
Tested with ASUS RT-AX86U running Asuswrt-Merlin v386.1_2.
Pre-requisites
- Asuswrt-Merlin firmware installed on the router.
- SNMP enabled on router. (Menu: Administration -> SNMP)
- JFFS custom scripts and configs enabled on router. (Menu: Administration -> System -> Persistent JFFS2 partition -> Enable JFFS custom scripts and configs)
- Awareness of how to configure user scripts and scheduled tasks on router.
- TIG stack deployed.
Contents
- Router SNMP config append file to define SNMP Extend
- SNMP Extend shell scripts for pulling the following metrics on the router:
- Connection count
- Active connection count
- Admin web session — source IP of active/last session
- Admin web session — timestamp (returns a value when someone is logged in)
- Internet connection status
- JFFS partition usage (%)
- Number of active SSH sessions
- Number of processes running
- Temperature — CPU
- Temperature — 2.4 GHz Wireless Module
- Temperature — 5 GHz Wireless Module
- Wireless client count — 2.4 GHz
- Wireless client count — 5 GHz
- Shell script for pulling wireless client metrics and pushing the data directly into InfluxDB (in-memory processing on router)
- Grafana dashboard config files (use Flux to query InfluxDB)
- Telegraf router SNMP config
Configuration notes
- Individual (per-metric) scripts are being used for SNMP Extend so as to avoid commands being run unnecessarily when the OIDs are being queried.
- The Telegraf config file I’ve based my config on is sourced from bretmlw. I’ve commented out everything that didn’t return results for me, as well as things that I’m not planning on using near-term. I’ve also added comments to a number of OIDs from their respective MIBs for (hopefully) improved clarity.
- The shell script for gathering wireless client metrics is based on mod_wifi_clients.sh from corgan2222’s excellent extstats add-on.