This week another new blog post related to Windows 10 MDM. In the recent weeks I’ve discussed policy refresh, some configurations and now some troubleshooting. This post is also triggered by my previous as I used the MDM Diagnostics Tool (MdmDiagnosticsTool.exe) as an example. Based on that example I’ve received some requests for more information. There are more useful tools like dsregcmd, but this post will focus on the MDM Diagnostics Tool, as there’s not that much information available. In this post I’ll provide information about the usage and results of the MDM Diagnostics Tool as having the right information is really useful for troubleshooting Windows 10 MDM managed devices.
Introduction of the MDM Diagnostics Tool
The MDM Diagnostics Tool is a command line tool that can be used to gather information. Information related to specific MDM areas. Depending on the chosen MDM area, the MDM Diagnostics Tool will gather the related events, registry, logs and more, all consolidated into a single folder or single file. The MDM Diagnostics Tool is one of the best starting points for the IT admin, for a consolidated source for troubleshooting.
Usage of the MDM Diagnostics Tool
The MDM Diagnostics Tool can has four different usage options. The first usage option is the generic option to output MDM diagnostics info only, to a given folder.
MdmDiagnosticsTool.exe -out <output folder path>The second usage option is to collect predefined area logs and to create a cab file with the results. The possible areas are available in the registry under: HKLM\SOFTWARE\Microsoft\MdmDiagnostics\Area. At this moment those areas are Autopilot, DeviceEnrollment, DeviceProvisioning and TPM (as shown below).

Figure 1: MDM diagnostics areas

MdmDiagnosticsTool.exe -area <area name(s)> -cab <output cab file path>The third usage option is to collect predefined area logs and to create a zip file with the results. The possible areas are the same as for the second usage option. Only the file type of the result is different.
MdmDiagnosticsTool.exe -area <area name(s)> -zip <output zip file path>The fourth usage option is to collect information specified in a XML-file and to create a zip file with the results. I haven’t found out (and not really looked at) how to construct a working XML-file for that option. To use the MDM Diagnostics Tool in combination with Microsoft Intune, have a look at my previous post.
MdmDiagnosticsTool.exe -xml <xml file of information to gather> -zip <output zip file path> -server <MDM Server to alert>Output of the MDM Diagnostics Tool
The output of the different usage options of the MDM Diagnostics Tool is also different. As usage option 2 and 3 contain the same information and I can’t really use option 4, let’s have a look at the output of option 1 and 2. Below is a quick overview of the output, followed by an explanation of the diagnostic data that is available in the output.

Figure 2: MDM Diagnostics – Autopilot Figure 3: MDM Diagnostics – Device enrollment Figure 4: MDM Diagnostics – Device provisioning Figure 5: MDM Diagnostics – TPM


Output of usage option 1
The first usage option provides the generic MDM diagnostics that contains the following information:
- DeviceManagement-Enterprise-Diagnostics-Provider.evtx – This event log contains the information (and errors) regarding the MDM sessions of the device. It also shows the MDM PolicyManager errors.
- MDMDiagReport.html (and related xml) – This is the same report that can be generated by using the Settings panel and generating the Advanced Diagnostics Report. That report shows the applied configuration states of the devices, including Policy CSP settings, certificates, configuration sources, and resource information.
- Microsoft-Windows-AAD.evtx – This event log contains information (and errors) related to Azure AD communications. From device registration until token requests.
- Microsoft-Windows-Shell-Core.evtx – This event log contains a lot of information mainly related to logon tasks and runonce actions on the device.
Output of usage option 2 (Autopilot)
The second usage option, with the Autopilot area specified, provides generic MDM diagnostics and specific Autopilot related diagnostics that contains the following information:
- AgentExecutor.log – This log file contains information about the PowerShell scripts that are executed by the Intune Management Extention.
- AutopilotConciergeFile.json – This json file contains the language and keyboard configuration information during a self deployment.
- AutopilotDDSZTDFile.json – This json file contains the configuration information during a regular deployment.
- ClientHealth.log – This log file contains the health information of the Intune Management Extention.
- DeviceHash_DESKTOP-U1JNF0E.csv – This csv file contains the device hash information of the device.
- DiagnosticLogCSP_Collector_Autopilot.etl – This event trace log file contains trace information of the Autopilot process of the device.
- DiagnosticLogCSP_Collector_DeviceEnrollment.etl – This event trace log file contains trace information of the device enrollment process of the device.
- DiagnosticLogCSP_Collector_DeviceProvisioning.etl – This event trace log file contains trace information of the device provisioning process of the device.
- IntuneManagementExtension.log – This log file contains information about the Win32 app deployments that are performed by the Intune Management Extension.
- LicensingDiag.cab (and related LicensingDiag_Output.txt) – These files contain licensing and diagnostic information.
- MDMDiagReport.html (and related xml) – This is the same report that can be generated by using the Settings panel and generating the Advanced Diagnostics Report. That report shows the applied configuration states of the devices, including Policy CSP settings, certificates, configuration sources, and resource information.
- MdmDiagReport_RegistryDump.reg – This registry file contains exported registry information related to Autopilot, but also related to the provisioning of the device and the policy manager. Basically everything related to MDM management.
- microsoft-windows-aad-operational.evtx – This event log contains operational information (and errors) related to Azure AD communications. From device registration until token requests.
- microsoft-windows-appxdeploymentserver-operational.evtx – This event log contains operational information (and errors) related to packaging, deploying, or querying app packages.
- microsoft-windows-assignedaccess-admin.evtx – This event log contains admin information (and errors) related to assigned access (kiosk mode).
- microsoft-windows-assignedaccessbroker-admin.evtx – This event log contains admin information (and errors) related to the broker of assigned access (kiosk mode).
- microsoft-windows-assignedaccessbroker-operational.evtx – This event log contains operational information (and errors) related to the broker of assigned access (kiosk mode).
- microsoft-windows-assignedaccess-operational.evtx – This event log contains operational information (and errors) related to assigned access (kiosk mode).
- microsoft-windows-devicemanagement-enterprise-diagnostics-provider-admin.evtx – This event log contains admin information (and errors) regarding the MDM sessions of the device.
- microsoft-windows-devicemanagement-enterprise-diagnostics-provider-debug.evtx – This event log contains debug information (and errors) regarding the MDM sessions of the device.
- microsoft-windows-devicemanagement-enterprise-diagnostics-provider-operational.evtx – This event log contains operational information (and errors) regarding the MDM sessions of the device.
- microsoft-windows-moderndeployment-diagnostics-provider-autopilot.evtx – This event log contains the operational information (and errors) regarding the Autopilot profile settings and OOBE flow of the device.
- microsoft-windows-moderndeployment-diagnostics-provider-managementservice.evtx – This event log contains the operational information (and errors) regarding the management service of the device.
- microsoft-windows-provisioning-diagnostics-provider-admin.evtx – This event log contains the admin information (and errors) regarding adding packages to the device.
- microsoft-windows-shell-core-operational.evtx – This event log contains a lot of information mainly related to logon tasks and runonce actions on the device.
- microsoft-windows-user device registration-admin.evtx – This event log contains admin information (and errors) regarding the device registration (status).
- setupact.log – This log file contains information about the errors that occur during the Windows installation process of the device.
- TpmHliInfo_Output.txt – This file contains information about the support of TPM 2.0 for the TPM of the device.
Output of usage option 2 (DeviceEnrollment)
The second usage option, with the DeviceEnrollment area specified, provides generic MDM diagnostics and specific device enrollment related diagnostics that contains the following information:
- DiagnosticLogCSP_Collector_DeviceEnrollment.etl – This event trace log file contains trace information of the device enrollment process of the device.
- MDMDiagHtmlReport.html (and related xml) – This is the same report that can be generated by using the Settings panel and generating the Advanced Diagnostics Report. That report shows the applied configuration states of the devices, including Policy CSP settings, certificates, configuration sources, and resource information.
- MdmDiagReport_RegistryDump.reg – This registry file contains exported registry information related to Autopilot, but also related to the provisioning of the device and the policy manager. Basically everything related to MDM management.
- microsoft-windows-aad-operational.evtx – This event log contains operational information (and errors) related to Azure AD communications. From device registration until token requests.
- microsoft-windows-appxdeploymentserver-operational.evtx – This event log contains operational information (and errors) related to packaging, deploying, or querying app packages.
- microsoft-windows-devicemanagement-enterprise-diagnostics-provider-admin.evtx – This event log contains admin information (and errors) regarding the MDM sessions of the device.
- microsoft-windows-devicemanagement-enterprise-diagnostics-provider-debug.evtx – This event log contains debug information (and errors) regarding the MDM sessions of the device.
- microsoft-windows-devicemanagement-enterprise-diagnostics-provider-operational.evtx – This event log contains operational information (and errors) regarding the MDM sessions of the device.
- microsoft-windows-moderndeployment-diagnostics-provider-managementservice.evtx – This event log contains the operational information (and errors) regarding the management service of the device.
- microsoft-windows-provisioning-diagnostics-provider-admin.evtx – This event log contains the admin information (and errors) regarding adding packages to the device.
Output of usage option 2 (DeviceProvisioning)
The second usage option, with the DeviceProvisiong area specified, provides generic MDM diagnostics and specific device provisioning related diagnostics that contains the following information:
- DiagnosticLogCSP_Collector_DeviceProvisioning.etl – This event trace log file contains trace information of the device provisioning process of the device.
- MDMDiagHtmlReport.html (and related xml) – This is the same report that can be generated by using the Settings panel and generating the Advanced Diagnostics Report. That report shows the applied configuration states of the devices, including Policy CSP settings, certificates, configuration sources, and resource information.
- MdmDiagReport_RegistryDump.reg – This registry file contains exported registry information related to Autopilot, but also related to the provisioning of the device and the policy manager. Basically everything related to MDM management.
- microsoft-windows-aad-operational.evtx – This event log contains operational information (and errors) related to Azure AD communications. From device registration until token requests.
- microsoft-windows-devicemanagement-enterprise-diagnostics-provider-admin.evtx – This event log contains admin information (and errors) regarding the MDM sessions of the device.
- microsoft-windows-provisioning-diagnostics-provider-admin.evtx – This event log contains the admin information (and errors) regarding adding packages to the device.
- microsoft-windows-shell-core-operational.evtx – This event log contains a lot of information mainly related to logon tasks and runonce actions on the device.
Output of usage option 2 (TPM)
The second usage option, with the TPM area specified, provides generic MDM diagnostics specific certificate and TPM related diagnostics that contains the following information:
- CertReq_enrollaik_Output.txt – This file contains information about an attempt to enroll an AIK key for the device.
- CertUtil_tpminfo_Output.txt – This file contains information about the TPM of the device.
- MDMDiagHtmlReport.html (and related xml) – This is the same report that can be generated by using the Settings panel and generating the Advanced Diagnostics Report. That report shows the applied configuration states of the devices, including Policy CSP settings, certificates, configuration sources, and resource information.
- MdmDiagReport_RegistryDump.reg – This registry file contains exported registry information related to Autopilot, but also related to the provisioning of the device and the policy manager. Basically everything related to MDM management.
More information
For more information related to troubleshooting Windows 10 MDM related issues, please refer to the following documentation:
- Diagnose MDM failures in Windows 10: https://docs.microsoft.com/en-us/windows/client-management/mdm/diagnose-mdm-failures-in-windows-10
- Troubleshooting Windows Autopilot: https://docs.microsoft.com/en-us/windows/deployment/windows-autopilot/troubleshooting
- Windows Performance Analyzer: https://docs.microsoft.com/en-us/windows-hardware/test/wpt/windows-performance-analyzer
This week another new blog post related to Windows 10 MDM. In the recent weeks I’ve discussed policy refresh, some configurations and now some troubleshooting. This post is also triggered by my previous as I used the MDM Diagnostics Tool (MdmDiagnosticsTool.exe) as an example. Based on that example I’ve received some requests for more information. There are more useful tools like dsregcmd, but this post will focus on the MDM Diagnostics Tool, as there’s not that much information available. In this post I’ll provide information about the usage and results of the MDM Diagnostics Tool as having the right information is really useful for troubleshooting Windows 10 MDM managed devices.
Introduction of the MDM Diagnostics Tool
The MDM Diagnostics Tool is a command line tool that can be used to gather information. Information related to specific MDM areas. Depending on the chosen MDM area, the MDM Diagnostics Tool will gather the related events, registry, logs and more, all consolidated into a single folder or single file. The MDM Diagnostics Tool is one of the best starting points for the IT admin, for a consolidated source for troubleshooting.
Usage of the MDM Diagnostics Tool
The MDM Diagnostics Tool can has four different usage options. The first usage option is the generic option to output MDM diagnostics info only, to a given folder.
MdmDiagnosticsTool.exe -out <output folder path>The second usage option is to collect predefined area logs and to create a cab file with the results. The possible areas are available in the registry under: HKLMSOFTWAREMicrosoftMdmDiagnosticsArea. At this moment those areas are Autopilot, DeviceEnrollment, DeviceProvisioning and TPM (as shown below).
Figure 1: MDM diagnostics areas
MdmDiagnosticsTool.exe -area <area name(s)> -cab <output cab file path>The third usage option is to collect predefined area logs and to create a zip file with the results. The possible areas are the same as for the second usage option. Only the file type of the result is different.
MdmDiagnosticsTool.exe -area <area name(s)> -zip <output zip file path>The fourth usage option is to collect information specified in a XML-file and to create a zip file with the results. I haven’t found out (and not really looked at) how to construct a working XML-file for that option. To use the MDM Diagnostics Tool in combination with Microsoft Intune, have a look at my previous post.
MdmDiagnosticsTool.exe -xml <xml file of information to gather> -zip <output zip file path> -server <MDM Server to alert>Output of the MDM Diagnostics Tool
The output of the different usage options of the MDM Diagnostics Tool is also different. As usage option 2 and 3 contain the same information and I can’t really use option 4, let’s have a look at the output of option 1 and 2. Below is a quick overview of the output, followed by an explanation of the diagnostic data that is available in the output.
Output of usage option 1
The first usage option provides the generic MDM diagnostics that contains the following information:
- DeviceManagement-Enterprise-Diagnostics-Provider.evtx – This event log contains the information (and errors) regarding the MDM sessions of the device. It also shows the MDM PolicyManager errors.
- MDMDiagReport.html (and related xml) – This is the same report that can be generated by using the Settings panel and generating the Advanced Diagnostics Report. That report shows the applied configuration states of the devices, including Policy CSP settings, certificates, configuration sources, and resource information.
- Microsoft-Windows-AAD.evtx – This event log contains information (and errors) related to Azure AD communications. From device registration until token requests.
- Microsoft-Windows-Shell-Core.evtx – This event log contains a lot of information mainly related to logon tasks and runonce actions on the device.
Output of usage option 2 (Autopilot)
The second usage option, with the Autopilot area specified, provides generic MDM diagnostics and specific Autopilot related diagnostics that contains the following information:
- AgentExecutor.log – This log file contains information about the PowerShell scripts that are executed by the Intune Management Extention.
- AutopilotConciergeFile.json – This json file contains the language and keyboard configuration information during a self deployment.
- AutopilotDDSZTDFile.json – This json file contains the configuration information during a regular deployment.
- ClientHealth.log – This log file contains the health information of the Intune Management Extention.
- DeviceHash_DESKTOP-U1JNF0E.csv – This csv file contains the device hash information of the device.
- DiagnosticLogCSP_Collector_Autopilot.etl – This event trace log file contains trace information of the Autopilot process of the device.
- DiagnosticLogCSP_Collector_DeviceEnrollment.etl – This event trace log file contains trace information of the device enrollment process of the device.
- DiagnosticLogCSP_Collector_DeviceProvisioning.etl – This event trace log file contains trace information of the device provisioning process of the device.
- IntuneManagementExtension.log – This log file contains information about the Win32 app deployments that are performed by the Intune Management Extension.
- LicensingDiag.cab (and related LicensingDiag_Output.txt) – These files contain licensing and diagnostic information.
- MDMDiagReport.html (and related xml) – This is the same report that can be generated by using the Settings panel and generating the Advanced Diagnostics Report. That report shows the applied configuration states of the devices, including Policy CSP settings, certificates, configuration sources, and resource information.
- MdmDiagReport_RegistryDump.reg – This registry file contains exported registry information related to Autopilot, but also related to the provisioning of the device and the policy manager. Basically everything related to MDM management.
- microsoft-windows-aad-operational.evtx – This event log contains operational information (and errors) related to Azure AD communications. From device registration until token requests.
- microsoft-windows-appxdeploymentserver-operational.evtx – This event log contains operational information (and errors) related to packaging, deploying, or querying app packages.
- microsoft-windows-assignedaccess-admin.evtx – This event log contains admin information (and errors) related to assigned access (kiosk mode).
- microsoft-windows-assignedaccessbroker-admin.evtx – This event log contains admin information (and errors) related to the broker of assigned access (kiosk mode).
- microsoft-windows-assignedaccessbroker-operational.evtx – This event log contains operational information (and errors) related to the broker of assigned access (kiosk mode).
- microsoft-windows-assignedaccess-operational.evtx – This event log contains operational information (and errors) related to assigned access (kiosk mode).
- microsoft-windows-devicemanagement-enterprise-diagnostics-provider-admin.evtx – This event log contains admin information (and errors) regarding the MDM sessions of the device.
- microsoft-windows-devicemanagement-enterprise-diagnostics-provider-debug.evtx – This event log contains debug information (and errors) regarding the MDM sessions of the device.
- microsoft-windows-devicemanagement-enterprise-diagnostics-provider-operational.evtx – This event log contains operational information (and errors) regarding the MDM sessions of the device.
- microsoft-windows-moderndeployment-diagnostics-provider-autopilot.evtx – This event log contains the operational information (and errors) regarding the Autopilot profile settings and OOBE flow of the device.
- microsoft-windows-moderndeployment-diagnostics-provider-managementservice.evtx – This event log contains the operational information (and errors) regarding the management service of the device.
- microsoft-windows-provisioning-diagnostics-provider-admin.evtx – This event log contains the admin information (and errors) regarding adding packages to the device.
- microsoft-windows-shell-core-operational.evtx – This event log contains a lot of information mainly related to logon tasks and runonce actions on the device.
- microsoft-windows-user device registration-admin.evtx – This event log contains admin information (and errors) regarding the device registration (status).
- setupact.log – This log file contains information about the errors that occur during the Windows installation process of the device.
- TpmHliInfo_Output.txt – This file contains information about the support of TPM 2.0 for the TPM of the device.
Output of usage option 2 (DeviceEnrollment)
The second usage option, with the DeviceEnrollment area specified, provides generic MDM diagnostics and specific device enrollment related diagnostics that contains the following information:
- DiagnosticLogCSP_Collector_DeviceEnrollment.etl – This event trace log file contains trace information of the device enrollment process of the device.
- MDMDiagHtmlReport.html (and related xml) – This is the same report that can be generated by using the Settings panel and generating the Advanced Diagnostics Report. That report shows the applied configuration states of the devices, including Policy CSP settings, certificates, configuration sources, and resource information.
- MdmDiagReport_RegistryDump.reg – This registry file contains exported registry information related to Autopilot, but also related to the provisioning of the device and the policy manager. Basically everything related to MDM management.
- microsoft-windows-aad-operational.evtx – This event log contains operational information (and errors) related to Azure AD communications. From device registration until token requests.
- microsoft-windows-appxdeploymentserver-operational.evtx – This event log contains operational information (and errors) related to packaging, deploying, or querying app packages.
- microsoft-windows-devicemanagement-enterprise-diagnostics-provider-admin.evtx – This event log contains admin information (and errors) regarding the MDM sessions of the device.
- microsoft-windows-devicemanagement-enterprise-diagnostics-provider-debug.evtx – This event log contains debug information (and errors) regarding the MDM sessions of the device.
- microsoft-windows-devicemanagement-enterprise-diagnostics-provider-operational.evtx – This event log contains operational information (and errors) regarding the MDM sessions of the device.
- microsoft-windows-moderndeployment-diagnostics-provider-managementservice.evtx – This event log contains the operational information (and errors) regarding the management service of the device.
- microsoft-windows-provisioning-diagnostics-provider-admin.evtx – This event log contains the admin information (and errors) regarding adding packages to the device.
Output of usage option 2 (DeviceProvisioning)
The second usage option, with the DeviceProvisiong area specified, provides generic MDM diagnostics and specific device provisioning related diagnostics that contains the following information:
- DiagnosticLogCSP_Collector_DeviceProvisioning.etl – This event trace log file contains trace information of the device provisioning process of the device.
- MDMDiagHtmlReport.html (and related xml) – This is the same report that can be generated by using the Settings panel and generating the Advanced Diagnostics Report. That report shows the applied configuration states of the devices, including Policy CSP settings, certificates, configuration sources, and resource information.
- MdmDiagReport_RegistryDump.reg – This registry file contains exported registry information related to Autopilot, but also related to the provisioning of the device and the policy manager. Basically everything related to MDM management.
- microsoft-windows-aad-operational.evtx – This event log contains operational information (and errors) related to Azure AD communications. From device registration until token requests.
- microsoft-windows-devicemanagement-enterprise-diagnostics-provider-admin.evtx – This event log contains admin information (and errors) regarding the MDM sessions of the device.
- microsoft-windows-provisioning-diagnostics-provider-admin.evtx – This event log contains the admin information (and errors) regarding adding packages to the device.
- microsoft-windows-shell-core-operational.evtx – This event log contains a lot of information mainly related to logon tasks and runonce actions on the device.
Output of usage option 2 (TPM)
The second usage option, with the TPM area specified, provides generic MDM diagnostics specific certificate and TPM related diagnostics that contains the following information:
- CertReq_enrollaik_Output.txt – This file contains information about an attempt to enroll an AIK key for the device.
- CertUtil_tpminfo_Output.txt – This file contains information about the TPM of the device.
- MDMDiagHtmlReport.html (and related xml) – This is the same report that can be generated by using the Settings panel and generating the Advanced Diagnostics Report. That report shows the applied configuration states of the devices, including Policy CSP settings, certificates, configuration sources, and resource information.
- MdmDiagReport_RegistryDump.reg – This registry file contains exported registry information related to Autopilot, but also related to the provisioning of the device and the policy manager. Basically everything related to MDM management.
More information
For more information related to troubleshooting Windows 10 MDM related issues, please refer to the following documentation:
- Diagnose MDM failures in Windows 10: https://docs.microsoft.com/en-us/windows/client-management/mdm/diagnose-mdm-failures-in-windows-10
- Troubleshooting Windows Autopilot: https://docs.microsoft.com/en-us/windows/deployment/windows-autopilot/troubleshooting
- Windows Performance Analyzer: https://docs.microsoft.com/en-us/windows-hardware/test/wpt/windows-performance-analyzer
Let’s check how to Troubleshoot Windows Autopilot Issues with MDM Diagnostics Tool Windows Autopilot Issues. Let’s discuss Windows MDM Diagnostics Tool benefits, usage, and examples in this post.
In my previous post, Windows Autopilot Troubleshooting basics, we discussed different troubleshooting areas like Network Activity, Registry, and Event Viewer.
[Related Posts – Windows Autopilot Step by Step Guides, Windows 10 Deployment Process Flow and Logs]
What is Windows MDM Diagnostics Tool?
MDM Diagnostics is a command-line tool that can collate Windows Autopilot related events. Most Windows Autopilot-related events, registries, and logs are consolidated into a single folder or single file.

This tool helps IT Admins focus on one consolidated source for troubleshooting.
What are the Benefits of the MDM Diagnostics Tool?
Let’s understand how to troubleshoot Windows Autopilot Issues with MDM Diagnostics Tool as the first step, then understand its benefits.
- Automatically collect predefined logs and save them as zipping or Cab files.
- Remote users to run the command and share the logs with IT to troubleshoot.
- Use the Pre or Post OOBE stage of Windows Autopilot.
How to Use MDM Diagnostics Tool
How to use the Windows MDM diagnostics tool? I recommend using the latest Windows 10 (1803 or later) version of the MDM Diagnostics tool. I have not tested the previous version of Windows 10 with this MDM diag tool.
Usage 1: Syntax: MdmDiagnosticsTool.exe -out < output folder path >

Example: MdmDiagnosticsTool.exe -out c:temp

Usage 2: Syntax: MdmDiagnosticsTool.exe -area <area name(s)> -cab <output cab file path>
Execute below command line to collect Windows autopilot related events from the system for troubleshooting.
Example: MdmDiagnosticsTool.exe -area Autopilot -cab C:LOGS.zip

3 (Three) Troubleshooting Areas of MDM Diagnostics Tool
THE Windows MDM Diagnostics tool can be used below 3 (three) troubleshooting areas to collect pre-defined areas and logs. But, in this post, we will focus only on Windows Autopilot.
- Autopilot
- DeviceProvisioning
- TPM
[Related Posts – Windows Autopilot Step by Step Guides, Windows 10 Deployment Process Flow and Logs]
The output of the MDM Diagnostics Tool
The diagnostics tool generates output in ZIP / CAB file format with the below files. We will go through each of the down output files and their purpose.

Deep Dive – Troubleshoot Windows Autopilot Issues with MDM Diagnostics Tool
You can understand more details about MDM Diagnostic tools in this section. Hopefully, the following troubleshooting steps will help you in Windows Autopilot deployment scenarios.
Event Viewer
MDM Diagnostics tool collects the below list of the event viewer. Event viewer includes client-side events like Autopilot events, policy actions, etc.
- Microsoft-windows-aad-operational
- devicemanagement-enterprise-diagnostics-provider
- microsoft-windows-assignedaccess-admin
- microsoft-windows-assignedaccess-operational
- microsoft-windows-moderndeployment-diagnostics-provider-autopilot
- microsoft-windows-provisioning-diagnostics-provider-admin
- microsoft-windows-shell-core-operational
- microsoft-windows-user device registration-admin
The below registry entries tells you a list of event viewer logs captured by the MDM Diagnostics tool.
ComputerHKEY_LOCAL_MACHINESOFTWAREMicrosoftMdmDiagnosticsAreaAutopilotEventViewerEntry

Diagnostic Logs – Autopilot and Device Provisioning
The below-listed ETL files are captured by the tool. What is ETL? It’s an Event tracing log created by Windows. This tool is used for in-depth analysis of the events.
The below ETL file will include system activity captured during Autopilot and Intune device provisioning stage.
- DiagnosticLogCSP_Collector_Autopilot.etl
- DiagnosticLogCSP_Collector_DeviceProvisioning.etl
ComputerHKEY_LOCAL_MACHINESOFTWAREMicrosoftMdmDiagnosticsAreaAutopilotFileEntry

You need to use the Windows performance analyzer tool to deep dive and analyze these ETL files.

CloudExperienceHostOobe Windows Autopilot logs
Where is the location of CloudExperienceHost? It is part of system apps within the c:windowssystemapps folder.
In Windows Autopilot deployment, the CloudExperienceHost process communicates with Azure.
To trace CloudExperienceHost process activity, MDM Diagnostics Tool generates Event Tracing Logs (ETW – Event Tracing for Windows). You can use a Windows performance analyzer to analyze the log, as shown below.

Setupact.log
This log file records actions or activity during the OOBE Phase of Autopilot.

Registry Dump
MdmDiagReport_RegistryDump.reg captures the HKLM and HKCU registry values associated with autopilot device provisioning.
Autopilot related
values are written to HKLMSOFTWAREMicrosoftProvisioningDiagnosticsAutoPilot
Intune CSP based configurations are written to HKEY_LOCAL_MACHINEsoftwaremicrosoftpolicymanager

MDMDiag Report
MDMDiagReport.xml report provides resultant Autopilot settings applied from Intune.

MDMDiagHtmlReport.html report provides complete details on the applied Intune Policy CSP Settings, certificates, applications, etc., on the autopilot device.

Resources
- Windows Autopilot Deployment Scenarios – On-Prem Hybrid Domain Join
- Step by Step Guide Windows AutoPilot Process with Intune
- Beginners Guide Setup Windows AutoPilot Deployment
- Windows Autopilot Video Starter Kit
Author
Vimal has more than ten years of experience in SCCM device management solutions. His main focus is on Device Management technologies like Microsoft Intune, ConfigMgr (SCCM), OS Deployment, and Patch Management. He writes about the technologies like SCCM, Windows 10, Microsoft Intune, and MDT.
| title | description | manager | ms.author | ms.prod | ms.localizationpriority | author | ms.topic | ms.technology | ms.collection | ms.date |
|---|---|---|---|---|---|---|---|---|---|---|
|
Deploy a Windows 10 image using MDT (Windows 10) |
This article will show you how to take your reference image for Windows 10, and deploy that image to your environment using the Microsoft Deployment Toolkit (MDT). |
aaroncz |
frankroj |
windows-client |
medium |
frankroj |
article |
itpro-deploy |
highpri, tier2 |
11/28/2022 |
Deploy a Windows 10 image using MDT
Applies to:
- Windows 10
This article will show you how to take your reference image for Windows 10 (that was created), and deploy that image to your environment using the Microsoft Deployment Toolkit (MDT).
We’ll prepare for this deployment by creating an MDT deployment share that is used solely for image deployment. Separating the processes of creating reference images from the processes used to deploy them in production allows greater control of on both processes. We’ll configure Active Directory permissions, configure the deployment share, create a new task sequence, and add applications, drivers, and rules.
For the purposes of this article, we’ll use four computers: DC01, MDT01, HV01 and PC0005.
- DC01 is a domain controller
- MDT01 is a domain member server
- HV01 is a Hyper-V server
- PC0005 is a blank device to which we’ll deploy Windows 10
MDT01 and PC0005 are members of the domain contoso.com for the fictitious Contoso Corporation. HV01 used to test deployment of PC0005 in a virtual environment.

[!NOTE]
For details about the setup for the procedures in this article, please see Prepare for deployment with MDT.
Step 1: Configure Active Directory permissions
These steps will show you how to configure an Active Directory account with the permissions required to deploy a Windows 10 machine to the domain using MDT. These steps assume you’ve The account is used for Windows Preinstallation Environment (Windows PE) to connect to MDT01. In order for MDT to join machines into the contoso.com domain you need to create an account and configure permissions in Active Directory.
On DC01:
-
Download the Set-OUPermissions.ps1 script and copy it to the C:SetupScripts directory on DC01. This script configures permissions to allow the MDT_JD account to manage computer accounts in the contoso > Computers organizational unit.
-
Create the MDT_JD service account by running the following command from an elevated Windows PowerShell prompt:
New-ADUser -Name MDT_JD -UserPrincipalName MDT_JD@contoso.com -path "OU=Service Accounts,OU=Accounts,OU=Contoso,DC=CONTOSO,DC=COM" -Description "MDT join domain account" -AccountPassword (ConvertTo-SecureString "pass@word1" -AsPlainText -Force) -ChangePasswordAtLogon $false -PasswordNeverExpires $true -Enabled $true
-
Next, run the Set-OuPermissions script to apply permissions to the MDT_JD service account, enabling it to manage computer accounts in the Contoso / Computers OU. Run the following commands from an elevated Windows PowerShell prompt:
Set-ExecutionPolicy -ExecutionPolicy RemoteSigned -Force
Set-Location C:SetupScripts
.Set-OUPermissions.ps1 -Account MDT_JD -TargetOU "OU=Workstations,OU=Computers,OU=Contoso"
The following list is of the permissions being granted:
- Scope: This object and all descendant objects
- Create Computer objects
- Delete Computer objects
- Scope: Descendant Computer objects
- Read All Properties
- Write All Properties
- Read Permissions
- Modify Permissions
- Change Password
- Reset Password
- Validated write to DNS host name
- Validated write to service principal name
Step 2: Set up the MDT production deployment share
Next, create a new MDT deployment share. You shouldn’t use the same deployment share that you used to create the reference image for a production deployment. Perform this procedure on the MDT01 server.
Create the MDT production deployment share
On MDT01:
The steps for creating the deployment share for production are the same as when you created the deployment share for creating the custom reference image:
-
Ensure you’re signed on as: contosoadministrator.
-
In the Deployment Workbench console, right-click Deployment Shares and select New Deployment Share.
-
On the Path page, in the Deployment share path text box, type D:MDTProduction and select Next.
-
On the Share page, in the Share name text box, type MDTProduction$ and select Next.
-
On the Descriptive Name page, in the Deployment share description text box, type MDT Production and select Next.
-
On the Options page, accept the default settings and select Next twice, and then select Finish.
-
Using File Explorer, verify that you can access the \MDT01MDTProduction$ share.
Configure permissions for the production deployment share
To read files in the deployment share, you need to assign NTFS and SMB permissions to the MDT Build Account (MDT_BA) for the D:MDTProduction folder
On MDT01:
-
Ensure you’re signed in as contosoadministrator.
-
Modify the NTFS permissions for the D:MDTProduction folder by running the following command in an elevated Windows PowerShell prompt:
icacls.exe "D:MDTProduction" /grant '"CONTOSOMDT_BA":(OI)(CI)(M)'
grant-smbshareaccess -Name MDTProduction$ -AccountName "ContosoMDT_BA" -AccessRight Full -force
Step 3: Add a custom image
The next step is to add a reference image into the deployment share with the setup files required to successfully deploy Windows 10. When adding a custom image, you still need to copy setup files (an option in the wizard) because Windows 10 stores other components in the SourcesSxS folder that is outside the image and may be required when installing components.
Add the Windows 10 Enterprise x64 RTM custom image
In these steps, we assume that you’ve completed the steps in the Create a Windows 10 reference image article, so you’ve a Windows 10 reference image at D:MDTBuildLabCapturesREFW10X64-001.wim on MDT01.
-
Using the Deployment Workbench, expand the Deployment Shares node, and then expand MDT Production; select the Operating Systems node, and create a folder named Windows 10.
-
Right-click the Windows 10 folder and select Import Operating System.
-
On the OS Type page, select Custom image file and select Next.
-
On the Image page, in the Source file text box, browse to D:MDTBuildLabCapturesREFW10X64-001.wim and select Next.
-
On the Setup page, select the Copy Windows 7, Windows Server 2008 R2, or later setup files from the specified path option; in the Setup source directory text box, browse to D:MDTBuildLabOperating SystemsW10EX64RTM and select Next.
-
On the Destination page, in the Destination directory name text box, type W10EX64RTM, select Next twice, and then select Finish.
-
After adding the operating system, double-click the added operating system name in the Operating Systems / Windows 10 node and change the name to Windows 10 Enterprise x64 RTM Custom Image.
[!NOTE]
The reason for adding the setup files has changed since earlier versions of MDT. MDT 2010 used the setup files to install Windows. MDT uses DISM to apply the image; however, you still need the setup files because some components in roles and features are stored outside the main image.

Step 4: Add an application
When you configure your MDT Build Lab deployment share, you can also add applications to the new deployment share before creating your task sequence. This section walks you through the process of adding an application to the MDT Production deployment share using Adobe Reader as an example.
Create the install: Adobe Reader DC
On MDT01:
-
Download the Enterprise distribution version of Adobe Acrobat Reader DC (AcroRdrDC2200320282_en_US.exe) to D:setupadobe on MDT01.
-
Extract the .exe file that you downloaded to a .msi (ex: .AcroRdrDC2200320282_en_US.exe -sfx_o»d:setupadobeinstall» -sfx_ne).
-
In the Deployment Workbench, expand the MDT Production node and navigate to the Applications node.
-
Right-click the Applications node, and create a new folder named Adobe.
-
In the Applications node, right-click the Adobe folder and select New Application.
-
On the Application Type page, select the Application with source files option and select Next.
-
On the Details page, in the Application Name text box, type Install — Adobe Reader and select Next*.
-
On the Source page, in the Source Directory text box, browse to D:setupadobeinstall and select Next.
-
On the Destination page, in the Specify the name of the directory that should be created text box, type Install — Adobe Reader and select Next.
-
On the Command Details page, in the Command Line text box, type msiexec /i AcroRead.msi /q, select Next twice, and then select Finish.

The Adobe Reader application added to the Deployment Workbench.

Step 5: Prepare the drivers repository
In order to deploy Windows 10 with MDT successfully, you need drivers for the boot images and for the actual operating system. This section will show you how to add drivers for the boot image and operating system, using the following hardware models as examples:
- Lenovo ThinkPad T420
- Dell Latitude 7390
- HP EliteBook 8560w
- Microsoft Surface Pro
For boot images, you need to have storage and network drivers; for the operating system, you need to have the full suite of drivers.
[!NOTE]
You should only add drivers to the Windows PE images if the default drivers don’t work. Adding drivers that are not necessary will only make the boot image larger and potentially delay the download time.
Create the driver source structure in the file system
The key to successful management of drivers for MDT, and for any other deployment solution, is to have a good driver repository. From this repository, you import drivers into MDT for deployment, but you should always maintain the repository for future use.
On MDT01:
[!IMPORTANT]
In the steps below, it’s critical that the folder names used for various computer makes and models exactly match the results of wmic computersystem get model,manufacturer on the target system.
-
Using File Explorer, create the D:drivers folder.
-
In the D:drivers folder, create the following folder structure:
- WinPE x86
- WinPE x64
- Windows 10 x64
-
In the new Windows 10 x64 folder, create the following folder structure:
- Dell Inc.
- Latitude E7450
- Hewlett-Packard
- HP EliteBook 8560w
- Lenovo
- ThinkStation P500 (30A6003TUS)
- Microsoft Corporation
- Surface Laptop
- Dell Inc.
[!NOTE]
Even if you’re not going to use both x86 and x64 boot images, we still recommend that you add the support structure for future use.
Create the logical driver structure in MDT
When you import drivers to the MDT driver repository, MDT creates a single instance folder structure based on driver class names. However, you can, and should, mimic the driver structure of your driver source repository in the Deployment Workbench. This mimic is done by creating logical folders in the Deployment Workbench.
-
On MDT01, using Deployment Workbench, select the Out-of-Box Drivers node.
-
In the Out-Of-Box Drivers node, create the following folder structure:
- WinPE x86
- WinPE x64
- Windows 10 x64
-
In the Windows 10 x64 folder, create the following folder structure:
- Dell Inc.
- Latitude E7450
- Hewlett-Packard
- HP EliteBook 8560w
- Lenovo
- 30A6003TUS
- Microsoft Corporation
- Surface Laptop
- Dell Inc.
The preceding folder names should match the actual make and model values that MDT reads from devices during deployment. You can find out the model values for your machines by using the following command in Windows PowerShell:
Get-WmiObject -Class:Win32_ComputerSystem
Or, you can use this command in a normal command prompt:
wmic.exe csproduct get name
If you want a more standardized naming convention, try the ModelAliasExit.vbs script from the Deployment Guys blog post, entitled Using and Extending Model Aliases for Hardware Specific Application Installation.

The Out-of-Box Drivers structure in the Deployment Workbench.
Create the selection profiles for boot image drivers
By default, MDT adds any storage and network drivers that you import to the boot images. However, you should add only the drivers that are necessary to the boot image. You can control which drivers are added by using selection profiles.
The drivers that are used for the boot images (Windows PE) are Windows 10 drivers. If you can’t locate Windows 10 drivers for your device, a Windows 7 or Windows 8.1 driver will most likely work, but Windows 10 drivers should be your first choice.
On MDT01:
-
In the Deployment Workbench, under the MDT Production node, expand the Advanced Configuration node, right-click the Selection Profiles node, and select New Selection Profile.
-
In the New Selection Profile Wizard, create a selection profile with the following settings:
- Selection Profile name: WinPE x86
- Folders: Select the WinPE x86 folder in Out-of-Box Drivers.
- Select Next, Next and Finish.
-
Right-click the Selection Profiles node again, and select New Selection Profile.
-
In the New Selection Profile Wizard, create a selection profile with the following settings:
- Selection Profile name: WinPE x64
- Folders: Select the WinPE x64 folder in Out-of-Box Drivers.
- Select Next, Next and Finish.
Creating the WinPE x64 selection profile.

Extract and import drivers for the x64 boot image
Windows PE supports all the hardware models that we have, but here you learn to add boot image drivers to accommodate any new hardware that might require more drivers. In this example, you add the latest Intel network drivers to the x64 boot image.
On MDT01:
-
Download PROWinx64.exe from Intel.com (ex: PROWinx64.exe).
-
Extract PROWinx64.exe to a temporary folder — in this example to the C:TmpProWinx64 folder.
[!NOTE]
Extracting the .exe file manually requires an extraction utility. You can also run the .exe and it will self-extract files to the %userprofile%AppDataLocalTempRarSFX0 directory. This directory is temporary and will be deleted when the .exe terminates. -
Using File Explorer, create the D:DriversWinPE x64Intel PRO1000 folder.
-
Copy the content of the C:TmpPROWinx64PRO1000Winx64NDIS64 folder to the D:DriversWinPE x64Intel PRO1000 folder.
-
In the Deployment Workbench, expand the MDT Production > Out-of-Box Drivers node, right-click the WinPE x64 node, and select Import Drivers, and use the following Driver source directory to import drivers: D:DriversWinPE x64Intel PRO1000.
Download, extract, and import drivers
For the Lenovo ThinkStation P500
For the ThinkStation P500 model, you use the Lenovo ThinkVantage Update Retriever software to download the drivers. With Update Retriever, you need to specify the correct Lenovo Machine Type for the actual hardware (the first four characters of the model name). As an example, the Lenovo ThinkStation P500 model has the 30A6003TUS model name, meaning the Machine Type is 30A6.

To get the updates, download the drivers from the Lenovo ThinkVantage Update Retriever using its export function. You can also download the drivers by searching PC Support on the Lenovo website.
In this example, we assume you’ve downloaded and extracted the drivers using ThinkVantage Update Retriever to the D:DriversLenovoThinkStation P500 (30A6003TUS) directory.
On MDT01:
-
In the Deployment Workbench, in the MDT Production > Out-Of-Box Drivers > Windows 10 x64 node, expand the Lenovo node.
-
Right-click the 30A6003TUS folder and select Import Drivers and use the following Driver source directory to import drivers:
D:DriversWindows 10 x64LenovoThinkStation P500 (30A6003TUS)
The folder you select and all subfolders will be checked for drivers, expanding any .cab files that are present and searching for drivers.
For the Latitude E7450
For the Dell Latitude E7450 model, you use the Dell Driver CAB file, which is accessible via the Dell TechCenter website.
In these steps, we assume you’ve downloaded and extracted the CAB file for the Latitude E7450 model to the D:DriversDell Inc.Latitude E7450 folder.
On MDT01:
-
In the Deployment Workbench, in the MDT Production > Out-Of-Box Drivers > Windows 10 x64 node, expand the Dell Inc. node.
-
Right-click the Latitude E7450 folder and select Import Drivers and use the following Driver source directory to import drivers:
D:DriversWindows 10 x64Dell Inc.Latitude E7450
For the HP EliteBook 8560w
For the HP EliteBook 8560w, you use HP Image Assistant to get the drivers. The HP Image Assistant can be accessed on the HP Support site.
In these steps, we assume you’ve downloaded and extracted the drivers for the HP EliteBook 8650w model to the D:DriversWindows 10 x64Hewlett-PackardHP EliteBook 8560w folder.
On MDT01:
-
In the Deployment Workbench, in the MDT Production > Out-Of-Box Drivers > Windows 10 x64 node, expand the Hewlett-Packard node.
-
Right-click the HP EliteBook 8560w folder and select Import Drivers and use the following Driver source directory to import drivers:
D:DriversWindows 10 x64Hewlett-PackardHP EliteBook 8560w
For the Microsoft Surface Laptop
For the Microsoft Surface Laptop model, you find the drivers on the Microsoft website. In these steps, we assume you’ve downloaded and extracted the Surface Laptop drivers to the D:DriversWindows 10 x64MicrosoftSurface Laptop folder.
On MDT01:
-
In the Deployment Workbench, in the MDT Production > Out-Of-Box Drivers > Windows 10 x64 node, expand the Microsoft node.
-
Right-click the Surface Laptop folder and select Import Drivers; and use the following Driver source directory to import drivers:
D:DriversWindows 10 x64MicrosoftSurface Laptop
Step 6: Create the deployment task sequence
This section will show you how to create the task sequence used to deploy your production Windows 10 reference image. You’ll then configure the task sequence to enable patching via a Windows Server Update Services (WSUS) server.
Create a task sequence for Windows 10 Enterprise
On MDT01:
-
In the Deployment Workbench, under the MDT Production node, right-click Task Sequences, and create a folder named Windows 10.
-
Right-click the new Windows 10 folder and select New Task Sequence. Use the following settings for the New Task Sequence Wizard:
- Task sequence ID: W10-X64-001
- Task sequence name: Windows 10 Enterprise x64 RTM Custom Image
- Task sequence comments: Production Image
- Template: Standard Client Task Sequence
- Select OS: Windows 10 Enterprise x64 RTM Custom Image
- Specify Product Key: Don’t specify a product key at this time
- Full Name: Contoso
- Organization: Contoso
- Internet Explorer home page:
https://www.contoso.com - Admin Password: Don’t specify an Administrator Password at this time
Edit the Windows 10 task sequence
-
Continuing from the previous procedure, right-click the Windows 10 Enterprise x64 RTM Custom Image task sequence, and select Properties.
-
On the Task Sequence tab, configure the Windows 10 Enterprise x64 RTM Custom Image task sequence with the following settings:
-
Preinstall: After the Enable BitLocker (Offline) action, add a Set Task Sequence Variable action with the following settings:
- Name: Set DriverGroup001
- Task Sequence Variable: DriverGroup001
- Value: Windows 10 x64%Make%%Model%
-
Configure the Inject Drivers action with the following settings:
-
Choose a selection profile: Nothing
-
Install all drivers from the selection profile
[!NOTE]
The configuration above indicates that MDT should only use drivers from the folder specified by the DriverGroup001 property, which is defined by the «Choose a selection profile: Nothing» setting, and that MDT shouldn’t use plug and play to determine which drivers to copy, which is defined by the «Install all drivers from the selection profile» setting.
-
-
State Restore. Enable the Windows Update (Pre-Application Installation) action.
-
State Restore. Enable the Windows Update (Post-Application Installation) action.
-
-
Select OK.
The task sequence for production deployment.

Step 7: Configure the MDT production deployment share
In this section, you’ll learn how to configure the MDT Build Lab deployment share with the rules required to create a dynamic deployment process. This configuration includes commonly used rules and an explanation of how these rules work.
Configure the rules
[!NOTE]
The following instructions assume the device is online. If you’re offline you can remove SLShare variable.
On MDT01:
-
Right-click the MDT Production deployment share and select Properties.
-
Select the Rules tab and replace the existing rules with the following information (modify the domain name, WSUS server, and administrative credentials to match your environment):
[Settings]
Priority=Default

[Default]
_SMSTSORGNAME=Contoso
OSInstall=YES
UserDataLocation=AUTO
TimeZoneName=Pacific Standard Time
AdminPassword=pass@word1
JoinDomain=contoso.com
DomainAdmin=CONTOSOMDT_JD
DomainAdminPassword=pass@word1
MachineObjectOU=OU=Workstations,OU=Computers,OU=Contoso,DC=contoso,DC=com
SLShare=\MDT01Logs$
ScanStateArgs=/ue:** /ui:CONTOSO*
USMTMigFiles001=MigApp.xml
USMTMigFiles002=MigUser.xml
HideShell=YES
ApplyGPOPack=NO
WSUSServer=mdt01.contoso.com:8530
SkipAppsOnUpgrade=NO
SkipAdminPassword=YES
SkipProductKey=YES
SkipComputerName=NO
SkipDomainMembership=YES
SkipUserData=YES
SkipLocaleSelection=YES
SkipTaskSequence=NO
SkipTimeZone=YES
SkipApplications=NO
SkipBitLocker=YES
SkipSummary=YES
SkipCapture=YES
SkipFinalSummary=NO
-
Select Edit Bootstrap.ini and modify using the following information:
[Settings]
Priority=Default

[Default]
DeployRoot=\MDT01MDTProduction$
UserDomain=CONTOSO
UserID=MDT_BA
UserPassword=pass@word1
SkipBDDWelcome=YES
-
On the Windows PE tab, in the Platform drop-down list, make sure x86 is selected.
-
On the General sub tab (still under the main Windows PE tab), configure the following settings:
In the Lite Touch Boot Image Settings area:
- Image description: MDT Production x86
- ISO file name: MDT Production x86.iso
[!NOTE]
Because you’re going to use Pre-Boot Execution Environment (PXE) later to deploy the machines, you don’t need the ISO file; however, we recommend creating ISO files because they’re useful when troubleshooting deployments and for quick tests.
-
On the Drivers and Patches sub tab, select the WinPE x86 selection profile and select the Include all drivers from the selection profile option.
-
On the Windows PE tab, in the Platform drop-down list, select x64.
-
On the General sub tab, configure the following settings:
In the Lite Touch Boot Image Settings area:
- Image description: MDT Production x64
- ISO file name: MDT Production x64.iso
-
In the Drivers and Patches sub tab, select the WinPE x64 selection profile and select the Include all drivers from the selection profile option.
-
In the Monitoring tab, select the Enable monitoring for this deployment share check box.
-
Select OK.
[!NOTE]
It will take a while for the Deployment Workbench to create the monitoring database and web service.The Windows PE tab for the x64 boot image.

The rules explained
The rules for the MDT Production deployment share are different from those rules for the MDT Build Lab deployment share. The biggest differences are that you deploy the machines into a domain instead of a workgroup.
You can optionally remove the UserID and UserPassword entries from Bootstrap.ini so that users performing PXE boot are prompted to provide credentials with permission to connect to the deployment share. Setting SkipBDDWelcome=NO enables the welcome screen that displays options to run the deployment wizard, run DaRT tools (if installed), exit to a Windows PE command prompt, set the keyboard layout, or configure a static IP address. In this example, we’re skipping the welcome screen and providing credentials.
The Bootstrap.ini file
This file is the MDT Production Bootstrap.ini:
[Settings]
Priority=Default

[Default]
DeployRoot=\MDT01MDTProduction$
UserDomain=CONTOSO
UserID=MDT_BA
UserPassword=pass@word1
SkipBDDWelcome=YES
The CustomSettings.ini file
This file is the CustomSettings.ini file with the new join domain information:
[Settings]
Priority=Default

[Default]
_SMSTSORGNAME=Contoso
OSInstall=Y
UserDataLocation=AUTO
TimeZoneName=Pacific Standard Time
AdminPassword=pass@word1
JoinDomain=contoso.com
DomainAdmin=CONTOSOMDT_JD
DomainAdminPassword=pass@word1
MachineObjectOU=OU=Workstations,OU=Computers,OU=Contoso,DC=contoso,DC=com
SLShare=\MDT01Logs$
ScanStateArgs=/ue:** /ui:CONTOSO*
USMTMigFiles001=MigApp.xml
USMTMigFiles002=MigUser.xml
HideShell=YES
ApplyGPOPack=NO
WSUSServer=http://mdt01.contoso.com:8530
SkipAppsOnUpgrade=NO
SkipAdminPassword=YES
SkipProductKey=YES
SkipComputerName=NO
SkipDomainMembership=YES
SkipUserData=YES
SkipLocaleSelection=YES
SkipTaskSequence=NO
SkipTimeZone=YES
SkipApplications=NO
SkipBitLocker=YES
SkipSummary=YES
SkipCapture=YES
SkipFinalSummary=NO
EventService=http://MDT01:9800
Some properties to use in the MDT Production rules file are as follows:
- JoinDomain. The domain to join.
- DomainAdmin. The account to use when joining the machine to the domain.
- DomainAdminDomain. The domain for the join domain account.
- DomainAdminPassword. The password for the join domain account.
- MachineObjectOU. The organizational unit (OU) to which to add the computer account.
- ScanStateArgs. Arguments for the User State Migration Tool (USMT) ScanState command.
- USMTMigFiles(*). List of USMT templates (controlling what to back up and restore).
- EventService. Activates logging information to the MDT monitoring web service.
[!NOTE]
For more information about localization support, see the following articles:
- MDT sample guide
- LCID (Locale ID) codes
Optional deployment share configuration
If your organization has a Microsoft Software Assurance agreement, you also can subscribe to another Microsoft Desktop Optimization Package (MDOP) license (at an extra cost). Included in MDOP is Microsoft Diagnostics and Recovery Toolkit (DaRT), which contains tools that can help you troubleshoot MDT deployments, and troubleshoot Windows itself.
Add DaRT 10 to the boot images
If you’ve licensing for MDOP and DaRT, you can add DaRT to the boot images using the steps in this section. If you don’t have DaRT licensing, or don’t want to use it, skip to the next section, Update the Deployment Share. To enable the remote connection feature in MDT, you need to do the following steps:
[!NOTE]
DaRT 10 is part of MDOP 2015.MDOP might be available as a download from your Visual Studio subscription. When searching, be sure to look for Desktop Optimization Pack.
On MDT01:
-
Download MDOP 2015 and copy the DaRT 10 installer file to the D:SetupDaRT 10 folder on MDT01 (DaRTDaRT 10Installers<lang>x64MSDaRT100.msi).
-
Install DaRT 10 (MSDaRT10.msi) using the default settings.
-
Copy the two tools CAB files from C:Program FilesMicrosoft DaRTv10 (Toolsx86.cab and Toolsx64.cab) to the production deployment share at D:MDTProductionToolsx86 and D:MDTProductionToolsx64, respectively.
-
In the Deployment Workbench, right-click the MDT Production deployment share and select Properties.
-
On the Windows PE tab, in the Platform drop-down list, make sure x86 is selected.
-
On the Features sub tab, select the Microsoft Diagnostics and Recovery Toolkit (DaRT) checkbox.
Selecting the DaRT 10 feature in the deployment share. -
In the Windows PE tab, in the Platform drop-down list, select x64.
-
In the Features sub tab, in addition to the default selected feature pack, select the Microsoft Diagnostics and Recovery Toolkit (DaRT) check box.
-
Select OK.


Update the deployment share
Like the MDT Build Lab deployment share, the MDT Production deployment share needs to be updated after it has been configured. This update-process is the one during which the Windows PE boot images are created.
-
Right-click the MDT Production deployment share and select Update Deployment Share.
-
Use the default options for the Update Deployment Share Wizard.
[!NOTE]
The update process will take 5 to 10 minutes.
Step 8: Deploy the Windows 10 client image
These steps will walk you through the process of using task sequences to deploy Windows 10 images through a fully automated process. First, you need to add the boot image to Windows Deployment Services (WDS) and then start the deployment. In contrast with deploying images from the MDT Build Lab deployment share, we recommend using the Pre-Installation Execution Environment (PXE) to start the full deployments in the datacenter, even though you technically can use an ISO/CD or USB to start the process.
Configure Windows Deployment Services
You need to add the MDT Production Lite Touch x64 Boot image to WDS in preparation for the deployment. In this procedure, we assume that WDS is already installed and initialized on MDT01 as described in the Prepare for Windows deployment article.
On MDT01:
-
Open the Windows Deployment Services console, expand the Servers node and then expand MDT01.contoso.com.
-
Right-click Boot Images and select Add Boot Image.
-
Browse to the D:MDTProductionBootLiteTouchPE_x64.wim file and add the image with the default settings.
The boot image added to the WDS console.

Deploy the Windows 10 client
At this point, you should have a solution ready for deploying the Windows 10 client. We recommend starting by trying a few deployments at a time until you’re confident that your configuration works as expected. We find it useful to try some initial tests on virtual machines before testing on physical hardware. These tests help rule out hardware issues when testing or troubleshooting. Here are the steps to deploy your Windows 10 image to a virtual machine:
On HV01:
-
Create a virtual machine with the following settings:
- Name: PC0005
- Store the virtual machine in a different location: C:VM
- Generation: 2
- Memory: 2048 MB
- Network: Must be able to connect to MDT01MDTProduction$
- Hard disk: 60 GB (dynamic disk)
- Installation Options: Install an operating system from a network-based installation server
-
Start the PC0005 virtual machine, and press Enter to start the PXE boot. The VM will now load the Windows PE boot image from the WDS server.
The initial PXE boot process of PC0005. -
After Windows PE has booted, complete the Windows Deployment Wizard using the following setting:
- Select a task sequence to execute on this computer: Windows 10 Enterprise x64 RTM Custom Image
- Computer Name: PC0005
- Applications: Select the Install — Adobe Reader checkbox.
-
Setup now begins and does the following steps:
- Installs the Windows 10 Enterprise operating system.
- Installs the added application.
- Updates the operating system via your local Windows Server Update Services (WSUS) server.


Application installation
Following OS installation, Microsoft Office 365 Pro Plus — x64 is installed automatically.

Use the MDT monitoring feature
Since you’ve enabled the monitoring on the MDT Production deployment share, you can follow your deployment of PC0005 via the monitoring node.
On MDT01:
-
In the Deployment Workbench, expand the MDT Production deployment share folder.
-
Select the Monitoring node, and wait until you see PC0005.
-
Double-click PC0005, and review the information.
The Monitoring node, showing the deployment progress of PC0005.

Use information in the Event Viewer
When monitoring is enabled, MDT also writes information to the event viewer on MDT01. This information can be used to trigger notifications via scheduled tasks when deployment is completed. For example, you can configure scheduled tasks to send an email when a certain event is created in the event log.

The Event Viewer showing a successful deployment of PC0005.
Multicast deployments
Multicast deployment allows for image deployment with reduced network load during simultaneous deployments. Multicast is a useful operating system deployment feature in MDT deployments, however it’s important to ensure that your network supports it and is designed for it. If you’ve a limited number of simultaneous deployments, you probably don’t need to enable multicast.
Requirements
Multicast requires that Windows Deployment Services (WDS) is running on Windows Server 2008 or later. In addition to the core MDT setup for multicast, the network needs to be configured to support multicast. In general, this configuration means involvement of the organization networking team to ensure that Internet Group Management Protocol (IGMP) snooping is turned on and that the network is designed for multicast traffic. The multicast solution uses IGMPv3.
Set up MDT for multicast
Setting up MDT for multicast is straightforward. You enable multicast on the deployment share, and MDT takes care of the rest.
On MDT01:
-
In the Deployment Workbench, right-click the MDT Production deployment share folder and select Properties.
-
On the General tab, select the Enable multicast for this deployment share (requires Windows Server 2008 R2 Windows Deployment Services) check box, and select OK.
-
Right-click the MDT Production deployment share folder and select Update Deployment Share.
-
After updating the deployment share, use the Windows Deployment Services console to, verify that the multicast namespace was created.
The newly created multicast namespace.

Use offline media to deploy Windows 10
In addition to network-based deployments, MDT supports the use of offline media-based deployments of Windows 10. You can easily generate an offline version of your deployment share — either the full deployment share or a subset of it — by using selection profiles. The generated offline media can be burned to a DVD or copied to a USB stick for deployment.
Offline media are useful not only when you don’t have network connectivity to the deployment share, but also when you’ve limited connection to the deployment share and don’t want to copy 5 GB of data over the wire. Offline media can still join the domain, but you save the transfer of operating system images, drivers, and applications over the wire.
Create the offline media selection profile
To filter what is being added to the media, you create a selection profile. When creating selection profiles, you quickly realize the benefits of having created a good logical folder structure in the Deployment Workbench.
On MDT01:
-
In the Deployment Workbench, under the MDT Production / Advanced Configuration node, right-click Selection Profiles, and select New Selection Profile.
-
Use the following settings for the New Selection Profile Wizard:
-
General Settings
- Selection profile name: Windows 10 Offline Media
-
Folders
- Applications / Adobe
- Operating Systems / Windows 10
- Out-Of-Box Drivers / WinPE x64
- Out-Of-Box Drivers / Windows 10 x64
- Task Sequences / Windows 10
-

Create the offline media
In these steps, you generate offline media from the MDT Production deployment share. To filter what is being added to the media, you use the previously created selection profile.
-
On MDT01, using File Explorer, create the D:MDTOfflineMedia folder.
[!NOTE]
When creating offline media, you need to create the target folder first. It’s crucial that you don’t create a subfolder inside the deployment share folder because it will break the offline media. -
In the Deployment Workbench, under the MDT Production / Advanced Configuration node, right-click the Media node, and select New Media.
-
Use the following settings for the New Media Wizard:
- General Settings
- Media path: D:MDTOfflineMedia
- Selection profile: Windows 10 Offline Media
- General Settings
Configure the offline media
Offline media has its own rules, its own Bootstrap.ini and CustomSettings.ini files. These files are stored in the Control folder of the offline media; they also can be accessed via properties of the offline media in the Deployment Workbench.
On MDT01:
-
Copy the CustomSettings.ini file from the D:MDTProductionControl folder to D:MDTOfflineMediaContentDeployControl. Overwrite the existing files.
-
In the Deployment Workbench, under the MDT Production / Advanced Configuration / Media node, right-click the MEDIA001 media, and select Properties.
-
In the General tab, configure the following:
- Clear the Generate x86 boot image check box.
- ISO file name: Windows 10 Offline Media.iso
-
On the Windows PE tab, in the Platform drop-down list, select x64.
-
On the General sub tab, configure the following settings:
- In the Lite Touch Boot Image Settings area:
- Image description: MDT Production x64
- In the Windows PE Customizations area, set the Scratch space size to 128.
- In the Lite Touch Boot Image Settings area:
-
On the Drivers and Patches sub tab, select the WinPE x64 selection profile and select the Include all drivers from the selection profile option.
-
Select OK.
Generate the offline media
You’ve now configured the offline media deployment share, however the share hasn’t yet been populated with the files required for deployment. Now everything is ready you populate the deployment share content folder and generate the offline media ISO.
On MDT01:
-
In the Deployment Workbench, navigate to the MDT Production / Advanced Configuration / Media node.
-
Right-click the MEDIA001 media, and select Update Media Content. The Update Media Content process now generates the offline media in the D:MDTOfflineMediaContent folder. The process might require several minutes.
Create a bootable USB stick
The ISO that you got when updating the offline media item can be burned to a DVD and used directly (it will be bootable), but it’s often more efficient to use USB sticks instead since they’re faster and can hold more data. (A dual-layer DVD is limited to 8.5 GB.)
[!TIP]
In this example, the .wim file is 5.5 GB in size. However, bootable USB sticks are formatted with the FAT32 file system which limits file size to 4.0 GB. You can place the image on a different drive (ex: E:DeployOperating SystemsW10EX64RTMREFW10X64-001.swm) and then modify E:DeployControlOperatingSystems.xml to point to it. Alternatively to keep using the USB you must split the .wim file, which can be done using DISM:
Dism.exe /Split-Image /ImageFile:D:MDTOfflinemediaContentDeployOperating SystemsW10EX64RTMREFW10X64-001.wim /SWMFile:E:sourcesinstall.swm /FileSize:3800.Windows Setup automatically installs from this file, provided you name it install.swm. The file names for the next files include numbers, for example: install2.swm, install3.swm.
To enable split image in MDT, the Settings.xml file in your deployment share (ex: D:MDTProductionControlSettings.xml) must have the SkipWimSplit value set to False. By default this value is set to True (
<SkipWimSplit>True</SkipWimSplit>), so this must be changed and the offline media content updated.
Follow these steps to create a bootable USB stick from the offline media content:
-
On a physical machine running Windows 7 or later, insert the USB stick you want to use.
-
Copy the content of the MDTOfflineMediaContent folder to the root of the USB stick.
-
Start an elevated command prompt (run as Administrator), and start the Diskpart utility by typing Diskpart and pressing Enter.
-
In the Diskpart utility, you can type list volume (or the shorter list vol) to list the volumes, but you only need to remember the drive letter of the USB stick to which you copied the content. In our example, the USB stick had the drive letter F.
-
In the Diskpart utility, type select volume F (replace F with your USB stick drive letter).
-
In the Diskpart utility, type active, and then type exit.
Unified Extensible Firmware Interface (UEFI)-based deployments
As referenced in Windows 10 deployment scenarios and tools, Unified Extensible Firmware Interface (UEFI)-based deployments are becoming more common. In fact, when you create a generation 2 virtual machine in Hyper-V, you get a UEFI-based computer. During deployment, MDT automatically detects that you’ve an UEFI-based machine and creates the partitions UEFI requires. You don’t need to update or change your task sequences in any way to accommodate UEFI.

The partitions when deploying an UEFI-based machine.
Related articles
- Get started with the Microsoft Deployment Toolkit (MDT)
- Create a Windows 10 reference image
- Build a distributed environment for Windows 10 deployment
- Refresh a Windows 7 computer with Windows 10
- Replace a Windows 7 computer with a Windows 10 computer
- Configure MDT settings
Такие проблемы Microsoft-Windows-DeviceManagement-Enterprise-Diagnostics-Provider%4Admin.evtx обычно вызваны повреждением файла, связанного с Windows, или, в некоторых случаях, его случайным или намеренным удалением. Как правило, решить проблему можно заменой файла EVTX. В качестве дополнительного шага по устранению неполадок мы настоятельно рекомендуем очистить все пути к неверным файлам и ссылки на расширения файлов EVTX, которые могут способствовать возникновению такого рода ошибок, связанных с Microsoft-Windows-DeviceManagement-Enterprise-Diagnostics-Provider%4Admin.evtx.
Microsoft-Windows-DeviceManagement-Enterprise-Diagnostics-Provider%4Admin.evtx для %%os%% и почти для всех версий операционной системы Windows можно скачать ниже. Если в настоящее время необходимая вам версия Microsoft-Windows-DeviceManagement-Enterprise-Diagnostics-Provider%4Admin.evtx недоступна для загрузки, вы можете запросить её копию, нажав на кнопку Request (Запрос) ниже. Кроме того, Microsoft также может предоставить вам некоторые редкие файлы, которые отсутствуют в нашем каталоге.
После успешного размещения файла в соответствующем месте на жёстком диске подобных проблем, связанных с Microsoft-Windows-DeviceManagement-Enterprise-Diagnostics-Provider%4Admin.evtx, больше возникать не должно. Настоятельно рекомендуем выполнить быструю проверку. Мы рекомендуем повторно запустить Windows для проверки того, возникает ли проблема.
| Microsoft-Windows-DeviceManagement-Enterprise-Diagnostics-Provider%4Admin.evtx Описание файла | |
|---|---|
| File: | EVTX |
| Софт: | Windows |
| Версия программного обеспечения: | 10 |
| Разработчик программного обеспечения: | Microsoft |
| File: | Microsoft-Windows-DeviceManagement-Enterprise-Diagnostics-Provider%4Admin.evtx (Загрузить) |
| Размер (в байтах): | 69632 |
| Базовый файл ОС: | Windows 10 |
Продукт Solvusoft
Загрузка
WinThruster 2023 — Сканировать ваш компьютер на наличие ошибок реестра в Microsoft-Windows-DeviceManagement-Enterprise-Diagnostics-Provider%4Admin.evtx
Windows
11/10/8/7/Vista/XP
Установить необязательные продукты — WinThruster (Solvusoft) | Лицензия | Политика защиты личных сведений | Условия | Удаление
EVTX
Microsoft-Windows-DeviceManagement-Enterprise-Diagnostics-Provider%4Admin.evtx
Идентификатор статьи: 136478
Microsoft-Windows-DeviceManagement-Enterprise-Diagnostics-Provider%4Admin.evtx
| Имя файла | MD5 | Размер файла | Загрузить | |||||||||||||||||
|---|---|---|---|---|---|---|---|---|---|---|---|---|---|---|---|---|---|---|---|---|
| + Microsoft-Windows-DeviceManagement-Enterprise-Diagnostics-Provider%4Admin.evtx | 90895a819073482246034e1e98a1a9f0 | 68.00 KB | ||||||||||||||||||
|
Распространенные сообщения об ошибках в Microsoft-Windows-DeviceManagement-Enterprise-Diagnostics-Provider%4Admin.evtx
Проблемы, возникающие с Microsoft-Windows-DeviceManagement-Enterprise-Diagnostics-Provider%4Admin.evtx и Windows, включают:
- «Ошибка: Microsoft-Windows-DeviceManagement-Enterprise-Diagnostics-Provider%4Admin.evtx. «
- «Microsoft-Windows-DeviceManagement-Enterprise-Diagnostics-Provider%4Admin.evtx перемещен или отсутствует. «
- «Microsoft-Windows-DeviceManagement-Enterprise-Diagnostics-Provider%4Admin.evtx не найден.»
- «Не удалось загрузить Microsoft-Windows-DeviceManagement-Enterprise-Diagnostics-Provider%4Admin.evtx.»
- «Не удалось зарегистрироваться: Microsoft-Windows-DeviceManagement-Enterprise-Diagnostics-Provider%4Admin.evtx. «
- «Ошибка Microsoft-Windows-DeviceManagement-Enterprise-Diagnostics-Provider%4Admin.evtx во время выполнения. «
- «Microsoft-Windows-DeviceManagement-Enterprise-Diagnostics-Provider%4Admin.evtx не может загрузиться. «
Обычно ошибки Microsoft-Windows-DeviceManagement-Enterprise-Diagnostics-Provider%4Admin.evtx с Windows возникают во время запуска или завершения работы, в то время как приложения, связанные с Microsoft-Windows-DeviceManagement-Enterprise-Diagnostics-Provider%4Admin.evtx, выполняются, или редко во время последовательности обновления ОС. Документирование случаев ошибок Microsoft-Windows-DeviceManagement-Enterprise-Diagnostics-Provider%4Admin.evtx является ключевым для определения причины проблемы и сообщения о них Microsoft для исправлений.
Источники проблем Microsoft-Windows-DeviceManagement-Enterprise-Diagnostics-Provider%4Admin.evtx
Большинство проблем Microsoft-Windows-DeviceManagement-Enterprise-Diagnostics-Provider%4Admin.evtx связаны с отсутствующим или поврежденным Microsoft-Windows-DeviceManagement-Enterprise-Diagnostics-Provider%4Admin.evtx, вирусной инфекцией или недействительными записями реестра Windows, связанными с Windows.
В частности, проблемы Microsoft-Windows-DeviceManagement-Enterprise-Diagnostics-Provider%4Admin.evtx, созданные:
- Недопустимый раздел реестра Microsoft-Windows-DeviceManagement-Enterprise-Diagnostics-Provider%4Admin.evtx (или поврежденный).
- Вирус или вредоносное ПО поврежден Microsoft-Windows-DeviceManagement-Enterprise-Diagnostics-Provider%4Admin.evtx.
- Другая программа (не связанная с Windows) удалила Microsoft-Windows-DeviceManagement-Enterprise-Diagnostics-Provider%4Admin.evtx злонамеренно или по ошибке.
- Другая программа, конфликтующая с Microsoft-Windows-DeviceManagement-Enterprise-Diagnostics-Provider%4Admin.evtx или другой общей ссылкой Windows.
- Некомплектная установка приложения, связанного с Microsoft-Windows-DeviceManagement-Enterprise-Diagnostics-Provider%4Admin.evtx, или поврежденная загрузка.

Microsoft Deployment Toolkit (MDT) is a unified collection of tools, processes, and guidance for automating desktop and server deployment. And this in turn reduces deployment time and standardizes desktop and server image deployment. MDT builds on top of the core deployment tools in the Windows Assessment and Deployment Kit (Windows ADK). Its additional guidance and features are designed to reduce the complexity and time required for deployment in an enterprise environment. For more information on the differences between ADK, MDT, Microsoft Endpoint Configuration Manager (SCCM), Intune, Autopilot, and WSUS, how to create a capture image on Windows Deployment Services, Windows Deployment Services: WDSUTIL CommandLine Options on Windows Server 2019. In this article, you will learn how to install “ADK|WinPE|MDT: Deploy Windows with WDS”.
Windows Assessment and Deployment Kit (Windows ADK) is a collection of tools that you can use to customize, assess, and deploy Windows operating systems to new computers. To learn more about the various Windows 10 deployment scenarios and tools, see the following link. See the following guide on how to enable Bitlocker via the Local Group Policy Editor and the Group Policy Management Console. In order to customize Windows, you would need to install ADK|WinPE|MDT: Deploy Windows with WDS.
For some other articles, I have written WDS, see the following guides: No bootable media found system halted: Unable to PXE boot WDS to Virtualbox, WDS/DHCP scenarios: How to configure DHCP Server option 60, 66 and 67 for Windows Deployment Services, Uninstall WDS: How to remove Windows Deployment Services role via the GUI and PowerShell, What happens when WDS and DNS is installed on the same server: DNS issues with WDS, and how does WDS work: How to configure Windows Deployment Services on Windows Server 2019.
ADK|WinPE|MDT: Deploy Windows with WDS
In the below section, you shall learn how to install “ADK|WinPE|MDT: Deploy Windows with WDS”.
Step 1 – Install Windows Assessment and Deployment Kit
Kindly ensure the following tools below are being downloaded. Download and install Windows Assessment and Deployment Kit (Windows ADK) on your WDS server. Double-click on the executable as shown below. For Windows Assessment and Deployment Kit (Windows ADK) for Windows 10 or Windows 11. Here is a related guide: Windows Deployment Services (How to boot (deploy) operating systems images through the network).
Note: When you wish to reinstall a new (updated) ADK, an old ADK must be uninstalled before installing a new one (If this is not uninstalled, you will get an error). With this, you will lose some configuration if you have a custom environmentNote: If you have no Windows ADK installed previously, please download and continue the installation as shown below. You can use the Assessment and Deployment Kit for Windows to install Windows 11 and Windows Server 2022.

This will open the Windows Assessment and Deployment Kit -Windows 10 Window. Select the location to install Windows ADK into. I will leave it to the default path selected.
If you wish to choose a different install path, please use the Browse button to have this done. Click on Next when you are done.

This will Open up the Windows Kits Privacy window as shown below. I do not want to send Microsoft any data usage, because of this, I will select No and then click on Next

Accept the License Agreement as shown below

This will open the “Select the feature you want to install”. Uncheck the features that are not relevant to you as shown below, and click on Install

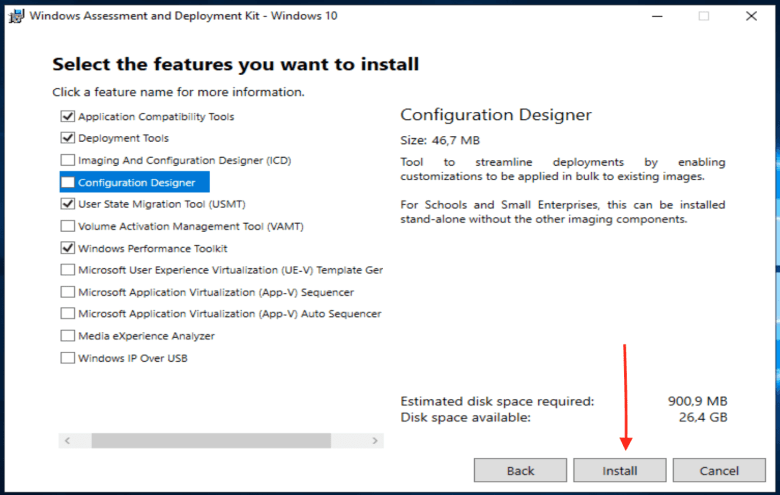
This will continue with the installation of the features we have selected with its progress bar as shown below.

Once the process is completed as shown below, click on close.

Step 2: Install the WinPE add-on for ADK
WinPE is an add-on to the Windows Assessment and Deployment Kit (ADK). You can download the ADK and WinPE add-ons. Install the ADK and the WinPE add-ons to start working with WinPE. As we can see in the Windows ADK installation above, the Windows PE environment was not included. To do this, we will have to Download the Windows PE add-on for the MDT server.
Note: If you have previously installed the WindowsPE (Windows ADK Addon), please uninstall and reinstall, else the error below will be prompted. When the uninstallation is complete, please proceed with the reinstallation.
Note: The installation steps are similar to step 1 above. Double-click on the installer as shown below. If you have previously installed WinPE (ADK Addon), please download and install it.

This will open the Windows Assessment and Deployment Kit Windows Preinstallation Environment Addons window. Click on Next (But if you wish to install this in a different path, click on Browse and choose your desired path)

On the Windows Kits Privacy (For me, I have decided not to send Microsoft anonymous usage data). Click on Next to proceed

Accept the License Agreement

On the Select your features Windows, you have just one Feature to select and it is the WinPE. Click on Install

This will start the Installation of the WinPE as shown below.

The installation process is complete as you can see below. The Windows PE add-on is successfully installed

Optional - Not needed for this scenario: For some custom environments where you have to customize the Windows image using a different drive such as "D:", you may need to copy the DISM variables (C:Program Files (x86)Windows Kits10Assessment and Deployment KitDeployment Toolsamd64DISM) to this drive D:wdsDISM11). Afterward, you will have to create an environment variable for this pointing to the D:wdsDISM11.Step 3: Download and Install Microsoft Deployment Toolkit
Next, download the Microsoft Deployment Toolkit (MDT). I will be installing MDT 64bits as shown below. Click on Next to continue the download.

Now the MDT setup file has been downloaded. Double-click on the .msi to continue the installation as shown below

This will open the Microsoft Deployment Tool Kit as shown below. Click on Next

Accept the License and click on next.
Note: Without accepting the licensing, you cannot proceed.
On the Custom Setup, simply click on Next

– On the Customer Experience Improvement Program interface, select No and click on Next
– If you wish, you can tick “Yes” here! it’s absolutely up to you.

– On the next window, Click on install. This will ensure Microsoft Deployment Toolkit (MDT) is installed on your device.

When the installation process is completed, click on Finish

Now, you have successfully deployed the first part of this task. “ADK|WinPE|MDT: Deploy Windows with WDS”. In the following section below, we will be deploying Windows.
Step – Create a Deployment Workbench
Let’s configure the Microsoft Deployment Toolkit (MDT). Launch the Deployment Workbench as shown below

After the Microsoft Deployment Toolkit (MDT) application is launched. Right-click on Deployment Shares in the left navigation and select New Deployment Share

Note: If your environment requires special rights, it is recommended to create a folder (directory) first before connecting to it. Since it is not so for us, I will proceed with the creating of the Deployment Shares.This will open the New Deployment Share Wizard as shown below. If you wish to change the deployment share path, please use the browse button as shown below

On the Share wizard, enter the share name.
- Verify the name of the share is the same as the name entered in the path above. (By default the name is DeploymentShare$), I will leave it the same way
- Then click Next

Change the Deployment share description or leave the default. I will leave this way since this is a lab environment. Click on next.

On the Options window, I will uncheck all the boxes except “Ask to set the local Administrators password”.
Note: If your environment requires other input, please check them
-Click on Next

On the Summary Windows, review this and click on Next

Next, the shares will be created as you can see below.

From the confirmation window, click on finish. The Deployment Share was completed successfully and MDT has been configured successfully.
– Now Click on Finish.

Before proceeding with the next steps, ensure you have attached the ISO image for your version of OS.
– or me, it is Windows 10 (ISO image or DVD).
Step 5: Import the Operating System
On the Deployment Workbench console. Right-click on the Operating System Folder and click Import Operating System


On the OS Type wizard, click on “Full Set of source files” and then click Next

Type the drive letter where the ISO is located. Use the Browse button to locate the path to the ISO.
- For me it is “F:”
- Click on Next.


Enter a destination directory name and click Next

Review the summary page and click on Next

This will continue the importing of the OS files. On the Confirmation page, click on Finish as shown below

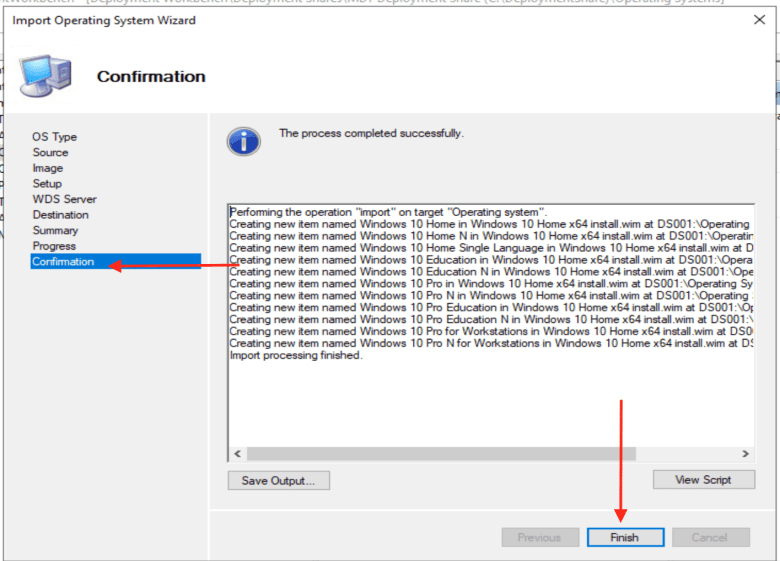
From the screenshot below, the Operating System have been successfully imported.

Step 6: Let’s add an Application. Right-click the application node.


– On the Application type, select the application with source files

On the details page, you will be asked to enter information about the application being added. Other fields occupy important information only when the name of the application is required, which can be beneficial when troubleshooting applications on the road are installed.
I will add zip in the window below

I have entered the following information as shown below

Now browse the location to provide a source folder for import into the MDT folder. I have selected the download path as the location to store these files.


Specify the name of the Directory that should be created. Please modify the name to suit your need.

For more information on how to install an application silently, also see here. However, the command line box will not be populated automatically and must be manually entered for the application to work quietly.
Enter the name of the executable installation file and if any/all switches are needed to obtain a silent installation, click next to continue.
msiexec /i 7z1900-x64.exe /qr
Review the summary page as shown below to know what will be imported into MDT and click on Next

This will work through the import as shown below

On the confirmation page, click on Finish as shown below.

From the screenshot below, the Application has been successfully imported.

Step 7: Let’s create a Task sequence
On the Deployment Workbench console, right-click Task Sequence and then click on New Task Sequence


On the General settings page, enter the following information below. You can enter numbers or words but I have decided to use “Win10Pro“

On the Select Template wizard, – Select the Standard Client Task Sequence and click on Next


Select the Operating System from the list which is you imported and click on Next.

On the Specify Product Key window, select “Do not specify a product key at this time” and click on Next

On the OS Settings page, enter the following information. If you have an internet homepage, enter it here and then click on Next

On the Admin Password window, select “Do not specify an Administrator password at this time“, and click on Next

Check Summary and Click on Next

On the confirmation window, click on Finish.

As we can see below, the task sequence has been created successfully.

Step 8: Configure MDT rules, Windows PE, and Monitoring
This step is very important if you do not want to do a lot of manual configuration later.
Right-click MDT Deployment Share and then
Click on Properties
On the MDT Deployment Share window. Click on the Rules tab and then key in the rules you want (Change the Deployment share Rule or leave the default).
I will leave the default, Please do not do this in production in order to automate the whole process speedily. Click on OK


Note: If you modified the files, click edit the Bootstrap.ini files and save it. Also, change the Deployment share Windows PE Settings or leave the default.
Note: If you leave the MDT Deployment Share rule as default, you will have to do a lot of manual input. See step 11 for more info of the kind of work I had to do. You do not want to do this. Below is a sample of a rule file, use this file to speed up the process.
[Settings]
Priority=Default
Properties=MyCustomProperty
[Default]
OSInstall=Y
UserID=Administrator
UserDomain=NewHelpTech.lk
UserPassword=Pa$$w0rd
SkipBDDWelcome=YES
SkipDeploymentType=YES
SkipDomainMembership=NO
SkipApplications=NO
SkipSummary=YES
SkipUserData=YES
SkipComputerName=NO
SkipTaskSequence=NO
SkipLocaleSelection=YES
SkipTimeZone=YES
SkipAppsOnUpgrade=YES
SkipAdminPassword=YES
SkipProductKey=YES
SkipComputerBackup=YES
SkipBitLocker=YES
SkipCapture=YES
SkipFinalSummary=YES
– Click on apply if you made any modification in order to proceed to the next tab
– Also, if you wish to enable Monitoring, Click on the “Monitoring tab”
– Enable it by checking the box
– And click on ok


Step 9: Update the Deployment Share
To update the deployment share, follow the following steps. Right-click MDT Deployment Share, and then click on Update Deployment Share will create a Windows 10 LiteTouchPE_x64.wim file

On the Options window, click on Optimize the boot image updating process, and then click on Next

On the summary page, click on Next. Click on Next.

As we can see, the deployment Share Settings update process step will continue. Note: This process takes a while.


Now, from the output below, the Deployment Share has been successfully updated.
– Click on Finish

Step 10: After updating the Deployment Share folder, a LiteTouch WIM file will be created. These files will be located under the boot folder in the Deployment Share you created.

To Add the Lite-Touch Images to WDS, follow the steps below
- On the WDS-SERVER, open Windows Deployment Services (WDS),
- Right-click on the Boot Images and then
- Click on Add Boot Image, for similar steps, Please click on this link.
This will open the Add Image Wizard as shown below. Click on Browse, select the LiteTouch file under the Boot file folder on the Deployment Share as shown below


On the Add Image File wizard, verify the image name and description and click on Next

On the Summary box, click Next.

The image below shows the progress of adding the LiteTouch image to WDS. When the operation is completed, click on Finish.
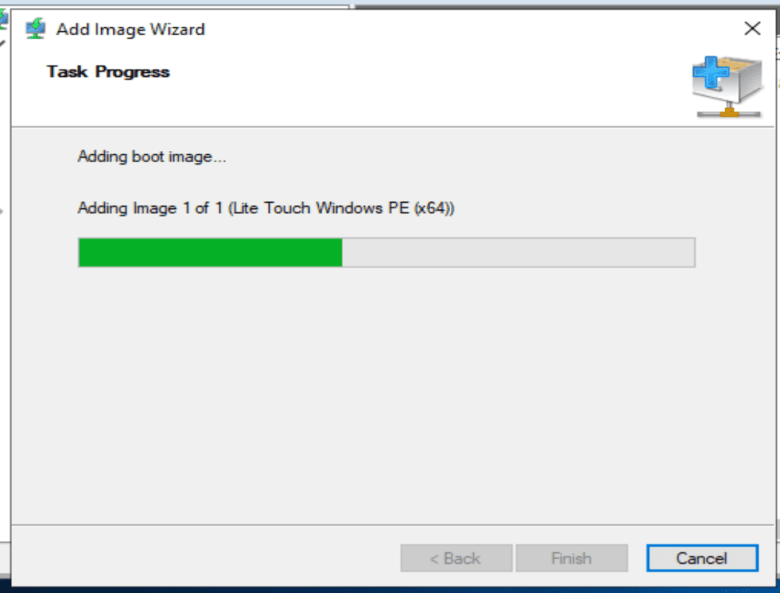

Upon clicking on Finish, the LiteTouch.wim can be seen added to the WDS as shown below

Step 11: Deploy Windows using MDT
Note: When the client establishes a connection to the WDS server (PXE Server), you will need to press the F12 key (on legacy BIOS devices), or hit the Enter key on newer UEFI-based devices to confirm the connection.
If you are using Oracle VirtualBox, you may encounter an error: “No bootable media found system halted: Unable to PXE boot WDS to Virtualbox, see this article for a fix“.
After the server is started, you may get the below windows if you have multiple Operating systems. click on Enter to continue

The device will start loading files via network as shown below.


Loading the MDT wizard

The device should pop up to the MDT window as shown below

On the MDT Welcome screen as shown below. Click Run the Deployment Wizard to install a new Operating System, and select the Keyboard layout and on this page. You can also configure the started IP Address

If you do not want to see the following steps below when installing the OS, but only Windows 10 installation, ensure to configure the rules in step 8 correctly.Enter the WDS Credentials to connect WDS and MDT Server (Network Shares).


Select Windows10 Pro and click on enter.
– Note: The name you entered for your task sequence will be listed here

If you have configured Active Directory in your environment, select join this domain as domain and enter the information as shown below or else select join a workgroup.

In the next window, I have decided to select Do not move user data and settings

If you want to restore the data, enter the path of the data restores. Me, I do not want to restore the data

Select your language and time as shown below, then click on Next

Select the application (7Zip in my case) you uploaded and would like to install and click on Next.

Enter Administrator Password and click on next.

Click on Begin to start OS deployment as shown below.

As we can see below, the Window Deployment has started with MDT.


This actually completes the steps, the steps below are just the process MDT goes through to have Windows 10 installed o your device.


Now, Windows 10 is completed as shown below. You have completed the task to install “ADK|WinPE|MDT: Deploy Windows with WDS”.

If you ever wish to modify the Deployment Share rule, follow the steps below
– Right-click on the Deployment Share you created.
– Select Properties and the MDT Deployment Share properties window will open up.
– Click on the Rules menu and populate them with the following information as shown below. Also, ensure to edit the Bootstrap.ini file and save it finally click on OK.
After updating the Deployment Share folder, a LiteTouch WIM file will be created. These files will be located under the boot folder in the Deployment Share you created.

- Remember to add this new image to WDS!!! 
Now I ran the OS deployment again, and it was pretty very fast without having to enter those annoying deployment details as seen in step 11 above.


I hope you found this blog post helpful. Now to have learned how to install “ADK|WinPE|MDT: Deploy Windows with WDS”. If you have any questions, please let me know in the comment session.
In Windows 10 1709 – Creators Update Fall, Microsoft has made it much easier to troubleshoot what policies, application an more – this is done in the new “MDM Diagnostic Information” both in overview and in Advanced Diagnostic Report.
This is one of the greatest news in Windows 10 1709 seen from a modern management perspective in my opinion. It is more detailed then it has been in the previous versions of Windows 10, and the Advanced Diagnostic Report is being formatted so it is readable by default – where in previous versions of Windows 10 we need to converted from XML into HTML.
It can be found in the settings app:
Press Windows + I to start the settings App – click on Accounts

Click on Access work or School

Click on Connected to “Your Organisation” and click Info

The “Managed by…” is divided into 3 sections
The first section is Device sync status:
Under “Last Attempted Sync:” you can see if the last sync with the MDM backend was successful or if it has failed. You can also see when the last sync was attempted.
There is a Sync button that the end-user can sync there Windows 10 device with Intune – the sync button is also in the Intune Company Portal under settings. A MDM managed devices does not need the Company Portal to be managed.

The second section is Areas managed by…:
This section is divided up into 2 – policies where you can see what areas of policies that are set on the device from Intune

And a Applications where you can see what applications that are installed on the device from Intune, both MSI installations and Windows Apps.

In the last section you can see Connection info.
You also have the possibility to create a Advanced Diagnostic Report by clicking “Creat Report”

Click Export

Windows will then create MDMDiagReport.html in C:UsersPublicDocumentsMDMDiagnostics

The MDMDiagReport.html is divided up to sections:
- Device info
- Connection info
- Device Management Account
- Certificates
- Enrolled configuration sources and target resources
- Managed policies

Device info, Connection info and Device Management Account is overview information on the devices and MDM system information

At the Enrolled configuration sources and target resources section you can see Windows Hallo for Business settings from Intune

You can also see the applications that are installed per device or user

In the managed policies section, you can see the CSP policies that are set on the devices.
Here is a full list of CSP policies that can be set on a Windows 10 device Full list of Windows 10 CSP policies

In the list you can also see the default value for the CSP settings and what the settigns is changed into with Intune.

It is still possible to get a detailed log on setting set from the MDM system in the Windows Event Log – it can be found here:
Applications and Services Logs – Microsoft – Windows – DeviceManagement-Enterprise-Diagnostics-Provider

Windows 10: Microsoft-Windows-ModernDeployment-Diagnostics-Provider/ManagementService
Discus and support Microsoft-Windows-ModernDeployment-Diagnostics-Provider/ManagementService in Windows 10 Software and Apps to solve the problem; I have mane error:Autopilot.dll WIL. HRESULT: 0x80070491Файл: onecoreuap\admin\moderndeployment\autopilot\dll\dllmain.cpp, строка 185Сообщение: NULLI…
Discussion in ‘Windows 10 Software and Apps’ started by Daniil Dashkevich, Jun 11, 2023.
-
Microsoft-Windows-ModernDeployment-Diagnostics-Provider/ManagementService
I have mane error:Autopilot.dll WIL. HRESULT: 0x80070491Файл: onecoreuap\admin\moderndeployment\autopilot\dll\dllmain.cpp, строка 185Сообщение: NULLI wouldn’t ask the question if it was just a mistake. But I have constant friezes in games. It is impossible to play.
-
Event Viewer Errors: Autopilot.dll WIL error was reported; Event ID: 1010; Source: Microsoft-Windows-ModernDeployment-Diagnostics-Provider
Lots of continuing event viewer errors.
Autopilot.dll WIL error was reported;
Event ID: 1010;
Source: Microsoft-Windows-ModernDeployment-Diagnostics-Provider
Brand new HP computer running Windows Home 11 v21H2 OS 22000.832
What causes these errors?
How do I stop them?
What is Autopilot?
I have home computer, Windows is installed, and I don’t think I need further «deployment» or «provisioning».
-
event 1010 ModernDeployment-Diagnostics-Provider Як виправити ?
Please tell me how to solve this problem. For a long time now, an error appears in the event every minute. I’ve tried everything, but nothing helped. I can’t fix it. Can you help me with this?
Autopilot.dll WIL.
HRESULT: 0x80070491
Файл: onecoreuap\admin\moderndeployment\autopilot\dll\dllmain.cpp, строка 191
Сообщение: NULL
-
Microsoft-Windows-ModernDeployment-Diagnostics-Provider/ManagementService
Windows 10 infinite restart black screen
The tutorials provided are just a list of troubleshooting steps. Use only the steps which apply to you.
Since none of the troubleshooting steps here worked, I’d suggest you do a Clean install.
John
Microsoft-Windows-ModernDeployment-Diagnostics-Provider/ManagementService
-
Microsoft-Windows-ModernDeployment-Diagnostics-Provider/ManagementService — Similar Threads — Microsoft ModernDeployment Diagnostics
-
Microsoft-Windows-ModernDeployment-Diagnostics-Pro vider/ManagementService
in Windows 10 BSOD Crashes and Debugging
Microsoft-Windows-ModernDeployment-Diagnostics-Pro vider/ManagementService: I have mane error:Autopilot.dll WIL. HRESULT: 0x80070491Файл: onecoreuap\admin\moderndeployment\autopilot\dll\dllmain.cpp, строка 185Сообщение: NULLI wouldn’t ask the question if it was just a mistake. But I have constant friezes in games. It is impossible to play…. -
Microsoft-Windows-ModernDeployment-Diagnostics-Pro vider/ManagementService
in Windows 10 Gaming
Microsoft-Windows-ModernDeployment-Diagnostics-Pro vider/ManagementService: I have mane error:Autopilot.dll WIL. HRESULT: 0x80070491Файл: onecoreuap\admin\moderndeployment\autopilot\dll\dllmain.cpp, строка 185Сообщение: NULLI wouldn’t ask the question if it was just a mistake. But I have constant friezes in games. It is impossible to play…. -
event 1010 ModernDeployment-Diagnostics-Provider Як виправити ?
in Windows 10 Gaming
event 1010 ModernDeployment-Diagnostics-Provider Як виправити ?: Please tell me how to solve this problem. For a long time now, an error appears in the event every minute. I’ve tried everything, but nothing helped. I can’t fix it. Can you help me with this?Autopilot.dll WIL. HRESULT: 0x80070491Файл:… -
event 1010 ModernDeployment-Diagnostics-Provider Як виправити ?
in Windows 10 Software and Apps
event 1010 ModernDeployment-Diagnostics-Provider Як виправити ?: Please tell me how to solve this problem. For a long time now, an error appears in the event every minute. I’ve tried everything, but nothing helped. I can’t fix it. Can you help me with this?Autopilot.dll WIL. HRESULT: 0x80070491Файл:… -
event 1010 ModernDeployment-Diagnostics-Provider Як виправити ?
in Windows 10 BSOD Crashes and Debugging
event 1010 ModernDeployment-Diagnostics-Provider Як виправити ?: Please tell me how to solve this problem. For a long time now, an error appears in the event every minute. I’ve tried everything, but nothing helped. I can’t fix it. Can you help me with this?Autopilot.dll WIL. HRESULT: 0x80070491Файл:… -
Event 2545 «Microsoft-Windows-DeviceManagement-Enterprise-Dia gnostics-Provider»
in Windows 10 Gaming
Event 2545 «Microsoft-Windows-DeviceManagement-Enterprise-Dia gnostics-Provider»: Hello all! I was wondering if anyone else has noticed Event 2545 errors concerning Microsoft-Windows-DeviceManagement-Enterprise-Diagnostics-Provider in your Event Log. I have been getting them since installing the last cumulative updates KB4023057, KB5018482 and KB5018202 on… -
Event 2545 «Microsoft-Windows-DeviceManagement-Enterprise-Dia gnostics-Provider»
in Windows 10 Software and Apps
Event 2545 «Microsoft-Windows-DeviceManagement-Enterprise-Dia gnostics-Provider»: Hello all! I was wondering if anyone else has noticed Event 2545 errors concerning Microsoft-Windows-DeviceManagement-Enterprise-Diagnostics-Provider in your Event Log. I have been getting them since installing the last cumulative updates KB4023057, KB5018482 and KB5018202 on… -
Event 2545 «Microsoft-Windows-DeviceManagement-Enterprise-Dia gnostics-Provider»
in Windows 10 BSOD Crashes and Debugging
Event 2545 «Microsoft-Windows-DeviceManagement-Enterprise-Dia gnostics-Provider»: Hello all! I was wondering if anyone else has noticed Event 2545 errors concerning Microsoft-Windows-DeviceManagement-Enterprise-Diagnostics-Provider in your Event Log. I have been getting them since installing the last cumulative updates KB4023057, KB5018482 and KB5018202 on… -
Provisioning-Diagnostics-Provider ID 40
in Windows 10 Support
Provisioning-Diagnostics-Provider ID 40: Hi,
After the last update KB4580364 I found this warning:Provisioning-Diagnostics-Provider ID 40
Registry specified search path is invalid: C:\Windows\Provisioning\Cosa\OEM.
Registry specified search path is invalid: C:\Windows\Provisioning\Cosa\MO.
What can be the…
Дядюшка Зайчик
поверхностный гуглёж принёс довольно попсовые (и скорее всего неработающие) предложения по исправлению этой фигни, а мудрый человек с реддита написал: Reinstalling your Windows is usually the fastest way to get rid of these errors 
Ответить
Развернуть ветку
Poindexter
Автор
как же бесит, что в винде все через жопу
Ответить
Развернуть ветку
Дядюшка Зайчик
зато переустановить её это полчаса. и не мучаться
Ответить
Развернуть ветку
Poindexter
Автор
потом час все лишнее отрубать, и нет гарантии новых ошибок
Ответить
Развернуть ветку
Риныч
![]()
Ну вот лезешь, что-то ковыряешь, а потом бугуртишь, какая плохая винда! Ломается!
Ответить
Развернуть ветку
Vladimir
С форума answers.microsoft.com:
My untutored view is that it’s sloppy programming somewhere and the offending party seems unable or unwilling to fix it.
Life’s too short for this nonsense — I’ve disabled the log, so the errors are no longer reported.
How?
Within EventVwr, navigate down the logs (left hand pane) until you reach Applications and Service Logs-Microsoft-Windows-ModernDeployment-Diagnostics-Provider-ManagementService
Right-click on the log — Properties — Disable log
My machine continues to work just fine.
Ответить
Развернуть ветку
Poindexter
Автор
Не понял, он просто отключил журнал событий ?
Ответить
Развернуть ветку
Xinkata
Ты хоть что-нибудь из попсовых рекомендаций по проблеме делал?
Ответить
Развернуть ветку
Vladimir
Он отключил записи в журнале событий выдающим ошибку провайдером, ModernDeployment-Diagnostics-Provider-ManagementService.
Пишет, что всё остальное работает.
Проблема у многих пользователей, MS советует только переставить Win.
Ответить
Развернуть ветку
Vladimir
I have been able to determine it deals with the Microsoft Account Sign-in Assistant.
Description: Enables user sign-in through Microsoft account identity services. If this service is stopped, users will not be able to logon to the computer with their Microsoft account.
Ответить
Развернуть ветку
Poindexter
Автор
Microsoft Account Sign-in Assistant я как раз отключил, после окна с ошибками какие то вылезли, но ошибка с Autopilot.dll WIL вроде ушла. Появилось конечно куча предупреждений и ошибка с ( Сбой при запуске службы «AMDRyzenMasterDriverV22» из-за ошибки
Не удается найти указанный файл.)
Ответить
Развернуть ветку
Дядюшка Зайчик
с отключением Sign-in Assistant народ рапортует что вылезает куча других проблем и отключать не советует :-/
Ответить
Развернуть ветку
Poindexter
Автор
Заново включил службу, логи по совету Владимира отключил, перезагрузил, захожу в ТикТок и вижу это
Ответить
Развернуть ветку
7 комментариев
Раскрывать всегда
 Изучая события в просмотре событий Windows 11 или Windows 10, вы можете обнаружить множественные сообщения об ошибках Autopilot.dll WIL с кодом 0x80070491 или 0x80070490, появляющиеся многократно сразу после загрузки компьютера, при этом сама система обычно работает без сбоев.
В этой инструкции подробно о том, чем вызвана ошибка Autopilot.dll WIL и возможных способах её исправить.
Причины ошибки Autopilot.dll WIL

Рассматриваемая ошибка Autopilot.dll WIL от источника Microsoft-Windows-ModernDeployment-Diagnostics-Provider имеет отношение к работе службы «Помощник по входу в учетную запись Майкрософт» (Microsoft Account Sign-in Assistant) и обычно имеет код HRESULT 0x80070491 для систем на базе Intel или 0x80070490 на компьютерах с процессорами AMD.
Причина, в свою очередь, обычно заключается в неподдерживаемом Windows Autopilot модуле TMP или проблемах в работе с конкретной реализацией модуля TPM, в частности ASP fTPM на платформе AMD.
Пример информации об ошибке в просмотре событий для систем на базе Intel:
Autopilot.dll WIL.
HRESULT: 0x80070491
Файл: onecoreuap\admin\moderndeployment\autopilot\dll\dllmain.cpp, строка 128
Сообщение: NULL
Указанная ошибка не приводит к каким-либо сбоям Windows 11 или Windows 10 и, если вы наблюдаете какие-либо дополнительные проблемы в работе Windows, вероятнее всего ошибки Autopilot.dll WIL не являются их причиной.
Варианты решения
Проблема с ошибкой Autopilot.dll WIL является массовой, но сама по себе не приводит к каким-либо наблюдаемым изменениям в поведении системы: многие пользователи, не заглядывающие в «Просмотр событий», даже не подозревают о её наличии.
В свою очередь, исправление ошибки некоторыми из описанных методом (все, начиная с 3-го) может привести к неприятным последствиям. Поэтому, возможно, неплохим вариантом действий будет просто не обращать внимания на рассматриваемую ошибку. Если этот вариант вам не подходит, вы можете использовать следующие способы:
- Установите доступные обновления Windows и, при наличии — обновления БИОС для вашей системы (может сработать для систем AMD). При обновлении БИОС четко следуйте рекомендациям производителя, поскольку процедура не всегда безопасна.
- Попробуйте переустановить Windows Autopilot с помощью следующих команды в Windows PowerShell или Терминале Windows, запущенном от имени администратора (можно запустить через меню по правому клику на кнопке «Пуск»):
Get-AppxPackage Microsoft.WindowsAutopilot | Remove-AppxPackage
Get-AppxPackage -allusers Microsoft.WindowsAutopilot | Foreach {Add-AppxPackage -DisableDevelopmentMode -Register "$($_.InstallLocation)\AppXManifest.xml"}
- Отключение службы «Помощник по входу в учетную запись Майкрософт» (Microsoft Account Sign-in Assistant) также решит проблему. При этом часть функций и встроенных приложений Windows, требующих учетной записи Майкрософт перестанут работать: например, Microsoft Store начнёт сообщать об ошибках при запуске. Перед отключением службы рекомендую создать дополнительную локальную учетную запись администратора на случай, если вход в систему с учетной записью Майкрософт будет сообщать об ошибках. Для отключения службы нажмите клавиши Win+R на клавиатуре, введите services.msc и нажмите Enter. Найдите в списке службу «Помощник по входу в учетную запись Майкрософт», дважды нажмите по ней, установите «Тип запуска» в «Отключена», примените настройки и перезагрузите компьютер.

- Сброс доверенного платформенного модуля TPM также может помочь решить проблему. Внимание: если у вас включено шифрование устройства или шифрование диска BitLocker, вы можете потерять доступ к данным, а при использовании методов входа Windows Hello, при следующем входе вам может потребоваться ввод пароля учетной записи вместо ПИН-кода или разблокировки отпечатком пальца — если не уверены в наличии шифрования устройства или в том, что знаете свой пароль, не выполняйте указанные действия. Для сброса TPM: нажмите клавиши Win+R, введите tpm.msc и нажмите Enter. Используйте пункт «Очистить TPM», перезагрузите компьютер по завершении.

- Отключение модуля TPM в БИОС также помогает решить проблему. Внимание: аналогично предыдущему пункту, может привести к проблемам в ряде случаев.


Microsoft известно о проблеме, а на официальном сайте поддержки присутствуют сотни обращений на тему ошибок Autopilot.dll WIL, регистрирующихся в просмотре событий, даже на новых ПК или ноутбуках с предустановленной ОС. Однако, гарантированно рабочего и не вызывающего при этом тех или иных дополнительных неудобств способа исправить ситуацию к текущему моменту нет.