В операционной системе Windows, при аварийном завершении работы ОС, автоматически создается аварийный дамп памяти, он сохраняется в системном каталоге Windows в файле MEMORY.DMP (%SystemRoot%\MEMORY.DMP). Этот файл помогает определить причину сбоя в работе операционной системы и определить процесс, ставшив возможной причиной остановки работы ОС. Файл дампа памяти может быть размером в несколько гигабайт, поэтому для его анализа требуется использование специальных инструментов.
В этой статье описываются шаги, которые следует предпринять для анализа файла аварийного дампа памяти MEMORY.DMP.
Чтобы прочитать файл MEMORY.DMP потребуется специальная утилита: Debugging Tools for Windows (WinDbg), которая входит в состав Windows 10 SDK, ее можно скачать по ссылке:
Windows 10 SDK
, как в виде инсталлятора, так и в виде ISO файла.
SDK (software development kit) — это набор средств разработки, который позволяет специалистам по программному обеспечению создавать приложения для определённого пакета программ, программного обеспечения базовых средств разработки, аппаратной платформы, компьютерной системы, игровых консолей, операционных систем и прочих платформ.
Установка утилиты Debugging Tools for Windows из набора Software Development Kit (SDK)
1. Запустить установочный файл на компьютере на котором будет проводиться анализ аварийного дампа памяти MEMORY.DMP
2. Выбрать путь установки и 2 раза нажать Next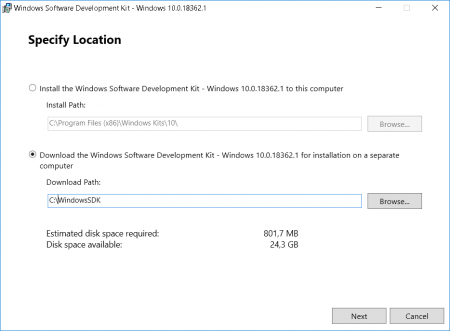
3. Принять лицензионное соглашение
4. В окне выбора набора устанавливаемых утилит выбрать Debugging Tools for Windows (остальные пункты для анализа дампа памяти не понадобятся) и нажать Install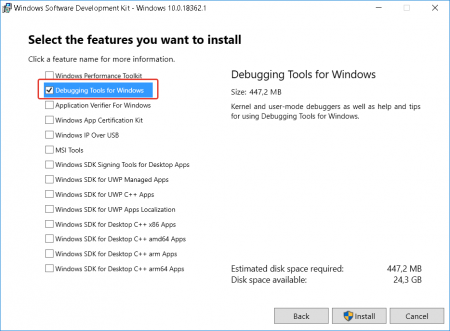
5. По завершении установки нажать Close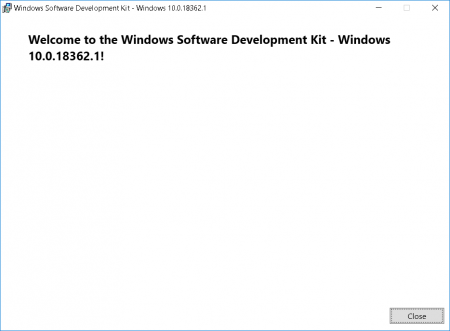 Утилита Debugging Tools for Windows установлена.
Анализ аварийного дампа памяти MEMORY.DMP
1. Запускаем установленную утилиту WinDbg и в меню File выбираем Open Crash Dump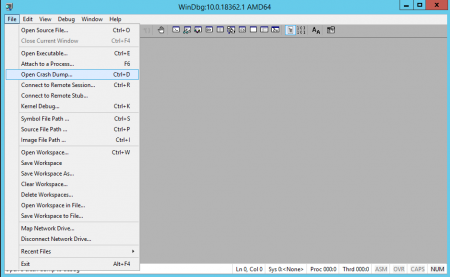
2. В окне открытия файла переходим к пути размещения файла MEMORY.DMP и открываем его
3. После изучения заголовков переходим по кликабельной ссылке: !analyze -v или вводим эту команду вручную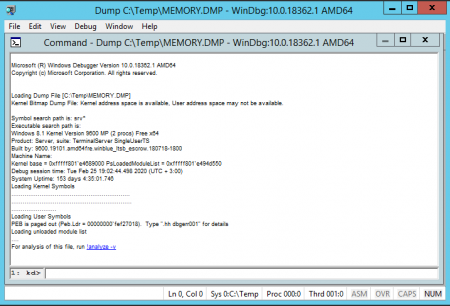
4. Ожидаем некоторое время, которое потребуется утилите на чтение файла и поиск ошибок
5. Анализируем информацию о процессе, который вызвал аварийное завершение работы Windows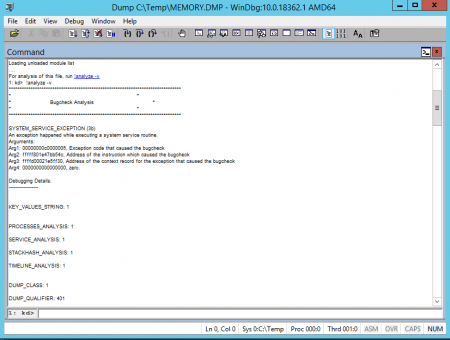
Используя полученную информацию, можно понять, какой из процессов вызвал аварийное завершение ОС. Если указанный процесс принадлежить производителю ПО, то можно обратиться к нему с соответствующим кейосм.
Windows 11 (including earlier version), when, encounter a Blue Screen of Death (or BSOD), accumulates all the memory information into a file. Holding Dump file as name it further helps users to identify and debug the cause of the crashes. The files also allow writing the debugging details in different file formats in order to simplify the readability of the data.
Dump file may be of various types depending on the nature of crash and bug check values. These are “Small memory dump (Minidump)”, “Kernel memory dump”, “Complete memory dump”, “Automatic memory dump”, and “Active memory dump”. However, among all these, Windows 10/11 generates Automatic memory dump all by itself as its name suggests. The following section will deal with everything related to Dump File Location Windows 11 or 10.
Here is the Dump File Location Windows 11 or 10 –
Dump File Location
Instead, you can say Dump file locations so see the following paths to find out the data –
%SystemRoot%memory.dmp which means
C:\Windows\memory.dmp
This is the default location and here, C: refers to the system drive where Windows is installed.
Windows 11/10 can also capture memory dumps that consume a small amount of space. These are created at –
%SystemRoot%Minidump.dmp i.e.,
C:\Window\Minidump.dump
Change Dump File Location Windows 11 or 10
- Go to desktop and right-click on This PC icon. From the available options, choose Properties.
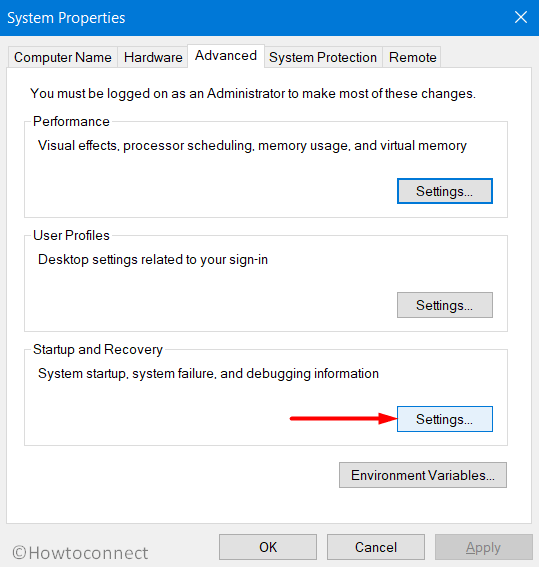
- Click Advanced system settings link that shows up on the top left of the subsequent window.
- Click Settings beneath Startup and Recovery section.
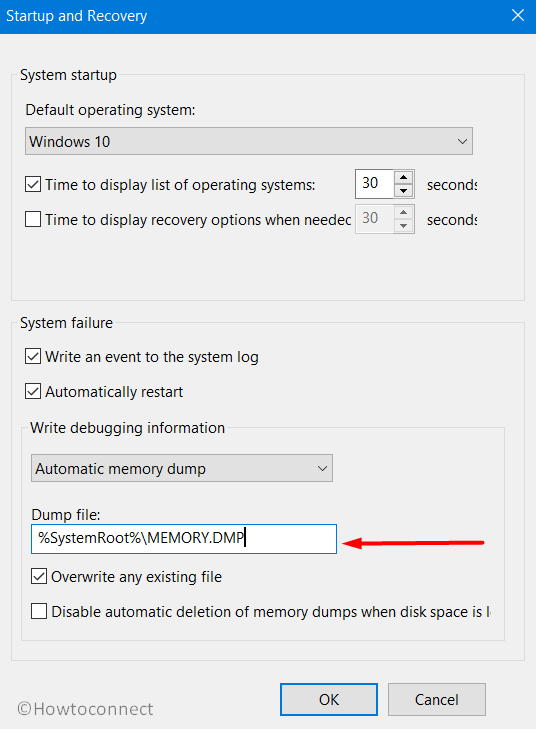
- Locate the Dump File text field and insert the location of the file.
Configure the Type of Memory Dump File
As aforementioned, Windows generates Automatic memory dump files but users can choose to configure the settings as per need. Thankfully, there are certain ways using which a user can change the type of memory dump file that Windows creates.
1]Through Startup and Recovery
- Press “Win logo+R” hotkey to open Run dialog box. System properties wizard will become visible, switch to Advanced tab.
- Here, click Settings just below Startup and Recovery section.
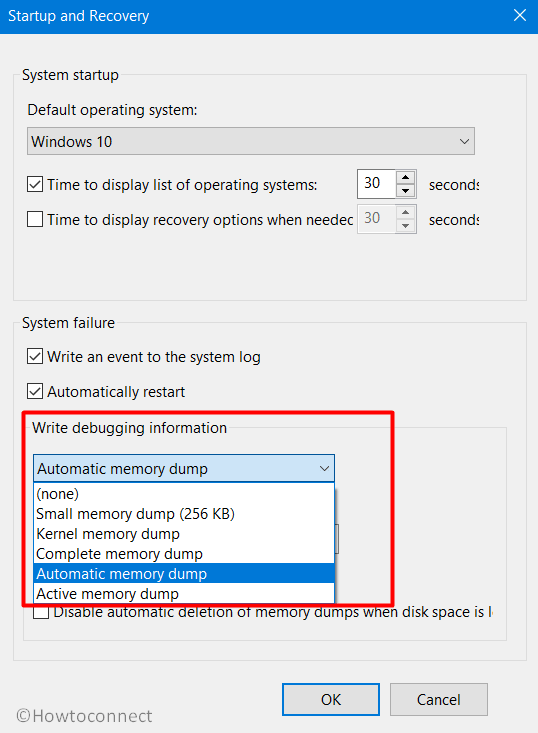
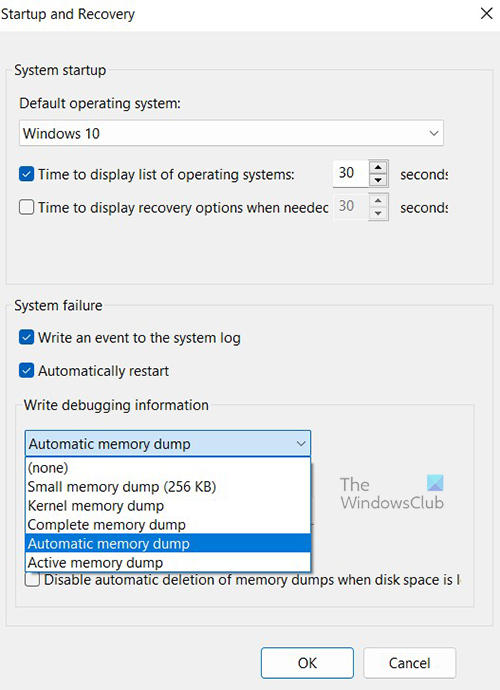
- Click the drop-down under Write debugging information. From the list of dump file types, choose the type that you wish Windows to generate when Windows crashes.
- To apply the changes, click OK.
Note – In case the system crashes a lot, it’s better to deselect the checkbox against the option Overwrite any existing file. Doing this will eventually create incremental dump files that will have a memory dump file for each crash that occurs.
2] Use Elevated Command Prompt
- Fire up taskbar search using Win+S combination of keys. Type in cmd.exe, right-click ok Command Prompt and choose Run as administrator.
- Click Yes on the prompt of UAC to access elevated Command Prompt.
- Once into the black window, insert the applicable command from the list below to change the type of dump file and hit Enter.
| Memory Type | Command Line |
| No memory | wmic RECOVEROS set DebugInfoType = 0 |
| Small memory dump | wmic RECOVEROS set DebugInfoType = 3 |
| Kernel memory dump | wmic RECOVEROS set DebugInfoType = 2 |
| Complete memory dump | wmic RECOVEROS set DebugInfoType = 1 |
| Automatic memory dump | wmic RECOVEROS set DebugInfoType = 7 |
| Active memory dump | wmic RECOVEROS set DebugInfoType = 1 |
- Finally, close the prompt window and Restart Windows 10 PC to make the changes effective.
Note – The Command Prompt also lets you view the current memory dump file. Just open Command Prompt as Administrator and run the following command-line –
wmic RECOVEROS get DebugInfoType
Types of Memory Dump Files
It is important to know the types after finding Dump File Location Windows 11 or 10 –
Small memory dump – It is the type that contains a minimal amount of details. Basically, the file includes the stop code, list of device drivers, parameters. Furthermore, it also contains the current process and informs which kernel thread or process crashed.
Kernel memory dump – This is the most useful and comprehensive one with respect to the kernel. Moreover, this type contains information in connection with programs and drivers in kernel mode. However, the dimension of this dump file completely depends on the amount of kernel-mode memory specified by Windows and drivers. Now, in case a second crash occurs and a kernel memory dump file is generated, the earlier content gets overwritten.
Complete memory dump – A remarkably large file type which is equal to the RAM of the system. It incorporates physical memory allocation that is basically left out in other kernel dumps.
Automatic memory dump – When compared to the kernel memory option, this is quite similar to it in terms of information. The only difference between them is the size of the paging file that Windows sets for them.
Active memory dump – It is comparatively smaller than complete memory dump. This type refines the items that are not influential in spotting the cause of a crash.
That’s all!!!
Repair any Windows problems such as Blue/Black Screen, DLL, Exe, application, Regisrty error and quickly recover system from issues using Reimage.

What is Memory Dump?
According to techopedia, a memory dump is a process where the contents of memory are displayed and stored in case of an emergency such as system crash. Memory dumps are mainly for software developers; they use the data’s stored in the system to diagnose the problem.
Developers use the dumps to fix the problem that caused the system crash. They are also known as core dump and sometimes BSOD (Blue screen of death).
To fix various Windows 10/11 problems, we recommend Outbyte PC Repair:
This software will repair common computer errors, protect you from file loss, malware damage, hardware failure, and optimise your computer for peak performance. In three simple steps, you can resolve PC issues and remove virus damage:
- Download Outbyte PC Repair Software
- Click Start Scan to detect Windows 10/11 issues that may be causing PC issues.
- Click Repair All to fix issues with your computer’s security and performance.
This month, Outbyte has been downloaded by 23,167 readers.
It primarily identifies the problem of the operating system or any application that has failed. It mainly is the information of the last state of the program or application or operating system. The last state before the program crashes can bring out the problem it had faced.
On the other hand, all the information consists of memory locations, program counters, program state and much more. Memory dump also has on-screen log files for viewing and sorting later.
You have to reboot the computer after the memory dump, or else it will be unavailable. Sometimes memory leak can cause memory dumps, and it’s not okay.
You will see memory dumps when you’ll encounter a blue screen of death error. Usually, a BSOD will give you some basic suggestion of where the problems occurred. Those suggestions or information’s are memory dumps.
So, when you reboot the system, you’ll be able to look into that information for further analysis. The memory dumps can contain passwords or any hidden key. So, beware of any potential hackers as they can easily find out your private info’s and hack the system.
Different Types of Memory Dumps and their Location
There are mainly five types of memory dumps stored in Windows 10. Each type is different and stores various information about the system crash. Let’s see what they are.
1. Automatic Memory Dump
Location: %SystemRoot%Memory.dmp
Size: Size of OS kernel
This one is the default option when you install Windows 10 for the first time. The setting is to support the System Managed page file configurations. Though it has been updated to reduce the size all over, it’s mainly for small SSDs.
But the large servers also benefit highly from it. Especially the automatic memory dump gives an output of Kernel memories. But the main difference is that the automatic process reduces the page file making it smaller than the size of the RAM.
You can also check or even edit the system paging file size. So for that just go to the following path, and you’ll be able to change it according to your desire.
Control Panel -> System and Security -> System -> Advanced system settings -> Performance -> Settings -> Advanced -> Change

2. Active Memory Dump
Location: %SystemRoot%Memory.dmp
Size: Triple the size of a kernel or automatic dump file
Microsoft did add the Active Memory Dump recently. Though it’s smaller than the complete memory dump, it’s three times bigger than the size of the kernel dump. It happens because it has both the kernel and the user space together.
So, overall the size gets bigger than the kernel dump. The dump files size can be up to 1.5 GB or even more. But you can try to compress it and reduce it to a more acceptable size for transportation.
3. Complete Memory Dump
Location: %SystemRoot%Memory.dmp
Size: Installed RAM plus 1MB
This one is the largest dump files that will take your spaces. As it includes the physical memory of the computer, the overall size gets too big. You can assume that the size can be less or equal to the installed RAM.
And with all other systems taking up GBs of the system this can become a serious issue if you are having too much of crashes of programs or systems. So, I would suggest that you would stick to the automatic dump file instead of this one.
4. Kernel Memory Dump
Location: %SystemRoot%Memory.dmp
Size: Size of physical memory owned by kernel-mode components
These dumps are equal to the size of the RAM that gets occupied by the Windows 10 kernel.
It can be up to 700MB in size, but if you want to compress it, then you can bring it down to 150MB. This dump contains the information for analysis. So, it can be helpful for developers.
The automatic dump setting creates a dump file saving only the recent one by default.
5. Small Memory Dump
Location: %SystemRoot%Minidump
Size: At least 64K on x86 and 128k on x64
It is also known as the mini dump. They include memory pages pointed to them by registers by their values at the point of the fault.
They are quite small as they don’t contain any binary or executable files from the time of the system crash. Moreover, these data are vital for the coders or debuggers to find out what happened.
Why are Memory Dumps Created?
You are wondering about now that why are Memory dump created. Are they essential? Or who uses these files? Well, they are mainly for developers developing a program or a system.
As I said before these files are solely here for giving you the additional information about the crash or system failure that occurred. So, if you are a developer who is working on the hardware drivers, then these pieces of information would come in handy.
As you can easily find out what is causing your system to crash, it becomes easier to solve.
But if you are not a developer then you can still use the information to know why your system is crashing all on a sudden. You just have to send it to a developer, and he will let you know what the problem is.
If any driver is causing the problem you can send them to that driver developers or if it’s with windows than you can send it to Microsoft for further analysis.
Hopefully, the developers will find out what the problem was and can assist you with further procedures.
Is it safe to Delete Memory Dumps?
Though with all its perks, these files seem to take up a lot of space on the disk. So, if you don’t have an issue with the crashes or don’t want these unnecessary files to clog your system, then you can go ahead and delete them.
They will be in the form of a .dmp file and can take a significant portion of resources. And if you have ever experienced a BSOD you will surely have a minimum of 800MB or even more files taking up space on your system.
You can quickly clean the memory dump by disk cleanup. Disk cleanup seems to clean the dumps without a fuss. Or you can also use CCleaner to detect and delete those dumps. So, you don’t have to delete them one by one manually.

To sum it all up, Memory dumps can be useful if you are a developer but can be a headache for the average users too. So, if you don’t want unnecessary files on your computer then clean it up. It shouldn’t be a problem at all.

Hasib is a born geek and loves tweaking his computer and gadgets for effectiveness and productivity. At WindowsChimp, he specializes in writing Tutorial guides and discovering new hacks to share.
System Error Memory Dump Files or Win Dump Files are like reports created whenever your computer experiences a crash. As the name suggests, they are Dump Files that are created and stored with information about each crash event and can be used to diagnose the problem that caused the crash. There are two major types of memory dump files, Memory.dmp and minidump. Memory Dump Files are important; however, they do take up a bit of space, and that can be a problem for users, especially if the storage is small.

When Windows crashes, it collects information about the crash during the time that the Crash Screen is displayed. At this point, the OS collects information from running applications, drivers, memories, etc., to create the Win dump files, also known as crash dumps files. These files together can be used to determine the cause of the crash. It is like analyzing stores of data that are saved over some time, the data will contain patterns that can be used to diagnose the cause of the problems.
Types of Windows Dump Files
Five types of Memory Dump Files can be created during a crash. They are:
- Complete Memory Dump Files,
- Kernel Memory Dump Files,
- Small Memory Dump Files,
- Automatic Memory Dump Files, and
- Active Memory Dump Files.
Complete Memory Dump Files in Windows
A Complete Memory Dump File is a copy of the entire Windows physical memory at the time that the crash occurred. This type of Memory Dump is the largest. The default location for the Complete Memory Dump File is %SystemRoot%\Memory.dmp. The old file is overwritten each time a new file is created.
TIP: You can analyze Windows Memory Dump .dmp files with WhoCrashed.
Kernel Memory Dump Files in Windows
Kernel memory dump files contain Windows kernel and hardware abstraction level kernel-mode drivers. Kernel memory dump files have smaller sizes than complete memory dump files because they don’t contain unallocated memory and memory allocated to user-mode applications. The default location for kernel memory dump file is %SystemRoot%\Memory.dmp. The old one is overwritten when a new one is created.
Read: How to manually create a Crash Dump file in Windows
Small Memory Dump Files (256 kb) in Windows
Small memory dump files contain information related to the list of loaded drivers, the running process, and the kernel. They are the smallest Win dump files and have lesser details and usefulness. The default location for the small memory dump file is %SystemRoot%\Minidump. When a new file is created, the older file is preserved.
Read: How to open and read Small Memory Dump (DMP) files
Automatic Memory Dump Files in Windows
Automatic Memory Dump and Kernel Memory Dump contains the same information. The difference between the two is the way that Windows sets the size of the system paging file.
If the system paging file size is set to System managed size, and the kernel-mode crash dump is set to Automatic Memory Dump, then Windows can set the size of the paging file to less than the size of RAM. In this case, Windows sets the size of the paging file large enough to ensure that a kernel memory dump can be captured most of the time.
If the computer crashes and the paging file is not large enough to capture a kernel memory dump, Windows increases the size of the paging file to at least the size of RAM. The time of this event is recorded here in the Registry:
HKLM\SYSTEM\CurrentControlSet\Control\CrashControl\LastCrashTime
The increased Paging file size stays in place for 4 weeks and then returns to the smaller size. If you want to return to the smaller paging file before 4 weeks, you can delete the Registry entry.
To see the Page file settings:
- Go to Control Panel > System > Advanced system settings.
- Under Performance, select Settings.
- On the Advanced tab, under Virtual memory, select Change.
- In the Virtual Memory dialog box, you can see the paging file settings.
By default the Automatic Memory Dump file is written to %SystemRoot%\Memory.dmp.
Active Memory dump Files in Windows
An Active Memory Dump is similar to a Complete Memory Dump, but it filters out pages that are not likely to be relevant to troubleshooting problems on the computer. Because of this filtering, it is typically significantly smaller than a complete memory dump. This dump file does include any memory allocated to user-mode applications. It also includes memory allocated to the Windows kernel and hardware abstraction layer (HAL), as well as memory allocated to kernel-mode drivers and other kernel-mode programs.
An Active Memory Dump is particularly useful when Windows is hosting virtual machines (VMs). When taking a complete memory dump, the contents of each VM is included. When there are multiple VMs running, this can account for a large amount of memory in use on the host system. Many times, the code activities of interest are in the parent host OS, not the child VMs. An active memory dump filters out the memory associated with all child VMs. The default location for the Active Memory Dump File is %SystemRoot%\Memory.dmp. The Active Memory Dump is available in Windows 11/10 and later.
Read: Free Crash Dump Analyzer software for Windows
What is the System Error Memory Dump Files Location?
The default location for the System Error Dump Files or Win Dump Files is on the drive that the Operating System is installed. In most cases that is the drive C:. you can search for:
- %systemroot%\minidump
- %systemroot%\memory.dmp
or
- C:\Windows\minidump
- C:\Windows\memory.dmp
If the Operating System is installed on a drive with another drive letter, then that drive letter would replace C:.
In most cases, you will see both minidump and Memory.dmp on your computer. This is so because all other Memory Dump files will be stored in the memory.dmp while the small dump file will be stored in minidump file.
If you can’t find the Memory Dump Files it could mean that they were deleted possibly in a clean-up. It could also mean that no crash was recorded.
In Windows 11, dump files can also be stored as smaller memory dump files called Minidump. You can find minidump.dmp dump files in C:\Windows\Minidump.dmp. Some minidump files will have their own names, usually numbers such as the date and time of the crash incident.
Read:
- Windows Memory Dump Settings
- How to change the number of Memory Dump Files, Windows creates and saves
Is it safe to delete System Error Memory Dump Files?
Yes, it is safe to delete System Error Memory Dump Files. All System Memory Dump Files contain some information about a system crash. Each time the system crashes a System Error Dump File is created. These files can be used to analyze the cause of the crash. Deleting these files will not directly affect the system, however, they might hold valuable data. It would be wise to make a backup of the System Error Memory Dump Files for future reference. Files that are older than 30 days may be deleted if you wish if there are no problems. The urge to delete the Dump Files is usually because of the space they take up on the computer. You can choose to backup the files externally for 30 days and delete them if there are no problems.
The files may also be sent to Microsoft for analysis. it is a good idea to report them to Microsoft before deleting them. Sending dump files to Microsoft is a good idea because there are teams that review them and try to investigate the cause and resolve it either through Windows Update or notify you about possible solutions in Action Center.
How to Delete Memory Dump Files in Windows?
To delete Memory Dump Files you can find them on the hard drive and delete them. You can also delete it using the Windows Disk Cleanup Tool.
Open This PC in the left panel.
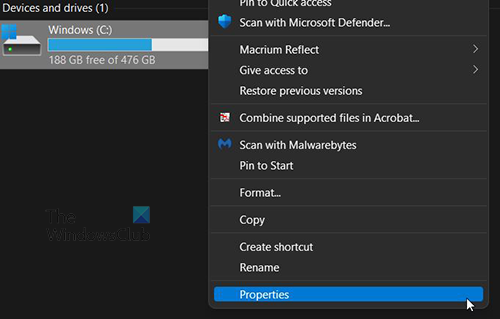
Right Click on the C: drive and click Properties.
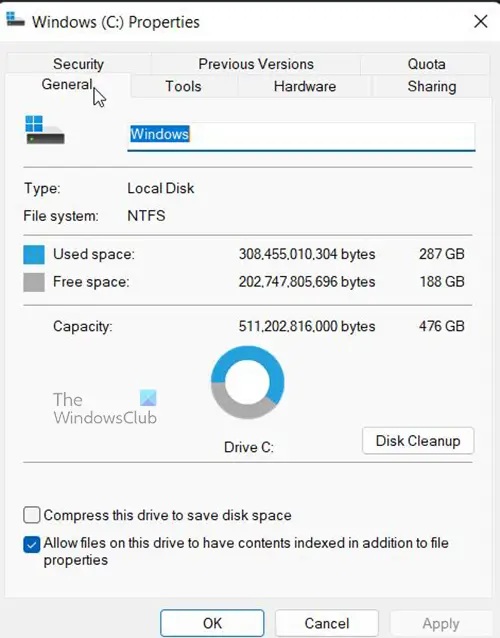
A window will appear. Click Disk Cleanup, and it will load.
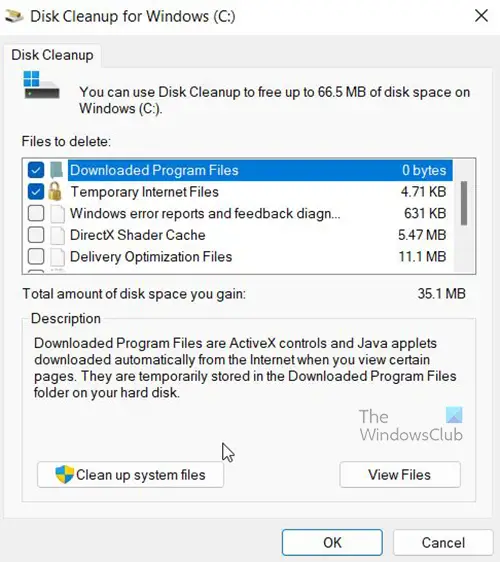
A window will appear, look to see that any files you need to delete are selected then click Clean Up System Files then wait for it to finish.
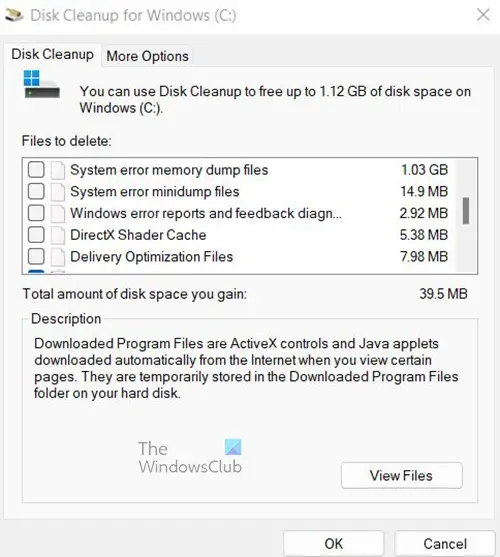
Another window will appear showing a list of things that can be cleaned up. You will notice some files selected and the amount of space that will be freed up if those files are deleted.
System Error Memory Dump files and System Error Minidump files are unselected. You can choose to delete them by selecting them and clicking ok,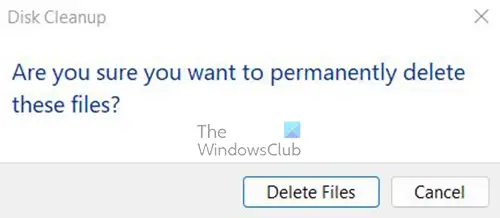
You will be asked to confirm the delete. Confirm by clicking Delete Files.
What are System Error Memory Dump Files?
System Error Memory Dump Files are basically error logs that are created whenever your computer crashes. They can hold small amount of information about the crash or very large amounts of information. The System Error Memory Dump Files can be used by users or technicians to see why the crash happened and they can decide what to do. If these files are sent to Microsoft, they can use them to make corrections to whatever caused the crash.
Related reads:
- Physical Memory Limits in Crash Dump files
- Configure Windows to create Crash Dump Files on Blue Screen
How Long Should Error Memory Dump Files be Kept?
Error Memory Dump Files can be kept for 30 days or 60 days. They can be deleted after that time if the crash is not happening anymore. If the crash keeps happening then the larger Error Dump Files will get written over. The Complete Memory Dump File is the largest of the five types because it contains more data about the crash. This is usually the one that concerns users because of the size. If you want to keep them longer but you are low on disk space, you can choose to save them externally.
Когда в Windows 10 возникает критическая ошибка — например, появляется синий экран смерти — система создает файлы дампа памяти. В этих файлах содержится копия системной памяти на момент ошибки — она может помочь определить причину проблемы.
Файлы дампа системных ошибок могут пригодиться во многих ситуациях, но если вы не разработчик и отправлять файлы в службу поддержки Microsoft не планируете, они будут только тратить место на жестком диске.
Если у вас на компьютере не хватает места, или вы просто решили избавиться от ненужного балласта, есть целых три метода безопасного удаления этих файлов: с помощью приложения Параметры, Очистки диска и Командной строки.
В этой инструкции мы расскажем, как найти и удалить файлы дампа системных ошибок.
Как удалить файлы дампа системных ошибок с помощью Параметров
Чтобы удалить файлы, проделайте следующее:
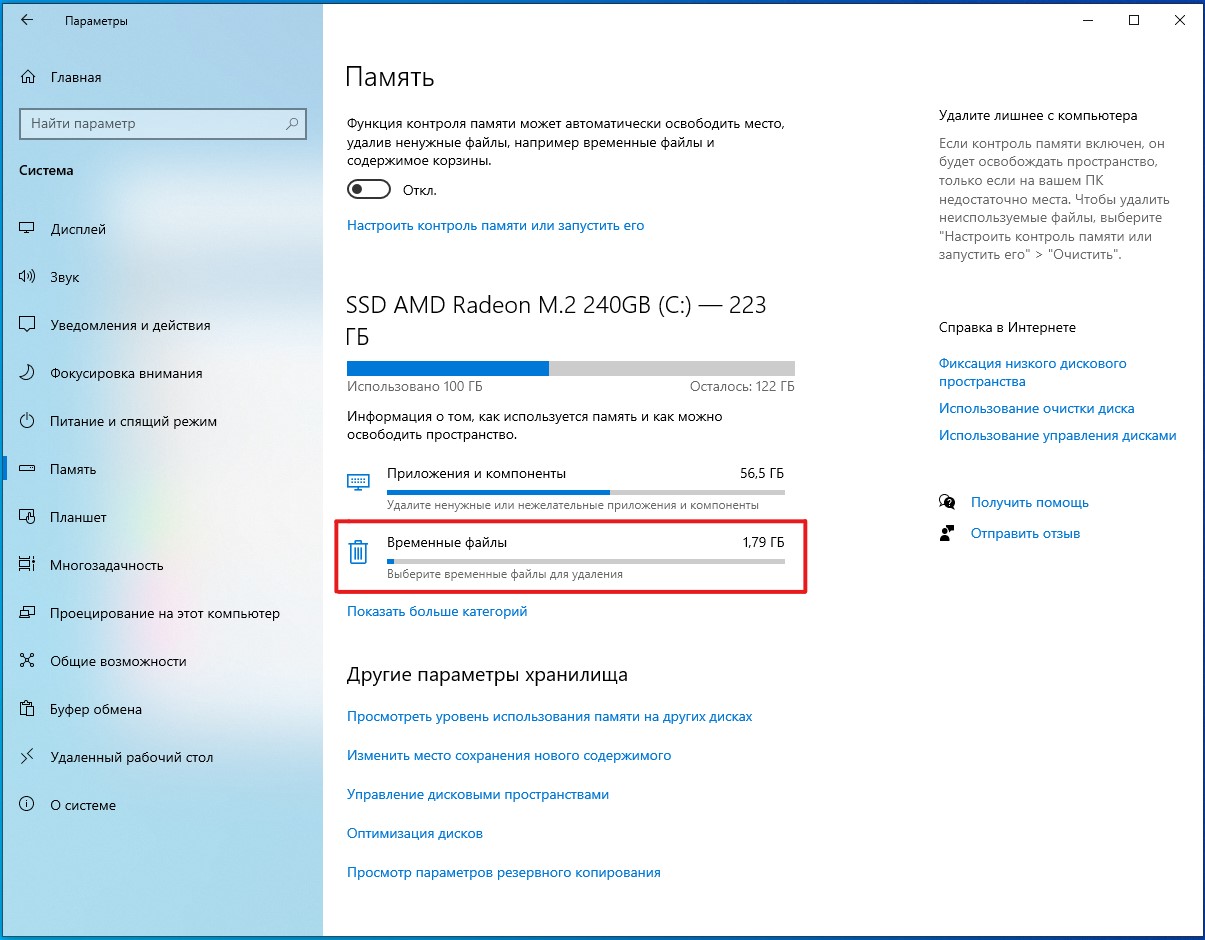
- Откройте Параметры.
- Выберите Система.
- Выберите Память.
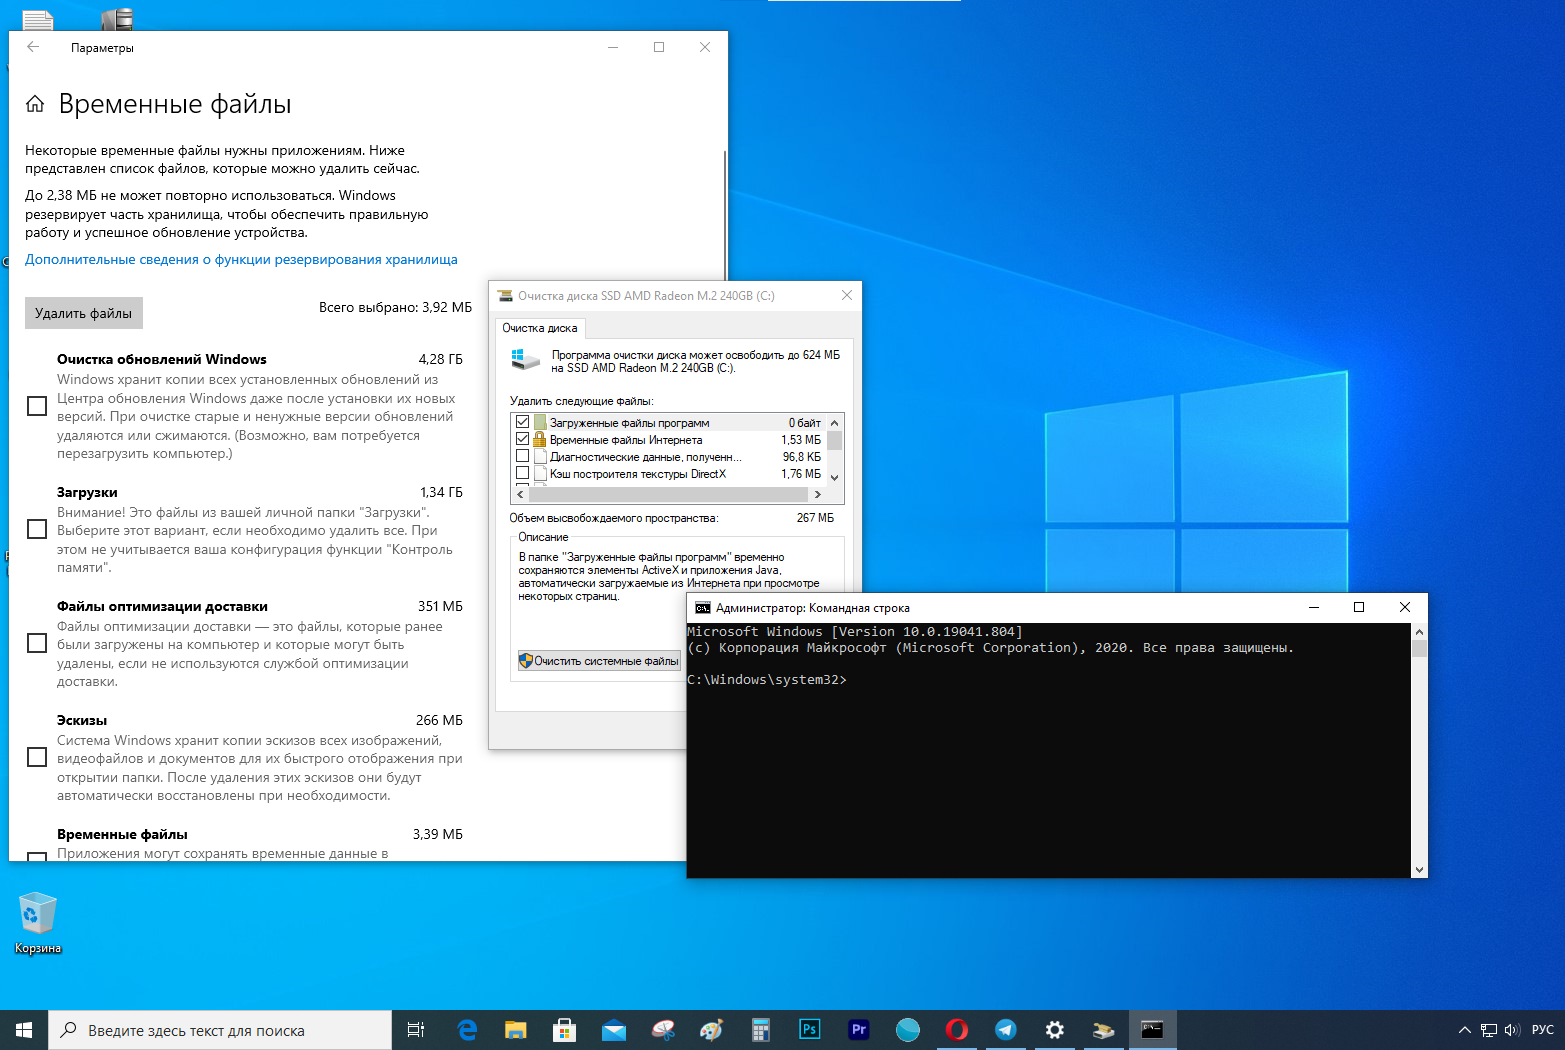
- В разделе основного диска выберите Временные файлы.

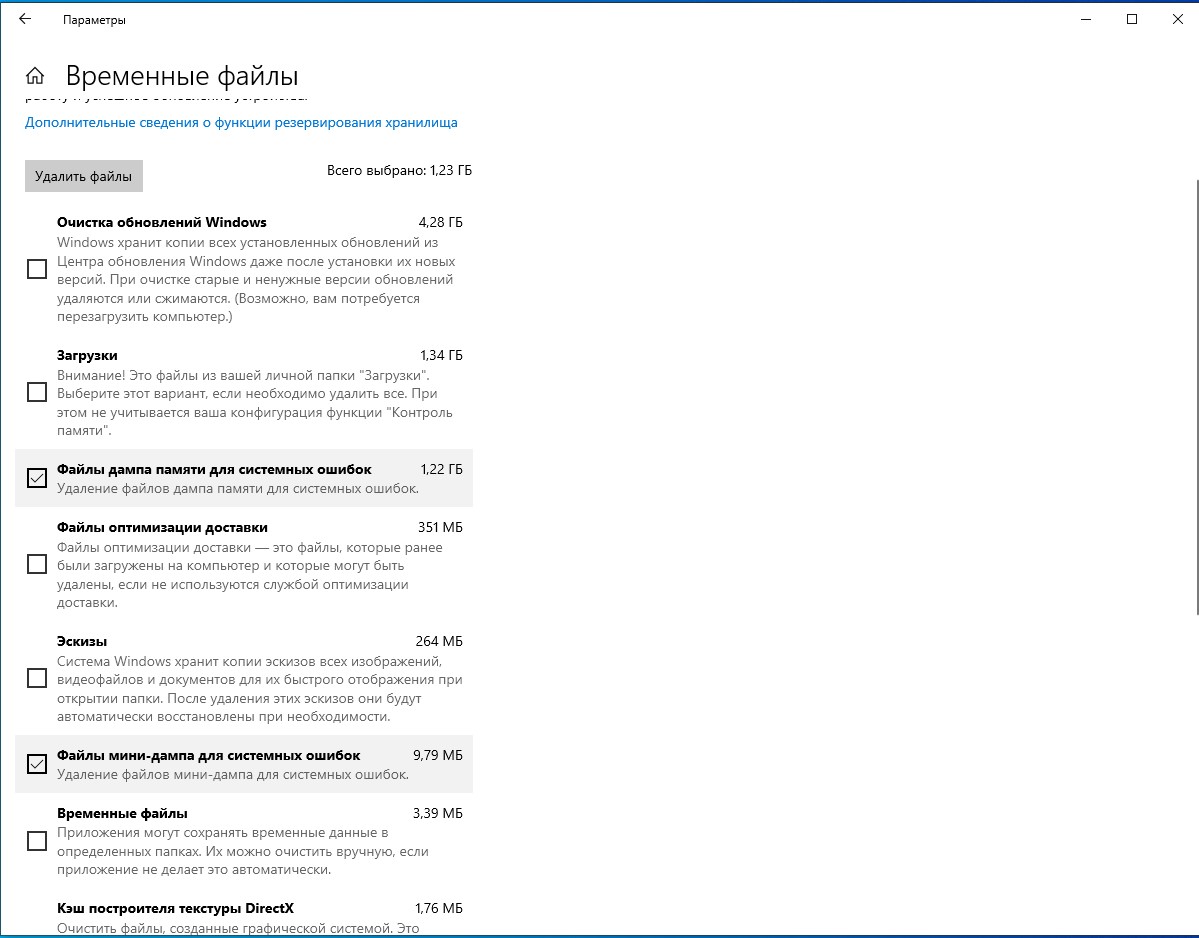
- Отметьте опцию Файлы дампа памяти системных ошибок.

- (Опционально) Отметьте опцию файлы небольшого дампа системных ошибок.
На заметку: файлы дампа памяти содержат все доступные данные памяти и из-за этого, как правило, имеют объем, равный объему памяти. Файлы небольшого дампа занимают всего несколько мегабайт и содержат только основную информацию о сбое. - Уберите галочки возле остальных доступных вариантов.
- Нажмите Удалить файлы.
После выполнения этих шагов файлы будут удалены с вашего компьютера, освободив дополнительное пространство для более важных вещей.
Как удалить файлы дампа системных ошибок с помощью Очистки диска
Чтобы удалить файлы дампа системы с помощью очистки диска, проделайте следующее:
- Откройте Пуск.
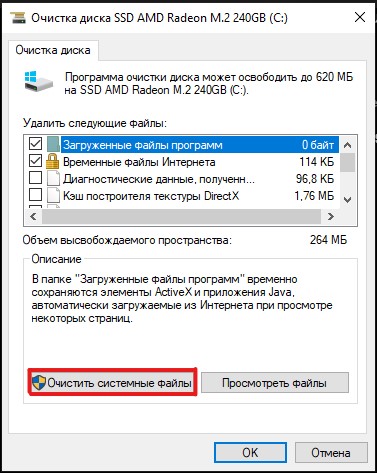
- В Средствах администрирования Windows найдите приложение Очистка диска и откройте его.
- Нажмите Очистить системные файлы.

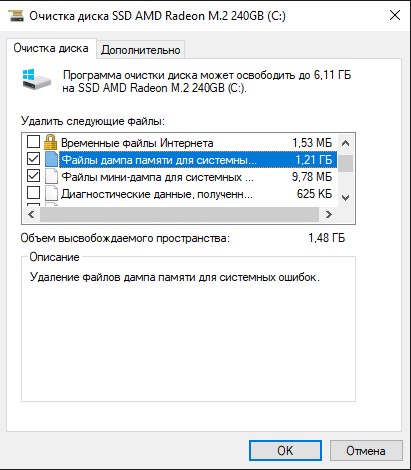
- Отметьте опцию Файлы дампа памяти системных ошибок.
- (Опционально) Отметьте опцию файлы небольшого дампа системных ошибок.
- Нажмите ОК.
После выполнения этих шагов файлы дампа и небольшого дампа будут удалены с устройства.
Как удалить файлы дампа системных ошибок с помощью Командной строки
Чтобы удалить файлы дампа системы с помощью Командной строки, проделайте следующее:
- Откройте Пуск.
- В разделе Служебные программы найдите Командную строку, щелкните правой кнопкой мыши верхний результат и выберите Запуск от имени администратора.
- Введите следующую команду и нажмите Enter:
del /f /s /q %systemroot%\memory.dmp
- (Опционально) Введите следующую команду, чтобы удалить также файлы небольшого дампа, и нажмите Enter:
del /f /s /q %systemroot%\Minidump\*.*
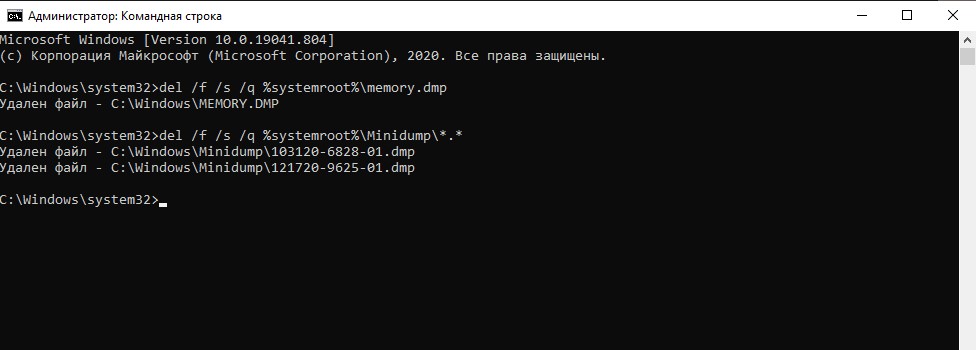
После выполнения этих действий будут удалены memory.dmp и все файлы небольшого дампа.
Если никаких критических ошибок за последнее время не случалось или производилась очистка памяти устройства, скорее всего, никаких файлов дампа на нем и не будет. В таком случае, соответствующей графы в Параметрах не окажется, и в системных папках файлы также будут отсутствовать.