- Downloading Prometheus
- Configuring Prometheus
- Starting Prometheus
- Using the expression browser
- Using the graphing interface
- Monitoring other targets
- Summary
Welcome to Prometheus! Prometheus is a monitoring platform that collects metrics from monitored targets by scraping metrics HTTP endpoints on these targets. This guide will show you how to install, configure and monitor our first resource with Prometheus. You’ll download, install and run Prometheus. You’ll also download and install an exporter, tools that expose time series data on hosts and services. Our first exporter will be Prometheus itself, which provides a wide variety of host-level metrics about memory usage, garbage collection, and more.
Downloading Prometheus
Download the latest release of Prometheus for your platform, then
extract it:
tar xvfz prometheus-*.tar.gz
cd prometheus-*
The Prometheus server is a single binary called prometheus (or prometheus.exe on Microsoft Windows). We can run the binary and see help on its options by passing the --help flag.
./prometheus --help
usage: prometheus [<flags>]

The Prometheus monitoring server

. . .
Before starting Prometheus, let’s configure it.
Configuring Prometheus
Prometheus configuration is YAML. The Prometheus download comes with a sample configuration in a file called prometheus.yml that is a good place to get started.
We’ve stripped out most of the comments in the example file to make it more succinct (comments are the lines prefixed with a #).
global:
  scrape_interval:     15s
  evaluation_interval: 15s

rule_files:
  # - "first.rules"
  # - "second.rules"

scrape_configs:
  - job_name: prometheus
    static_configs:
      - targets: ['localhost:9090']
There are three blocks of configuration in the example configuration file: global, rule_files, and scrape_configs.
The global block controls the Prometheus server’s global configuration. We have two options present. The first, scrape_interval, controls how often Prometheus will scrape targets. You can override this for individual targets. In this case the global setting is to scrape every 15 seconds. The evaluation_interval option controls how often Prometheus will evaluate rules. Prometheus uses rules to create new time series and to generate alerts.
The rule_files block specifies the location of any rules we want the Prometheus server to load. For now we’ve got no rules.
The last block, scrape_configs, controls what resources Prometheus monitors. Since Prometheus also exposes data about itself as an HTTP endpoint it can scrape and monitor its own health. In the default configuration there is a single job, called prometheus, which scrapes the time series data exposed by the Prometheus server. The job contains a single, statically configured, target, the localhost on port 9090. Prometheus expects metrics to be available on targets on a path of /metrics. So this default job is scraping via the URL: http://localhost:9090/metrics.
The time series data returned will detail the state and performance of the Prometheus server.
For a complete specification of configuration options, see the
configuration documentation.
Starting Prometheus
To start Prometheus with our newly created configuration file, change to the directory containing the Prometheus binary and run:
./prometheus --config.file=prometheus.ymlPrometheus should start up. You should also be able to browse to a status page about itself at http://localhost:9090. Give it about 30 seconds to collect data about itself from its own HTTP metrics endpoint.
You can also verify that Prometheus is serving metrics about itself by
navigating to its own metrics endpoint: http://localhost:9090/metrics.
Using the expression browser
Let us try looking at some data that Prometheus has collected about itself. To
use Prometheus’s built-in expression browser, navigate to
http://localhost:9090/graph and choose the «Table» view within the «Graph»
tab.
As you can gather from http://localhost:9090/metrics, one metric that
Prometheus exports about itself is called
promhttp_metric_handler_requests_total (the total number of /metrics requests the Prometheus server has served). Go ahead and enter this into the expression console:
promhttp_metric_handler_requests_total
This should return a number of different time series (along with the latest value recorded for each), all with the metric name promhttp_metric_handler_requests_total, but with different labels. These labels designate different requests statuses.
If we were only interested in requests that resulted in HTTP code 200, we could use this query to retrieve that information:
promhttp_metric_handler_requests_total{code="200"}
To count the number of returned time series, you could write:
count(promhttp_metric_handler_requests_total)
For more about the expression language, see the
expression language documentation.
Using the graphing interface
To graph expressions, navigate to http://localhost:9090/graph and use the «Graph» tab.
For example, enter the following expression to graph the per-second HTTP request rate returning status code 200 happening in the self-scraped Prometheus:
rate(promhttp_metric_handler_requests_total{code="200"}[1m])
You can experiment with the graph range parameters and other settings.
Monitoring other targets
Collecting metrics from Prometheus alone isn’t a great representation of Prometheus’ capabilities. To get a better sense of what Prometheus can do, we recommend exploring documentation about other exporters. The Monitoring Linux or macOS host metrics using a node exporter guide is a good place to start.
Summary
In this guide, you installed Prometheus, configured a Prometheus instance to monitor resources, and learned some basics of working with time series data in Prometheus’ expression browser. To continue learning about Prometheus, check out the Overview for some ideas about what to explore next.
This documentation is open-source. Please help improve it by filing issues or pull requests.
In this article we are going to cover How Install Install Prometheus and Grafana on Windows with WMI Exporter, Configure Prometheus as Grafana DataSource.
Table of Contents
What is prometheus?
- Prometheus is a open source Linux Server Monitoring tool mainly used for metrics monitoring, event monitoring, alert management, etc.
- Prometheus has changed the way of monitoring systems and that is why it has become the Top-Level project of Cloud Native Computing Foundation (CNCF).
- Prometheus uses a powerful query language i.e. “PromQL”.
- In Prometheus tabs are on and handles hundreds of services and microservices.
- Prometheus use multiple modes used for graphing and dashboarding support.
Why we used prometheus?
- A multi-dimensional data model with time series data identified by metric name and key/value pairs
- PromQL, a flexible query language to leverage this dimensionality
- Pushing time series is supported via an intermediary gateway
- Multiple modes of graphing and dashboarding support
Prometheus Architecture
![Install Prometheus and Grafana on Windows with WMI Exporter [4 Steps] 1](https://lh3.googleusercontent.com/HrErk32YlgPbLBCqlHpzen7cXwXCpb1sv03xiAKBmpKkFXYn-Xd5GR34xwiyxhsQQdQ_aHxr-hwnNuGkQzDejQ7ar9woEEutbtT7QGdE6lKZ6HuiPwygCXIMI1lWDdtHhKwuGxB6)
- As above we can see an architecture of Prometheus monitoring tool.
- We made a basic design to understand it easily for you people.
Now lets understand the Prometheus components one-by-one
Prometheus Components
1. Prometheus Server
- Prometheus server is a first component of Prometheus architecture.
- Prometheus server is a core of Prometheus architecture which is divided into several parts like Storage, PromQL, HTTP server, etc.
- In Prometheus server data is scraped from the target nodes and then stored in the database.
1.a. Storage
- Storage in Prometheus server has a local on disk storage.
- Prometheus has many interfaces that allow integrating with remote storage systems.
1.b. PromQL
- Prometheus uses its own query language i.e. PromQL which is a very powerful querying language.
- PromQL allows the user to select and aggregate the data.
2. Service Discovery
- Next and very important component of Prometheus Server is the Service Discovery.
- With the help of Service discovery the services are identified which need to be scraped.
- To Pull metrics, identification of services and finding the targets are compulsory needed.
- Through Service discovery we monitor the entities and can also locate its targets.
3. Scrape Target
- Once the services are identified and the targets are ready then we can pull metrics from it and can scrape the target.
- We can export the data of the end point using node exporters.
- Once the metrics or other data is pulled, Prometheus stores it in a local storage.
4. Alert Manager
- Alert Manager handles the alerts which may occurs during the session.
- Alert manager handles all the alerts which are sent by the Prometheus server.
- Alert manager is one of the very useful components of the Prometheus tool.
- If in case any big error or any issue occurs, alert manager manage those alerts and contact with human via E-mail, Text Messages, On-call, or any other chat application service.
5. User Interface
- User interface is also an important component as it builds a bridge between the user and the system.
- In Prometheus, user interfaces are note that much user friendly and can be used till graph queries.
- For good exclusive dashboards Prometheus works together with Grafana (visualization tool).
- Using Grafana over Prometheus to visualize properly we can use custom dashboards.
- Grafana dashboards display via pie charts, line charts, tables, good data graphs of CPU usage, RAM utilization, network load, etc with indicators.
- Grafana supports and run with Prometheus by querying language i.e. PromQL.
- To fetch data from Prometheus and to display the results on Grafana dashboards PromQL is used.
What is Grafana ?
- Grafana is a free and open source visualization tool mostly used with Prometheus to which monitor metrics.
- Grafana provides various dashboards, charts, graphs, alerts for the particular data source.
- Grafana allows us to query, visualize, explore metrics and set alerts for the data source which can be a system, server, nodes, cluster, etc.
- We can also create our own dynamic dashboard for visualization and monitoring.
- We can save the dashboard and can even share with our team members which is one of the main advantage of Grafana.
What is WMI Exporter?
- It is same like Node Exporter but Node Exporter for Linux and WMI Exporter for Windows
- WMI Exporter is an exporter utilized for windows servers to collects metrics like CPU usage, memory, and Disk usage.
- It is open-source which can be installed on Windows servers using the .msi installer
Prerequisite:
- Good internet connectivity
- Security Groups Configured properly
- Any web Browser
Security Groups Configured on EC2 Instances
- Port 9090 — Prometheus Server
- Port 9182—-WMI Exporter
- Port 3000 — Grafana
#1. Download Prometheus for windows
Now we will download the latest version of Prometheus. We can copy the download link as per our Operating System from Prometheus download page
Using the below command we can download Prometheus, here we are downloading Prometheus 2.32.1 version, you use the above link to download specific version.
![Install Prometheus and Grafana on Windows with WMI Exporter [4 Steps] 2](https://www.fosstechnix.com/wp-content/uploads/2021/12/download-prometheus.png)
We have to install prometheus service but in windows we can not installl prometheus as a service for that here im using NSSM package to install Prometheus service
Open your command prompt run as administrator
Paste the directory path like below command:
cd c:\users\Administrator\Downloads\nssm-2.24\nssm-2.24\win64
dir
nssm.exe install prometheus<<and your prometheus application directory path>> \prometheus
![Install Prometheus and Grafana on Windows with WMI Exporter [4 Steps] 3](https://www.fosstechnix.com/wp-content/uploads/2021/12/install-prometheus-on-window.png)
Now Prometheus is successfully installed in your machine
So let’s check the status in prometheus service on windows.
![Install Prometheus and Grafana on Windows with WMI Exporter [4 Steps] 4](https://www.fosstechnix.com/wp-content/uploads/2021/12/start-prometheus.png)
For now Prometheus is stop after changing in configuration file we will start prometheus
After installation now we are going to install Grafana on Window
#2. Install Grafana on Windows
Now we will download the latest version of Grafana.from official page of Grafana select window operating system and download .msi installer
![Install Prometheus and Grafana on Windows with WMI Exporter [4 Steps] 5](https://www.fosstechnix.com/wp-content/uploads/2021/12/download-grafana.png)
After download of grafana we will install grafana on window
![Install Prometheus and Grafana on Windows with WMI Exporter [4 Steps] 6](https://www.fosstechnix.com/wp-content/uploads/2021/12/install-grafana.png)
After installation of Grafana go to C:<<Program Files<<GrafanaLabs<<Grafana<< conf<<defaults
In default change the smtp enabled false replace with true you can check the below image
![Install Prometheus and Grafana on Windows with WMI Exporter [4 Steps] 7](https://www.fosstechnix.com/wp-content/uploads/2021/12/smtp.png)
To access Grafana Dashboard open your favorite browser, type server IP or Name followed by grafana default port 3000.
http://localhost:3000
Here you can see Login page of Grafana now you will have to login with below Grafana default UserName and Password.
Username – admin
Password – admin
![Install Prometheus and Grafana on Windows with WMI Exporter [4 Steps] 8](https://www.fosstechnix.com/wp-content/uploads/2021/12/login-to-grafana-2.png)
It is always a good practice to change your login credentials.
![Install Prometheus and Grafana on Windows with WMI Exporter [4 Steps] 9](https://www.fosstechnix.com/wp-content/uploads/2021/12/enter-new-pass-to-grafana-2.png)
Provide your New Password and click on Change Password
Now here you can see Home Dashboard page of Grafana
![Install Prometheus and Grafana on Windows with WMI Exporter [4 Steps] 10](https://www.fosstechnix.com/wp-content/uploads/2021/12/welcome-grafana-1024x411.png)
#3. Install WMI Exporter on Windows
For Windows hosts, you are going to use the Windows exporter.
You can download the latest version of windows installer from here
![Install Prometheus and Grafana on Windows with WMI Exporter [4 Steps] 11](https://lh5.googleusercontent.com/P-A3mo7sQnJeadI70TMXHcfFvCqNtCzQFCAbS47PNTAAMhnwWllBnXmuE7UGsvr-UEfzBnUE2mDcAgZgrpBEvCwQ0h9Z5ZQTn9vwemD50Zga0YASxGGONPpav8Guf0Bjfee3GLto)
When the download is done, simply click on the MSI file and start running the installer.
![Install Prometheus and Grafana on Windows with WMI Exporter [4 Steps] 12](https://www.fosstechnix.com/wp-content/uploads/2021/12/install-wmi-exporter-3.png)
After Installation of WMI Exporter lets check its successfully installed or not
So go to services and search windows exporter.
Make sure windows exporter service is running.
![Install Prometheus and Grafana on Windows with WMI Exporter [4 Steps] 13](https://lh3.googleusercontent.com/TwtBQ5zzQMZWVtRHhxnW6ePpOCyUTaYdEIGIvP8OvmbPLHpdcahHFtuEwdhpzFRXMdM4ey4e3AEPogFb9xLwvf5RkBnaP9Tv7SOPiyoeX7kmC9o0zRLqYYGmkOWROOvEcu5gVXdB)
Now that your exporter is running, it should start exposing metrics on
http://localhost:9182/metrics
So let’s check
![Install Prometheus and Grafana on Windows with WMI Exporter [4 Steps] 14](https://lh5.googleusercontent.com/20vXeHCqmM7IwZrrkJ3EE-2yTFB5ieOy6suaHqO2NeIkdYAKOGbuvDk3EMyJ6lITucfmsamu1c-E3XTCht7SmAQY_9p4xqeSd3by2opFtdsjoHr_WaPhz5Wi8c5HhlnOLC32wE2e)
#4. Update Prometheus Configuration file
Go to the Prometheus file and open Prometheus.yml file and
Update config file with below code:
 - job_name: "WMI Exporter"

    # metrics_path defaults to '/metrics'
    # scheme defaults to 'http'.

    static_configs:
      - targets: ["Host_ip:9182"]
Now save the file and exit
After changing in config file you need to start prometheus server
So go the services and start the Prometheus Server
![Install Prometheus and Grafana on Windows with WMI Exporter [4 Steps] 15](https://www.fosstechnix.com/wp-content/uploads/2021/12/prometheus-start-1.png)
Hit the URL in your web browser to check weather our target is successfully scraped by Prometheus or not
https://localhost:9090/targets
![Install Prometheus and Grafana on Windows with WMI Exporter [4 Steps] 16](https://www.fosstechnix.com/wp-content/uploads/2021/12/prometheus-target-1024x378.png)
#4. Configure Prometheus as Grafana DataSource
Once you logged into Grafana Now first Navigate to Settings Icon ->> Configuration ->> data sources
![Install Prometheus and Grafana on Windows with WMI Exporter [4 Steps] 17](https://www.fosstechnix.com/wp-content/uploads/2021/12/configuration-on-grafana-2-1024x415.png)
Now lets click on Add Data sources and select Prometheus
![Install Prometheus and Grafana on Windows with WMI Exporter [4 Steps] 18](https://www.fosstechnix.com/wp-content/uploads/2021/12/add-data-source-4-1024x576.png)
Now configure Prometheus data source by providing Prometheus URL
![Install Prometheus and Grafana on Windows with WMI Exporter [4 Steps] 19](https://www.fosstechnix.com/wp-content/uploads/2021/12/config-grafana.png)
As per your requirement you can do other changes or you can also keep remaining configuration as default.
Now click on Save & test so it will prompt a message Data Source is working.
![Install Prometheus and Grafana on Windows with WMI Exporter [4 Steps] 20](https://www.fosstechnix.com/wp-content/uploads/2021/12/data-source-is-working-2-1024x369.png)
#5.Creating Grafana Dashboard to monitor Windows server
Now lets build a dashboard in Grafana so then it will able to reflect the metrics of the Windows system.
So we will use 14510 to import Grafana.com, Lets come to Grafana Home page and you can see a “+” icon. Click on that and select “Import”
![Install Prometheus and Grafana on Windows with WMI Exporter [4 Steps] 21](https://www.fosstechnix.com/wp-content/uploads/2021/12/import-grafana-to-linux-server-5-1024x399.png)
On the next window, simply enter the dashboard ID in the corresponding field
![Install Prometheus and Grafana on Windows with WMI Exporter [4 Steps] 22](https://www.fosstechnix.com/wp-content/uploads/2021/12/import-14510-for-windows-2.png)
Now provide the name and select the Prometheus Datasource and click on Import.
![Install Prometheus and Grafana on Windows with WMI Exporter [4 Steps] 23](https://www.fosstechnix.com/wp-content/uploads/2021/12/importing-dashboard-for-windows-2.png)
There you are done with the setup. Now your Dashboard is running up!.
![Install Prometheus and Grafana on Windows with WMI Exporter [4 Steps] 24](https://lh5.googleusercontent.com/iUQsRMHEZkGApqQFlqOiB2tcXsvzRExSaqI2IOq94hA-uKViW7sbBB5riu-tdiXCLL3z0RNU0zXiw3fs7QR_Vh4D9V450cskeWpWBFYep45Ug4lW_02FXVCF7tePmLNWVvpwDar_)
Conclusion:
In this article we have covered How Install Install Prometheus and Grafana on Windows with WMI Exporter, Configure Prometheus as Grafana DataSource.
Related Articles:
- Install Prometheus and Grafana on Ubuntu 20.04 LTS
- Kubernetes cluster Monitoring with Prometheus and Grafana.
- How to Install Nagios Core on CentOS 7
Уровень сложности
Простой
Время на прочтение
5 мин
Количество просмотров 9.3K
Немного расскажу про установку Grafana на windows и настройку базовых метрик системы.
Пару слов о самой Grafana и для чего она нужна.
Grafana – это платформа для мониторинга, анализа данных и визуализации собранных данных с открытым исходным кодом. По сути она используется для визуального представления собранных метрик для более комфортного слежения за состоянием системы.
В данной статье буду использовать:
-
Grafana
-
Prometheus
-
Windows_exporter
-
Blackbox_exporter
Для начала скачаем актуальный дистрибутив самой Grafana и установим его (Для скачивания, может потребоваться VPN).
Переходим по ссылке: https://grafana.com/grafana/download и выбираем необходимую версию для скачивания.

Затем скачаем и установим Prometheus.
Prometheus по сути является сборщиком метрик. Установив на один пк, который будет выступать в качестве сервера для Grafana, достаточно будет только запускать сбор метрик с других машин (вносить соответствующий блок в файл конфигурации Prometheus), а Prometheus в свою очередь подготовит метрики уже для самой Grafana.
Prometheus: https://prometheus.io/download
Для установки потребуется NSSM — это сервисный помощник, который помогает установить служебные вспомогательные программы.
Ссылка NSSM: https://www.nssm.cc/download
Приступим к установке Prometheus.
Переходим в CMD и вводим следующие команды (запускаем CMD от админа):
-
Переходим в директорию с пакетом NSSM:
cd C:\GrafanaSetup\nssm-2.24\win64 -
Выполняем установку сервиса Prometheus:
nssm.exe install prometheus C:\GrafanaSetup\prometheus-2.43.0.windows-amd64\prometheus.exe

На данном этапе служба Prometheus должны быть установлена, Далее установим службы для сбора метрик.
Установим Windows_exporter – сборщик метрик, который как раз собирает статистику с системы и составляет своего рода «логи».
Ссылка для скачивания Windows exporter: https://github.com/prometheus-community/windows_exporter/releases
Выбираем подходящую нам версию и устанавливаем

После установки, так же проверяем в службах, что установка прошла успешно и служба запущена (название службы по умолчанию windows_exporter).
Теперь можно проверить сбор метрик по ссылке к порту службы: http://localhost:9182/metrics

На данном этапе можем установить Blackbock exporter — используется для мониторинга статуса доступности URL-ов. Переходим по ссылка и скачиваем нужную нам версию Blackbox: https://prometheus.io/download/ и устанавливаем.

Теперь приступим к настройке установленных сервисов.
Начинаем с Grafana:
Переходим в папку C:\Program Files\GrafanaLabs\grafana\conf и открываем файл defaults.ini при помощи текстового редактора и меняем значение в блоке smtp в поле enabled на true и сохраняем изменения. Запускаем службу Grafana, если она уже запущена, просто делаем перезапуск для вступления изменений в силу.

Перейдя по ссылке: http://localhost:3000 увидим активный интерфейс Grafana. Для входа по умолчанию используется комбинация admin / admin, затем попопросит Вас изменить пароль и направит на домашнюю страницу управления Grafana.
Далее приступаем к настройке Prometheus:Нам необходимо внести изменения в конфигурацию, включив метрики в конфиг. Для этого переходим в каталог prometheus») и открываем файл prometheus.yml и вносим следующие изменения:
Добавляем блок для подключения windows_exporter:
- job_name: "Любое комфортное имя"

      static_configs:

            #IP-адрес и порт, где собираются метрики window_exporter\

            - targets: ["localhost:9182”]
При добавлении нескольких машин, можно добавить блок lables, который изменит отображаемый IP-адрес на свое описание:
  static_configs:

      - targets: ["localhost:9182"]

        labels:

            instance: Server-1

      - targets: ["192.168.0.254:9182"]

        labels:

            instance: Server-2
Сразу добавим блок для blackbox_exporter:
- job_name: 'blackbox'

      metrics_path: /probe

      params:

            module: [http_2xx]  # Look for a HTTP 200 response.

    static_configs:

      - targets:

            -https://youtube.com

            -https://google.com

    relabel_configs:

      - source_labels: [__address__]

            target_label: __param_target

      - source_labels: [__param_target]

            target_label: instance

      - target_label: __address__

            replacement: localhost:9115  # The blackbox exporter's real hostname:port
В блоке targets перечисляем необходимые URL-адреса.
Только обратите внимание, для того, что бы блок корректно заработал и не было ошибок при запуске службы, необходимо строго соблюдать табуляцию строк.
Добавив необходимые блоки можем запускать prometheus.
Затем убедитесь, что все службы запущены:
-
Grafana
-
Prometheus
-
Windows_ exporter
-
Blackbox_exporter
и теперь проверяем статус сервисов по ссылке: http://localhost:9090/targets

В целом мы настроили базовые метрики, осталось включить отображение метрик в Grafana.
Переходим на главную страницу grafana ( По умолчанию: http://localhost:3000 ).
Подключаем источник данных Prometheus:
На главной странице, переходим в меню Data sources

Выбираем наш Prometheus

И указываем наш URL. В нашем случае, всё находится на одной локальной машине и можем прописывать через формат: http://localhost:port/

И нажимаем кнопку: Save & test

Теперь необходимо настроить панели мониторинга для метрик windows exporter. Для настройки переходим на главную страницу и добавляем панель:

На момент написания статьи, нашёл два наиболее охватывающих Dashboard`а:
-
14510
-
14694
Можете использовать их или же настроить всё самостоятельно.
Для добавления Dashboard`а указываем в поле ID и нажимаем на кнопку Load.

Затем нас направляет на панель настроек, где мы указываем источник данных Prometheus и можем изменить имя самой панели. Затем жмём кнопку Import
И у нас уже готовая, настроенная панель мониторинга, которую уже можно добавлять необходимым функционалом. Не нужные графики можно удалить или расставить в нужном для себя порядке.

При добавлении новых пк для мониторинга, достаточно внести строки в конфигурационный файл Prometheus.yml и перезапустить службу Prometheus. Служба самостоятельно разберёт метрики и добавить новый пк к мониторингу на уже готовый dashboard, где уже не составит труда переключаться между пк.
Далее уже можно поиграть с конкретными метриками, и отображением конкретных служб с различных машин. К примеру: На главном экране нажимаем ADD > Visualization и попадаем в меню создания панели. В поле Metrics browser вносим выбранную метрику и указываем параметры, которые хотим получить (ну или отобразить). Сделаем на примере службы windows:
-
Name — имя службы
-
State — вид статуса, который относится к метрике windows_service_state
-
Instance — с какой конкретной машины брать метрику.
windows_service_state{name="нужная служба", state="running", instance="Server-1"}
и в правом верхнем углу выбираем нужный вид панели, в моем случае это Stat:

В параметрах панели в меню Value mappings и меняем цифровые значения метрик на удобные для восприятия слова, к примеру: Ok/Bad Up/Down.

Сохраняем и получаем такую панель :

Ну и настроим метрику для получения статусов HTTP:
Используем метрику: probe_http_status_code и настроим Value mapping:
probe_http_status_code{instance="https://youtube.com"}

И в итоге получаем такую панель:

Далее можно самостоятельно зайти в http://localhost:9090/targets выбрать нужные для своих задач метрики и настроить нужные под свои задачи.
Думаю, на этом можно закончить. Базовая настройка не так сложна, но когда ты сталкиваешься с этим в первый раз, могут возникнуть трудности, поэтому хотел поделиться пошаговой настройкой. Надеюсь, кому-то это поможет и сократить достаточно времени на поиске информации и первичной настройки.
Automatically launch Prometheus in the background when your computer reboots. Make sure that your monitoring & alerting is always running, 24/7
- If necessary, install and configure Prometheus. …
- Download and install AlwaysUp, if necessary.
- Start AlwaysUp.
- Select Application > Add to open the Add Application window:
- Can Prometheus run on Windows?
- How do I install Prometheus?
- How do I monitor windows with Prometheus?
- How do I install Prometheus and Grafana?
- Is Prometheus pull or push?
- How does Prometheus scraping work?
- How do I know if Prometheus is installed?
- Where is Prometheus data stored?
- Is Prometheus free?
- How do I access Prometheus database?
- How often does Prometheus scrape?
- How do you push metrics in Prometheus?
Can Prometheus run on Windows?
The Prometheus server is a single binary called prometheus (or prometheus.exe on Microsoft Windows). We can run the binary and see help on its options by passing the —help flag. … Before starting Prometheus, let’s configure it.
How do I install Prometheus?
Setup Prometheus
- Visit Prometheus download page. It will give you a list of pre-compiled binaries for drawins, linux, and windows. …
- Step 2: Extract The Tar. tar -xvzf prometheus-2.11.1.linux-amd64.tar.gz.
- Step 3: After Extraction Steps. …
- Step 4: Execute The Binary File Using The Below Command: …
- Step 5: Run Prometheus As A Service.
How do I monitor windows with Prometheus?
Configure Prometheus in accordance to WMI exporter
- Add your windows targets to this file —
- # cat /etc/prometheus/file_sd/wmi.yml.
- Configure Alert Rules —
- Verify your configuration —
- Now you can Create a Grafana Dashboard as well and monitor the metrics.
How do I install Prometheus and Grafana?
Installing Grafana
- Click on the Grafana logo to open the sidebar.
- Click on “Data Sources” in the sidebar.
- Choose “Add New”.
- Select “Prometheus” as the data source.
- Click “Add” to test the connection and to save the new data source.
Is Prometheus pull or push?
Prometheus by design implements a pull-based approach for collecting metrics. For most of us, this is a departure from the push-based monitoring systems we’ve been using for the past decade.
How does Prometheus scraping work?
On the Prometheus server side, each target (statically defined, or dynamically discovered) is scraped at a regular interval (scrape interval). Each scrape reads the /metrics to get the current state of the client metrics, and persists the values in the Prometheus time-series database.
How do I know if Prometheus is installed?
check-node_exporter.
To verify the Prometheus server installation, open your browser and navigate to http://localhost:9090. You should see the Prometheus interface. Click on Status and then Targets. Under State, you should see your machines listed as UP.
Where is Prometheus data stored?
Prometheus stores its on-disk time series data under the directory specified by the flag storage.
Is Prometheus free?
Prometheus is a free software application used for event monitoring and alerting. It records real-time metrics in a time series database (allowing for high dimensionality) built using a HTTP pull model, with flexible queries and real-time alerting.
How do I access Prometheus database?
Prometheus is primarily a monitoring system, so there is no direct database access as that is not required for monitoring. You can build your own on top of its tsdb.
How often does Prometheus scrape?
Prometheus is configured to scrape metrics every 20 seconds, and the evaluation interval is 1 minute.
How do you push metrics in Prometheus?
Pushing metrics
- For more information on using the Pushgateway and use from a Unix shell, see the project’s README.md.
- For use from Java see the PushGateway class.
- For use from Go see the Push and Add methods.
- For use from Python see Exporting to a Pushgateway.
- For use from Ruby see the Pushgateway documentation.
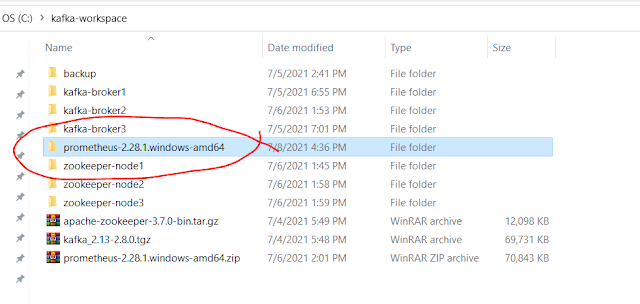
Prometheus is an open-source system monitoring and
alerting toolkit.
Download and Extract
Go to Prometheus download page and download latest
version.
https://prometheus.io/download/
Direct Links as follows
https://github.com/prometheus/prometheus/releases/download/v2.28.1/prometheus-2.28.1.windows-amd64.zip
Extract in local Drive
Start “Prometheus”
Open command prompt and locate to “Prometheus” root
directory. Use following start command and pass web listen address and config
file default Prometheus yml file as options.
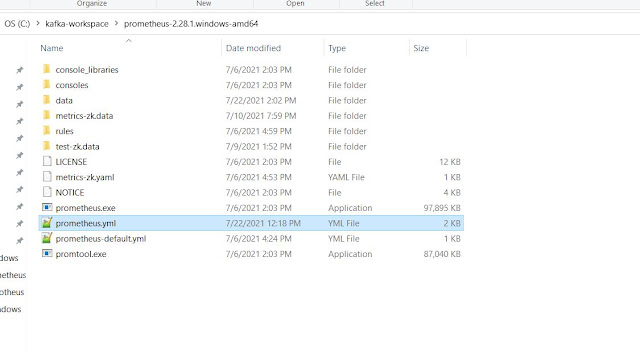
prometheus.exe
—config.file prometheus.yml —web.listen-address «:9090»
—storage.tsdb.path «data»
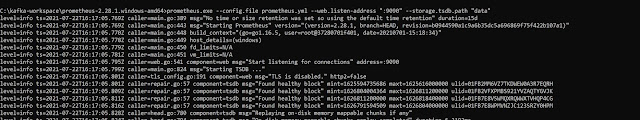
Verify Installation
Access “Prometheus” web interface with
following URL and its running on 9090 port.

Targets Status
Go to Status menu and click on targets so we can see
Prometheus health.
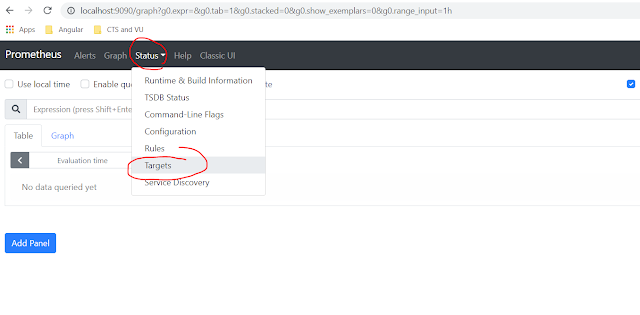
Prometheus health.