В данной статье показаны способы, с помощью которых можно открыть «Просмотр событий» (журнал событий) в операционной системе Windows 10.
Просмотр событий — это средство просмотра журналов системы в котором производится регистрация всех основных событий, которые происходят в системе с последующей их записью. Записываются ошибки, предупреждения и просто различные уведомления. На основе этих событий пользователи могут найти полезную информацию для устранения неисправностей, обнаружения причин проблем с системой, приложениями и оборудованием компьютера.
Оснастка «Просмотр событий» содержит различные журналы событий, такие как журнал системы, безопасности, приложений и другие.
Журналы событий представляют собой набор файлов с расширением *.evtx, которые хранятся в системном каталоге по следующему пути: %SystemRoot%/System32/Winevt/Logs
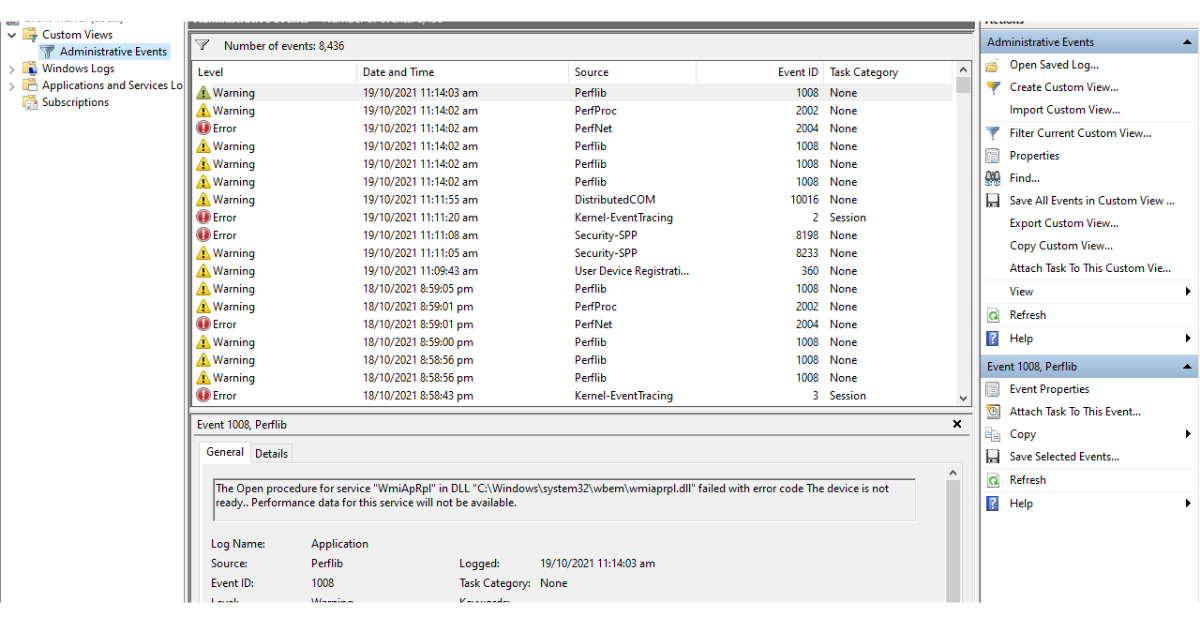
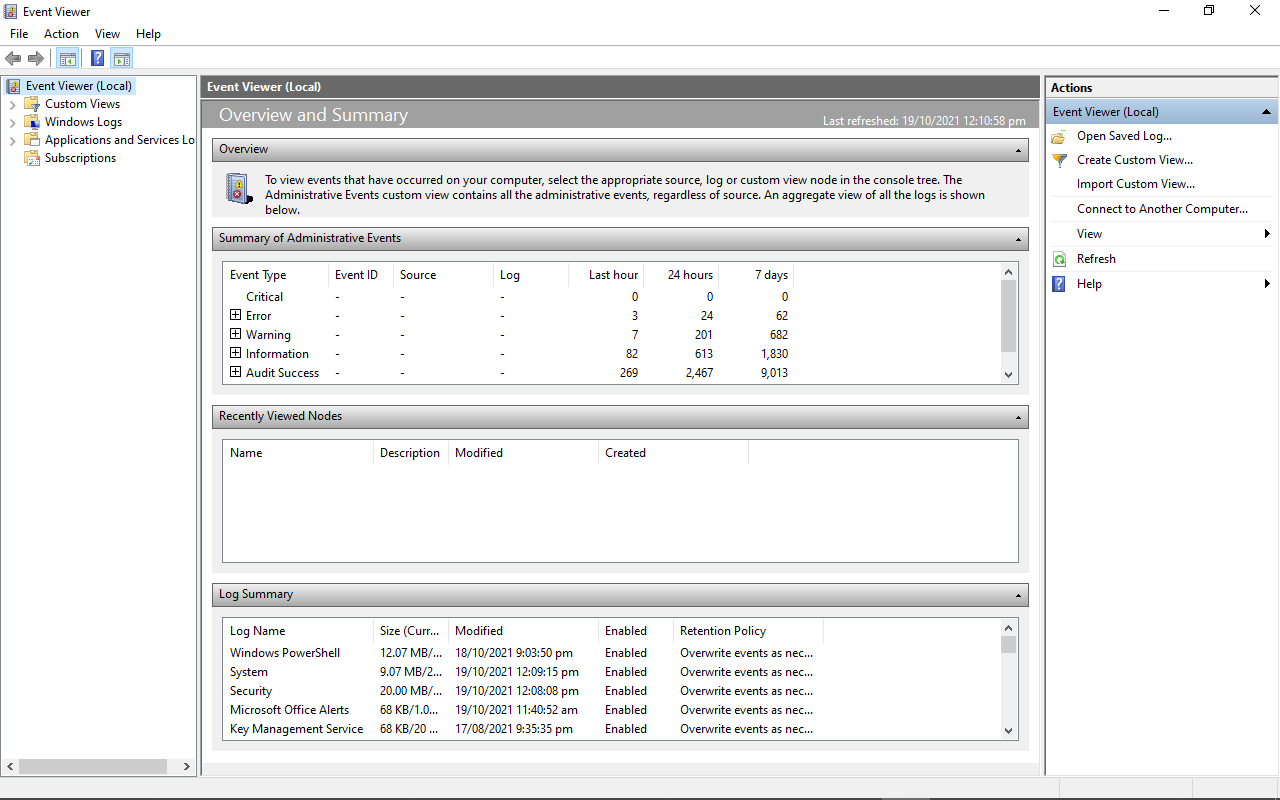
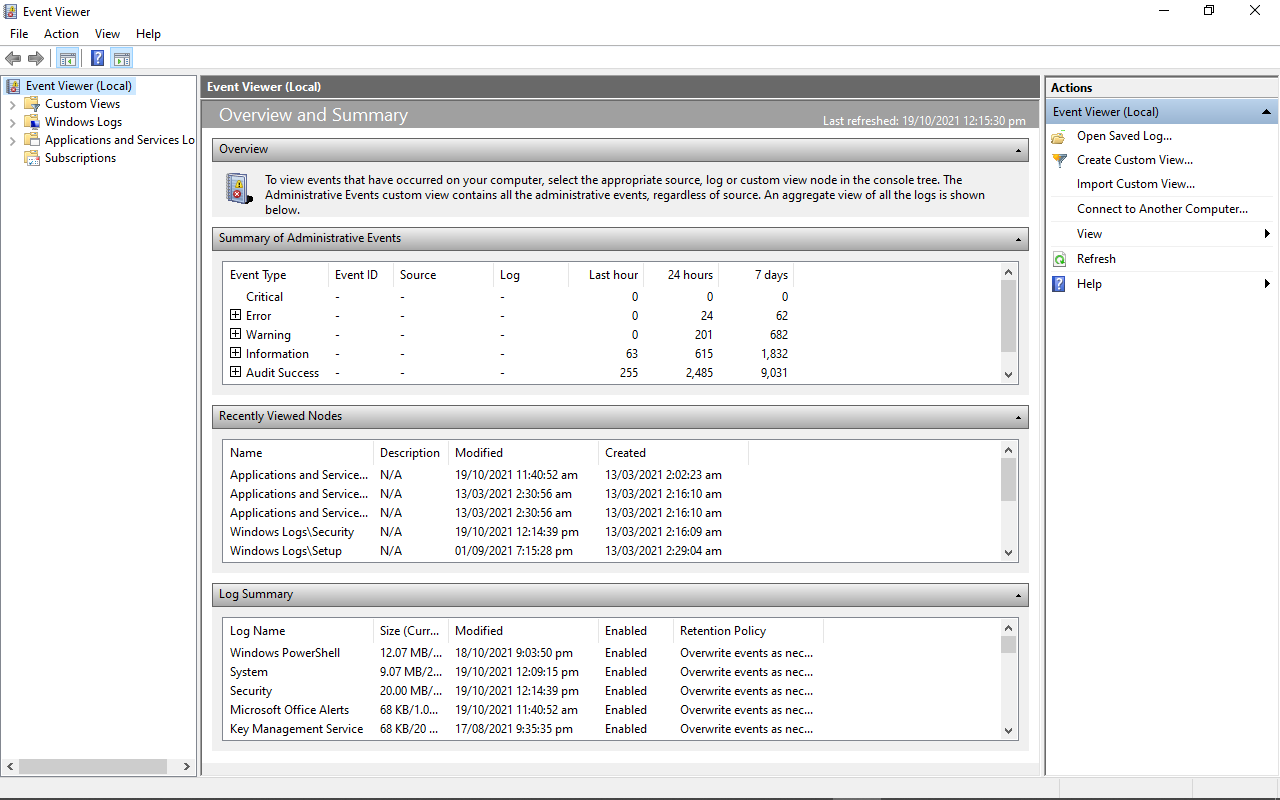
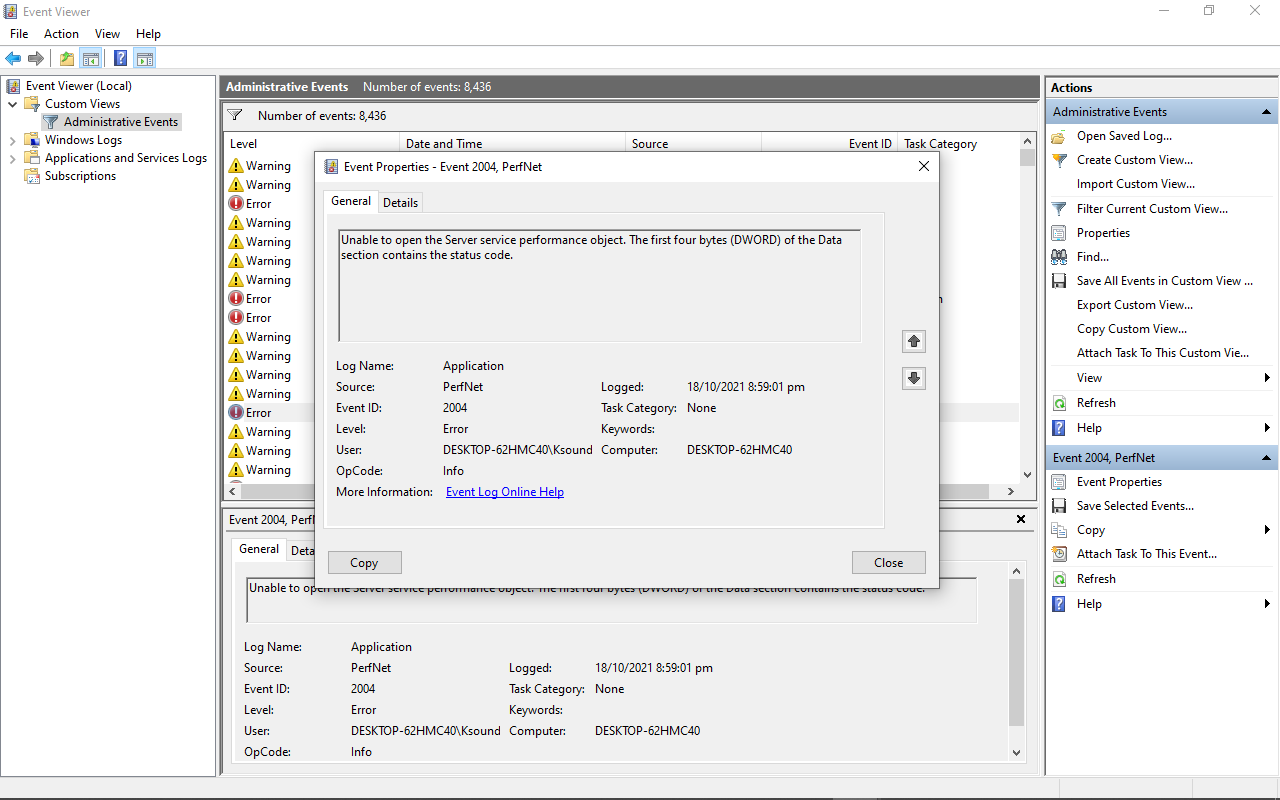
Пример оснастки «Просмотр событий» показан на скриншоте ниже.

Содержание
- Как открыть «Просмотр событий» в окне «Выполнить»
- Как открыть «Просмотр событий» используя «Поиск»
- Как открыть «Просмотр событий» используя «Средства администрирования Windows»
Как открыть «Просмотр событий» в окне «Выполнить»
Чтобы открыть оснастку «Просмотр событий», нажмите сочетание клавиш ![]() + R, в открывшемся окне Выполнить введите (скопируйте и вставьте) eventvwr.msc и нажмите клавишу Enter ↵.
+ R, в открывшемся окне Выполнить введите (скопируйте и вставьте) eventvwr.msc и нажмите клавишу Enter ↵.

Как открыть «Просмотр событий» используя «Поиск»
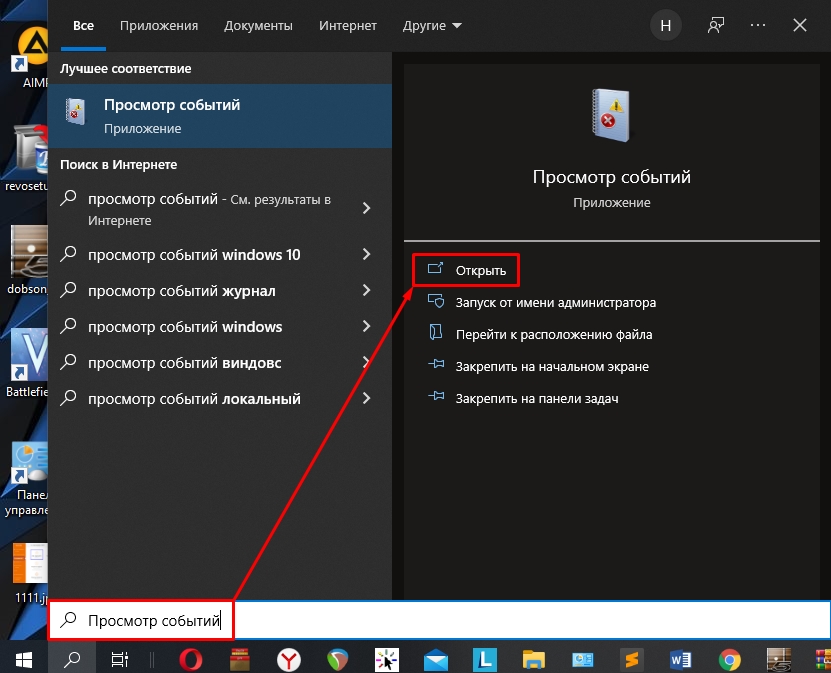
Чтобы открыть оснастку «Просмотр событий», используйте «Поиск в Windows», для этого нажмите на значок поиска ![]() в панели задач или нажмите сочетание клавиш
в панели задач или нажмите сочетание клавиш ![]() + S, в строке поиска начните вводить eventvwr или просмотр и в результатах поиска выберите Просмотр событий.
+ S, в строке поиска начните вводить eventvwr или просмотр и в результатах поиска выберите Просмотр событий.

Как открыть «Просмотр событий» используя «Средства администрирования Windows»
Откройте «Средства администрирования Windows» любым из способов и в папке «Администрирование» выберите Просмотр событий.

Используя рассмотренные способы, можно открыть оснастку «Просмотр событий» в операционной системе Windows 10.
The Windows 10 Event Viewer is an app that shows a log detailing information about significant events on your computer. This information includes automatically downloaded updates, errors, and warnings.
In this article, you’ll learn what the event viewer is, the different logs it has, and most importantly, how to access it on a Windows 10 computer.
What is the Event Viewer?
Each program you open on your Windows 10 computer sends a notification to a particular activity log in the Event Viewer.
All other activity such as OS changes, security updates, driver quirks, hardware failure, and so on are also posted to a particular log. So you can think of the event viewer as a database that records every activity on your computer.
With the event viewer, you can troubleshoot different Windows and application issues.
If you explore the event viewer in-depth, you will see different information, warnings, and plenty of errors. Don’t freak out – this is normal. Even the best-maintained computers show plenty of errors and warnings.
There are 3 main ways you can gain access to the event viewer on Windows 10 – via the Start menu, Run dialogue, and the command line.
Step 1: Click on Start or press the WIN (Windows) key on your keyboard
Step 2: Search for “Event Viewer”
Step 3: Click on the first search result or press ENTER
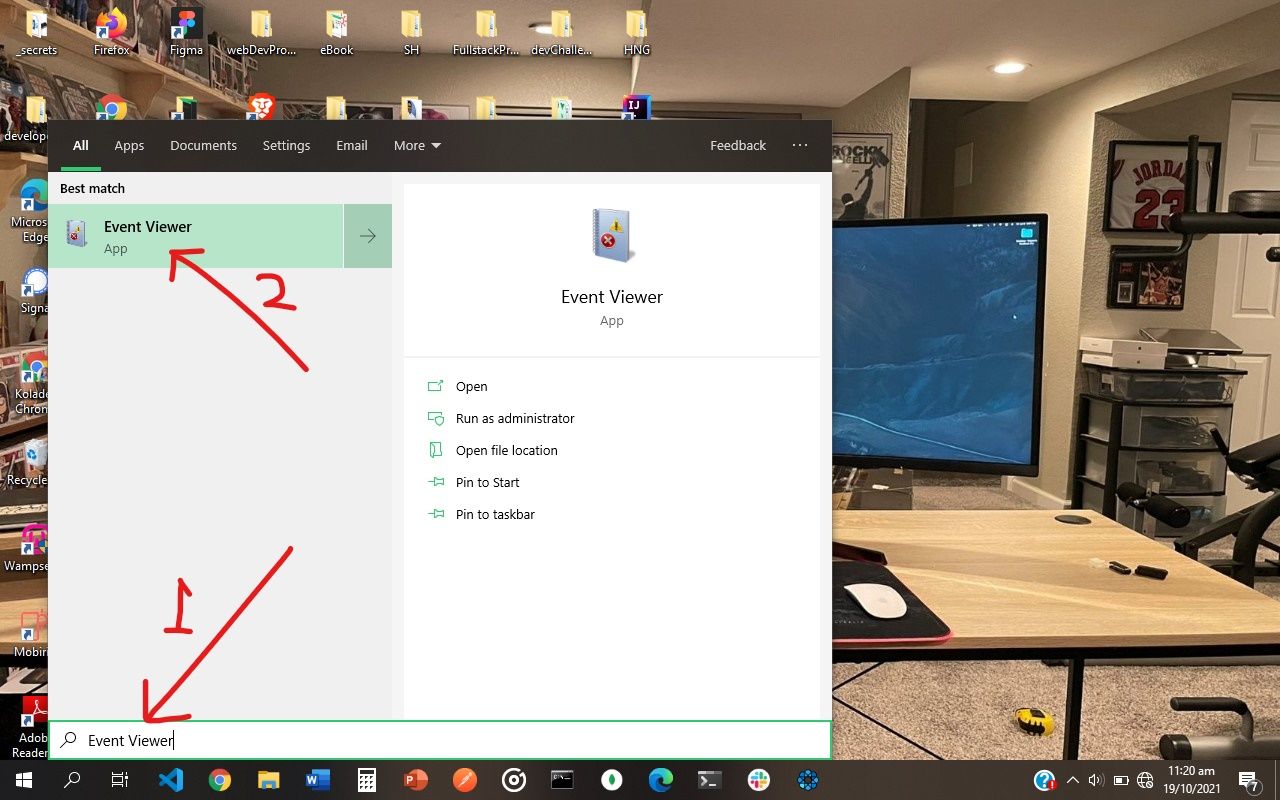
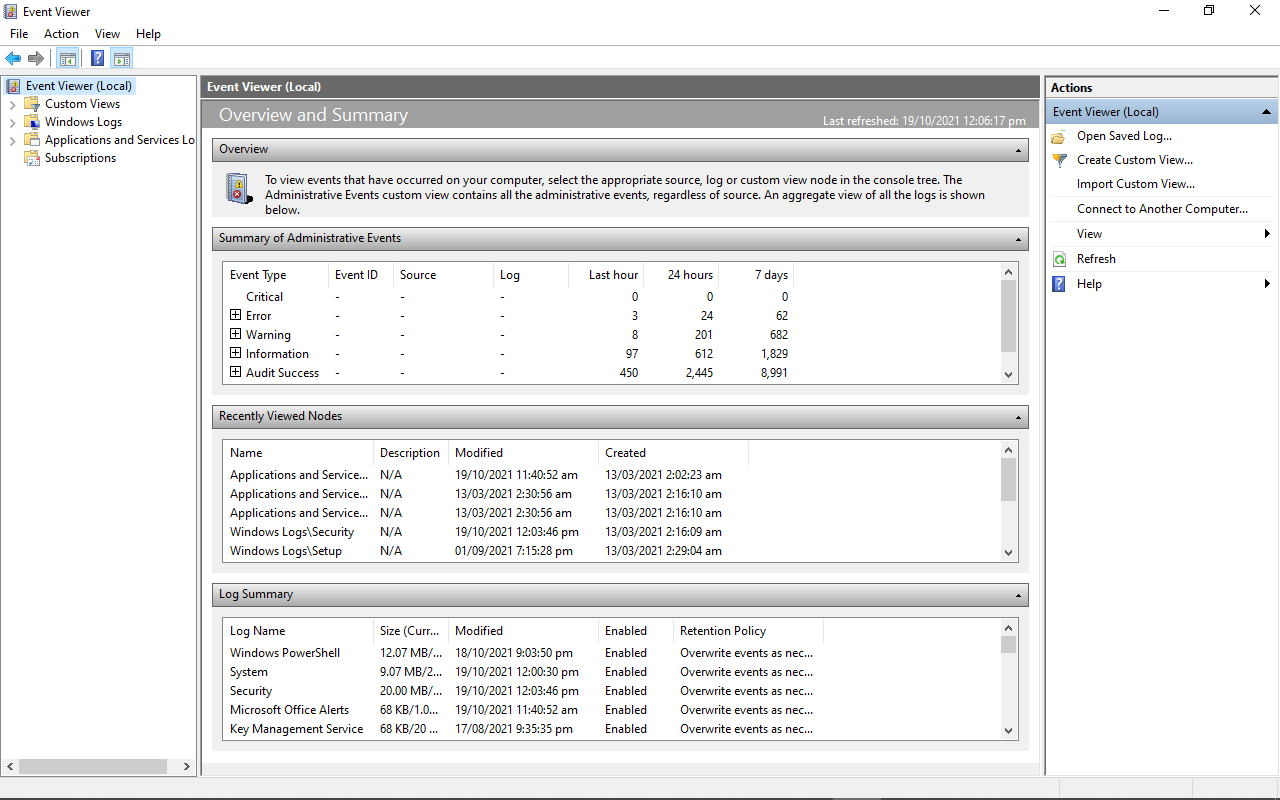
You will be greeted with this page:
How to Access the Windows 10 Activity Log through the Run Dialogue
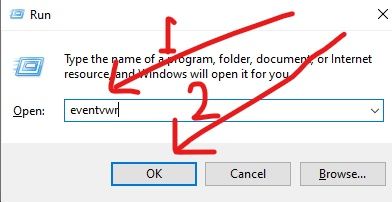
Step 1: Right-click on Start (Windows log) and select “Run”, or press WIN (Windows key) + R on your keyboard
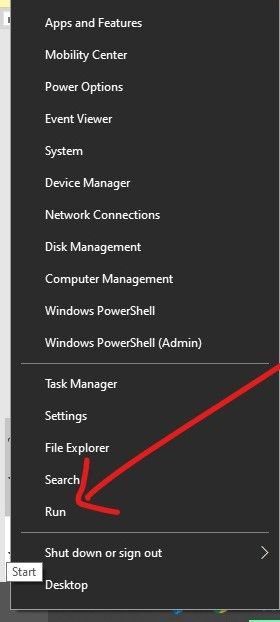
Step 2: Type in “eventvwr” to the editor and click “Ok” or hit ENTER
How to Access the Windows 10 Activity Log through the Command Prompt
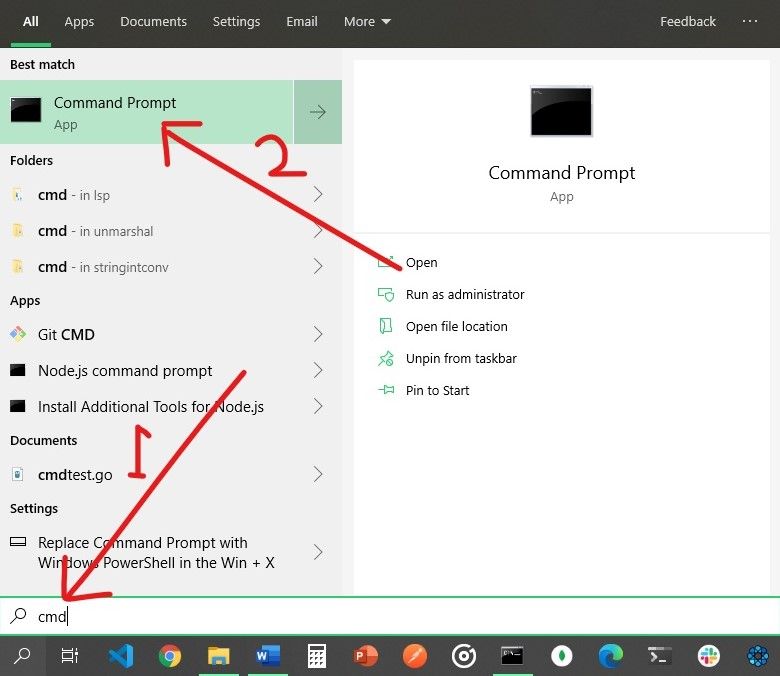
Step 1: Click on Start (Windows logo) and search for “cmd”
Step 2: Hit Enter or click on the first search result (should be the command prompt) to launch the command prompt
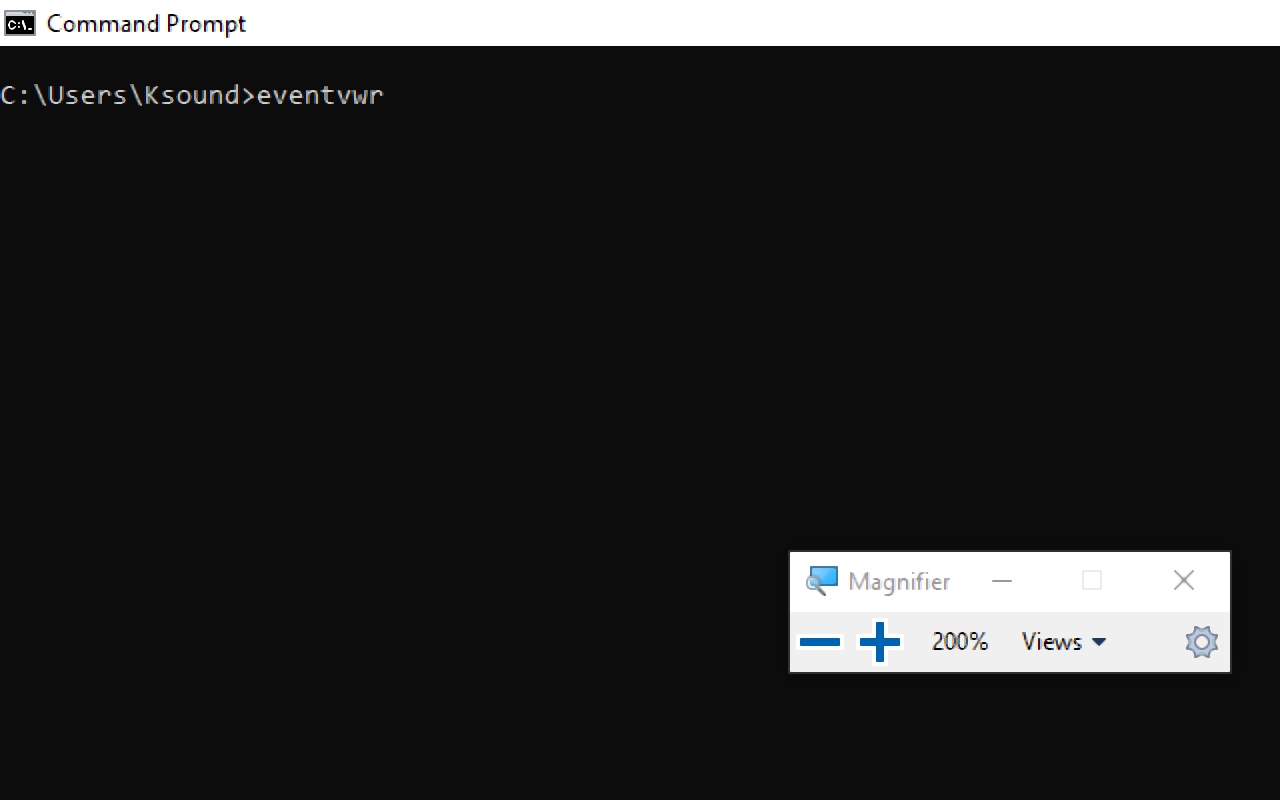
Step 3: Type in “eventvwr” and hit ENTER
Event Viewer Activity Logs
When you open the event viewer to see your computer’s activity logs, you are automatically shown the Event Viewer (Local) tab. But this might not contain the details you need, as it’s just a page you are greeted with when you open the Event Viewer.
There is lots more to the Event Viewer than this.
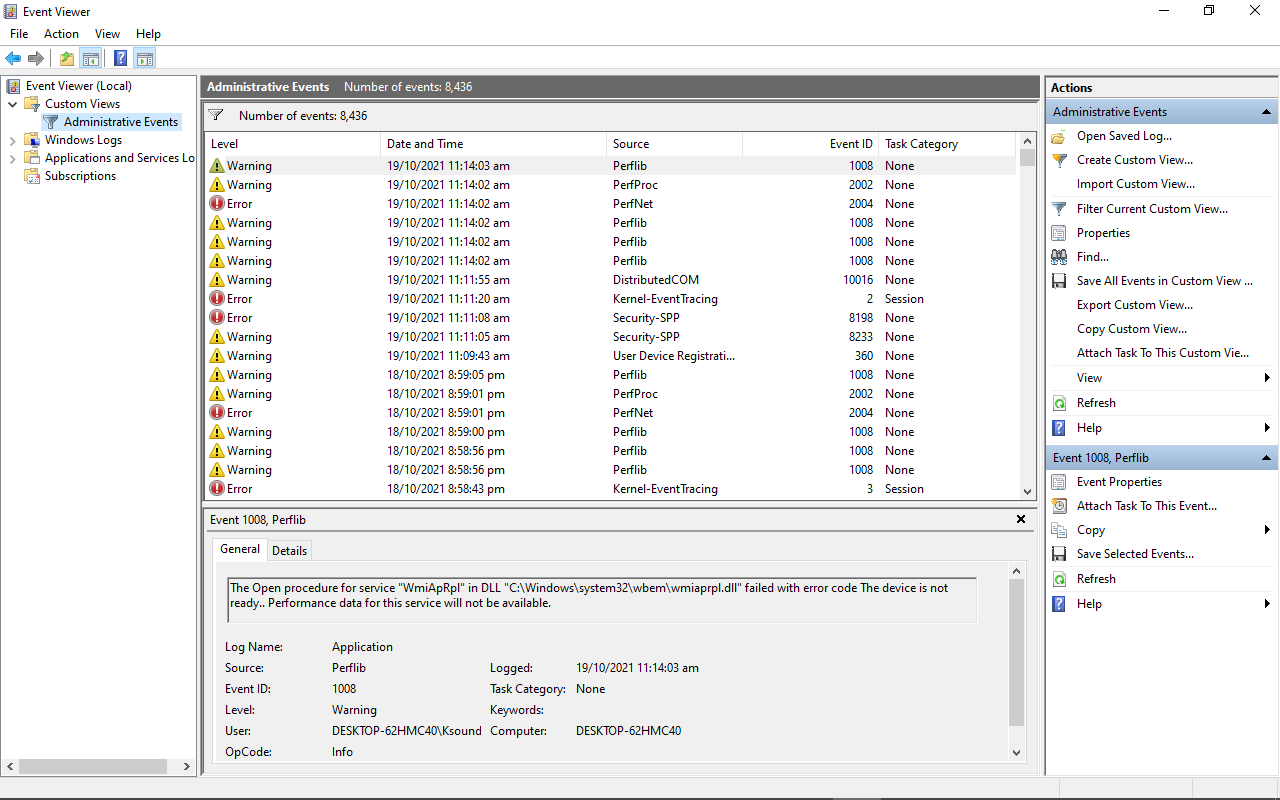
The Administrative Events Log
You can expand the Custom Views tab to see your computer’s administrative events, like this:
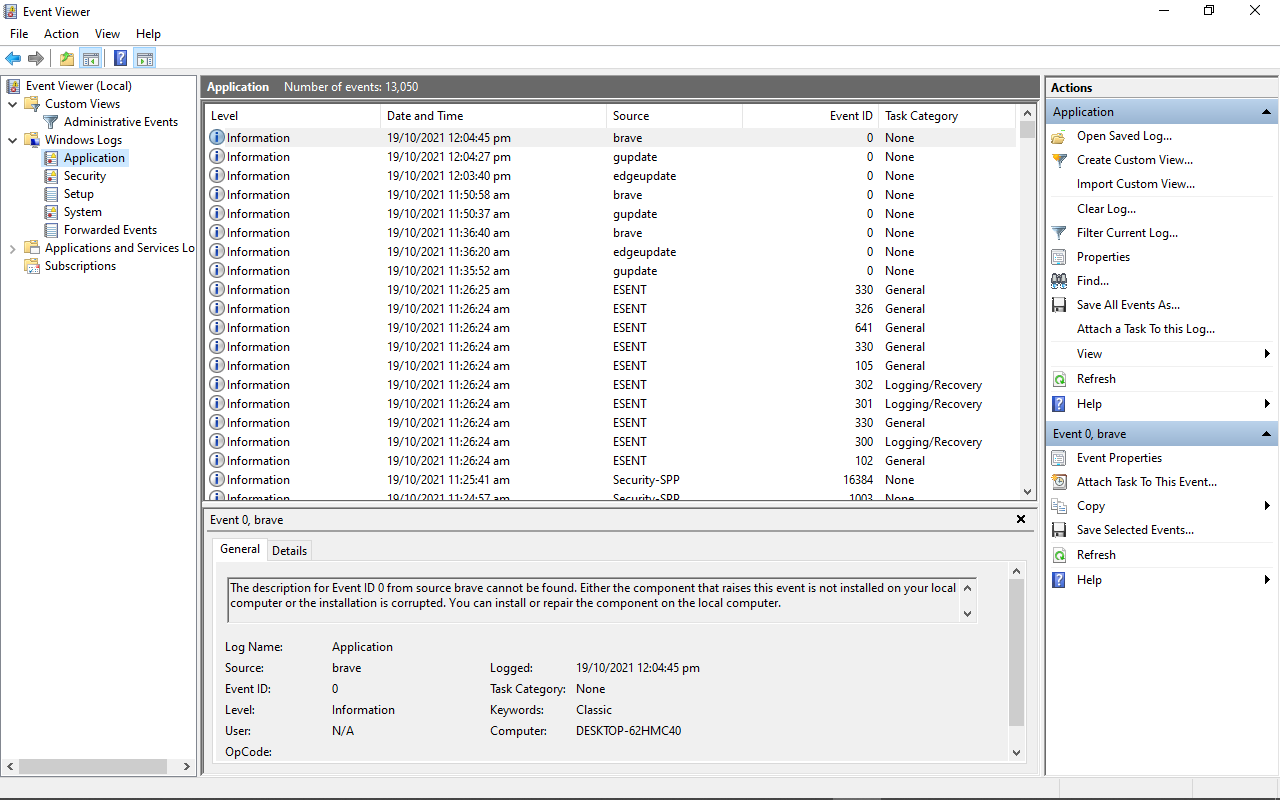
The Windows Activity Logs
You can also expand the Windows Logs to show various activities such as:
-
Application Events: Information, errors, and warning reports of program activities

-
Security Events: This shows the results of various security actions. They are called audits and each of them can be a success or a failure
-
Setup Event: this has to do with domain controllers, which is a server that verifies users on computer networks. You shouldn’t worry about them day-to-day.
-
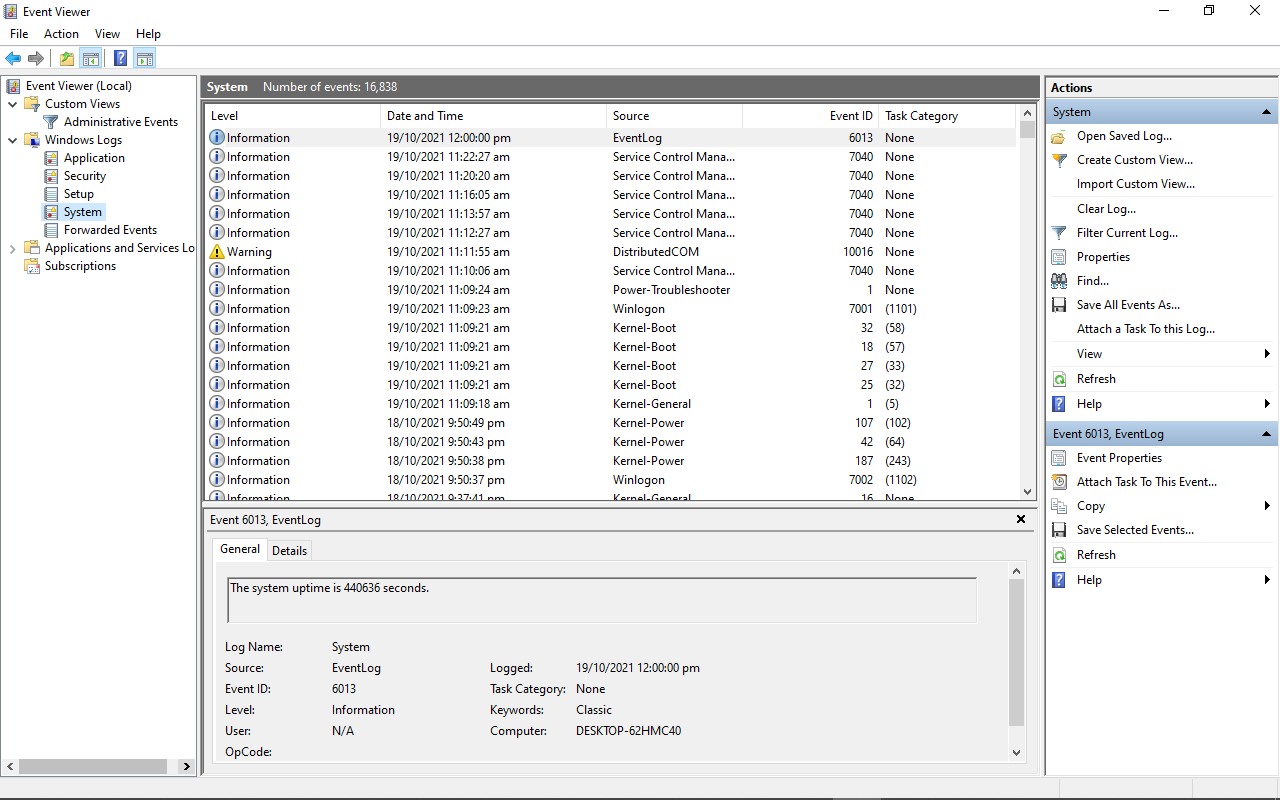
System Events: these are reports from system files detailing the errors they have encountered
-
Forwarded Events: these are sent to your computer from other computers in the same network. They help you keep track of the event logs of other computers in the same newtwork.


In addition, there are the Application and Service logs, which show hardware and Internet Explorer activities, alongside Microsoft Office apps activities.
You can double click on an error to check its properties, and look up the event ID of the error online. This can help you discover more information on the error so you can fix it if you need to.
Conclusion
In this article, you learned about the Windows 10 Event Viewer, which is a very powerful tool Windows users should know how to use.
Apart from viewing various activity logs, it also helps you be aware of what’s happening on your computer.
Thank you for reading. If you consider this article helpful, please share it with your friends and family.
Learn to code for free. freeCodeCamp’s open source curriculum has helped more than 40,000 people get jobs as developers. Get started
Системный журнал событий (он же «Просмотр событий» или «Event Viewer») в Windows 10 – это один из самых важных инструментов в операционной системе, к которому прибегают не все пользователи, а зря. Ведь он помогает показать все важные ивенты, которые происходят как с самой ОС, так и с установленными программами. В таком случае даже неопытный пользователь может легко найти решение по конкретной проблеме, так как в нем сохраняются все логи ошибок. Ну или хотя бы «загуглить» информацию, которая уже поможет.
Далее я расскажу, как открыть журнал событий (ошибок), создать ярлык на рабочем столе или отключить службу. На самом деле инструкции почти ничем не отличаются и от других версий «Окон», поэтому вы можете пользоваться ею всегда. Если в процессе возникнут какие-то вопросы (в том числе по ошибкам, которые вы найдете), то смело обращайтесь ко мне в комментариях, и я вам постараюсь помочь. Поехали!
Содержание
- Способ 1: Панель управления и создание ярлыка для быстрого доступа
- Способ 2: Выполнить
- Способ 3: Поиск
- Способ 4: Прямой запуск
- Можно ли отключить журнал событий и как это сделать?
- Задать вопрос автору статьи
Способ 1: Панель управления и создание ярлыка для быстрого доступа
Если ранее её можно было вызвать с помощью правой кнопки по кнопке «Пуск», то почему-то разработчики в данный момент её оттуда убрали. Переживать не стоит, её полностью убирать не будут, но сам факт достаточно странный. Поэтому мы воспользуемся другим методом.
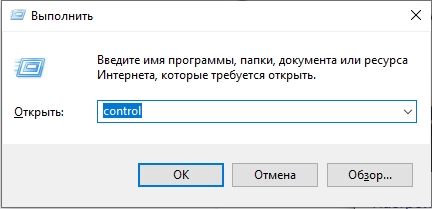
- Открываем «Панель управления». Это можно сделать двумя способами. Первый – зажимаем вспомогательную кнопку (находится между Ctrl и Alt) – не отпускаем её и жмем по букве R. Откроется приложение «Выполнить». Вводим команду:
control
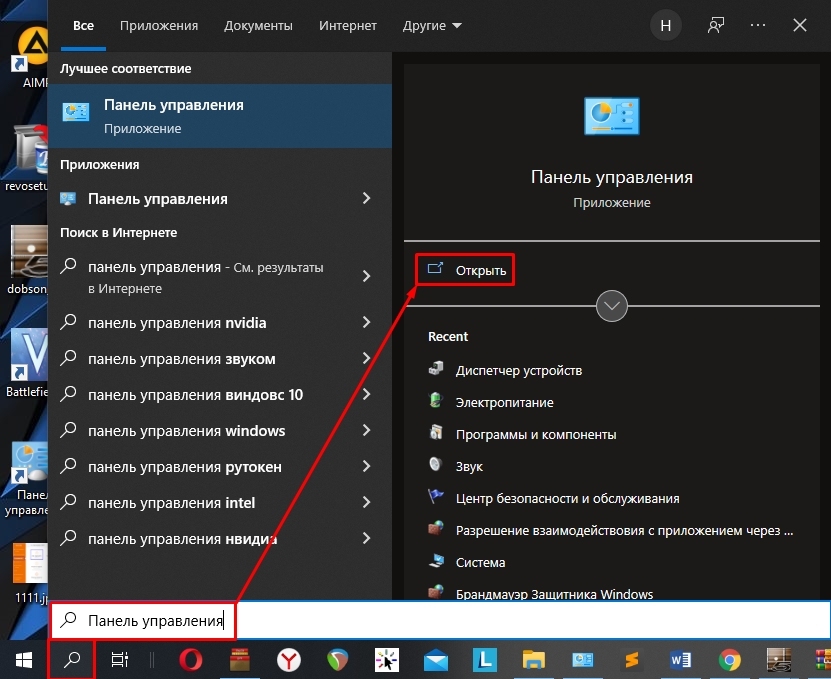
- Второй способ – это воспользоваться поиском. Чтобы его открыть нажмите по значку лупы и введите название.
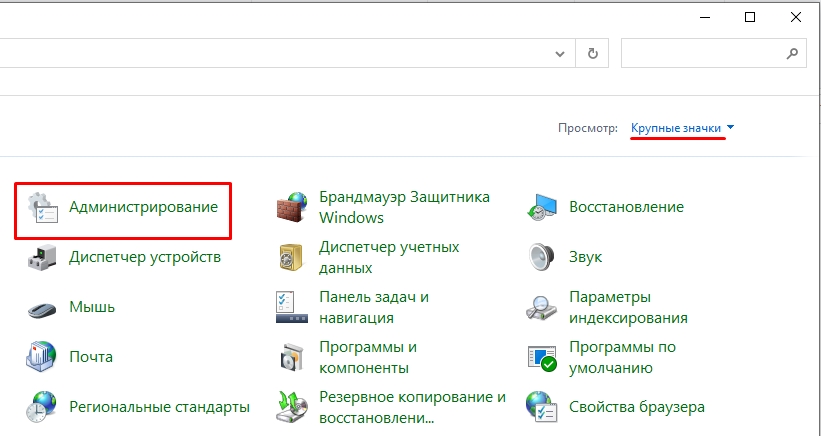
- Находим раздел «Администрирование» и жмем по нему. Если вы не можете его найти, то значит у вас установлен неправильный режим просмотра. Посмотрите на картинку ниже и установите такой же режим как у меня.
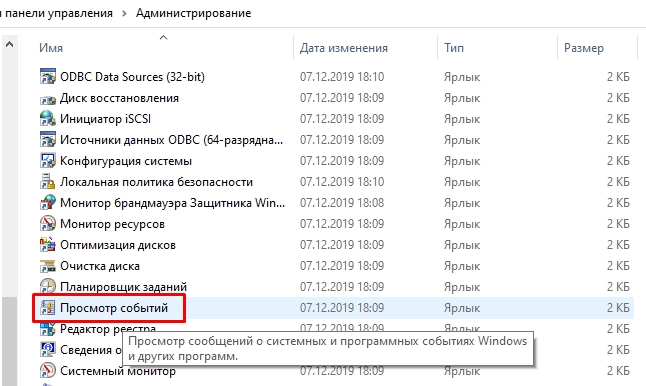
- Далее вы увидите несколько ярлыков – жмем двойным щелчком левой кнопкой мыши по кнопке «Просмотр событий».
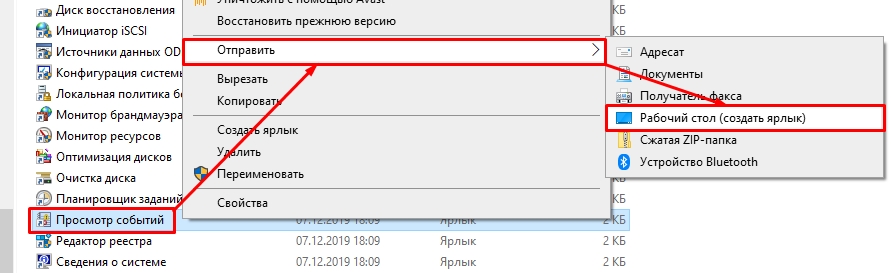
Если вы постоянно работаете с этой системной утилитой, то я вам рекомендую сделать ярлык, который будет расположен на рабочем столе. Для этого кликаем правой кнопкой, далее из выпадающего меню выбираем «Отправить» – «Рабочий стол (создать ярлык)».
Способ 2: Выполнить
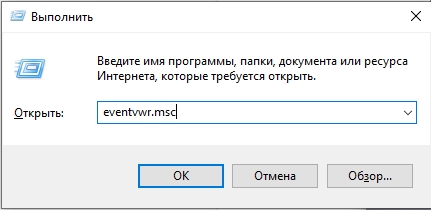
Сейчас вы спросите: а почему мы ранее не воспользовались этим методом, если уже вызывали окно «Выполнить»? – Я хотел, чтобы вы понимали само расположение системной утилиты. Так же мы таким образом знакомимся со структурой операционной системы. В общем воспользуемся нашей любимыми клавишами «WIN + R», чтобы вызвать исполняемую программу и вводим команду:
eventvwr.msc
СОВЕТ! Если каким-то образом кнопки не работают, то вы можете вызвать окно «Выполнить», также через поиск Виндовс.
Способ 3: Поиск
Скорее всего вы уже догадались, что мы сейчас будем делать. Открываем окно поиска операционной системы, нажав по лупе. Кстати окно поиска можно вызвать через + S. Далее в строку поиска вводим:
Просмотр событий
или
eventvwr.msc
Очень важно среди команд выбрать именно «Открыть».
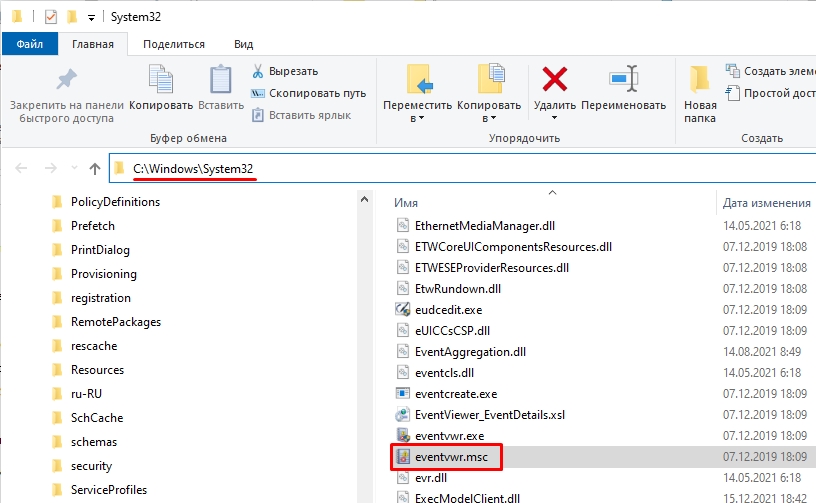
Так как это системная утилита, то её можно запустить прямым методом. Для этого переходим в системный диск «C», открываем папку «Windows» и находим основной раздел «System32». Далее нам нужно найти файл:
eventvwr.msc
Файлов и папок там будет много. Вы можете найти его вручную – все файлы расположены в алфавитном порядке. Или вы можете воспользоваться поиском.
Можно ли отключить журнал событий и как это сделать?
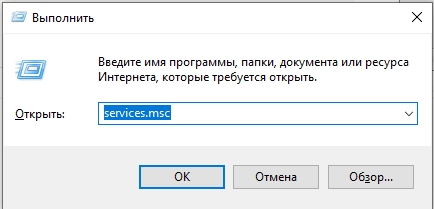
Конечно это не рекомендуется делать. Но если у вас возникли какие-то трудности с этой утилитой, то делаем следующее – сначала используем + R. Вводим команду:
services.msc
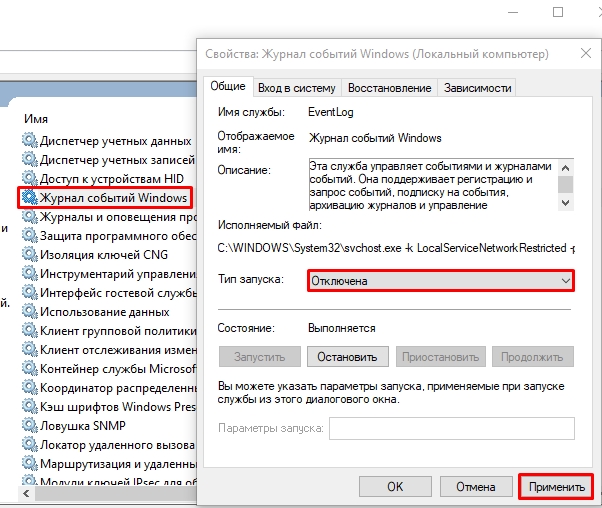
Находим «Журнал событий Windows», открываем его двойным щелчком левой кнопкой мыши. Устанавливаем «Тип запуска» – «Отключена». Жмем «Применить» и перезагружаем комп. Или вы можете «Остановить» лог ошибок вручную, но я все же рекомендую перезапустить ОС.
На этом все, дорогие друзья. Если остались какие-то вопросы, то милости прошу в комментариях под этой статьей. Всем добра!
- Зачем нужен и как открыть Журнал событий?
- Интерфейс Журнала событий
- Что можно сделать в Журнале событий?
- Заключение
Журнал событий — это одна из стандартных служебных утилит, встроенных в Windows. Программа существует в системе уже давно и поставляется как со старыми, так и с самими последними версиями ОС. Рассмотрим, как открыть и использовать Журнал событий в Windows 10 или 11. Разберем, что в нем можно сделать и чем он полезен.
Зачем нужен и как открыть Журнал событий?
Утилита используется для просмотра произошедших событий, выполненных команд и действий в системе. С ее помощью можно отслеживать возникшие ошибки и выявлять их причины для дальнейшего устранения и предотвращения повторного появления сбоев. Программа позволяет выполнять диагностику ОС и изучать все события, произошедшие внутри Windows. Обычно утилиту используют именно для этого.
Для начала разберем несколько основных способов запустить утилиту в Windows 10 и 11.
1 способ — поиск на панели задач
Наиболее простой метод — найти утилиту в строке поиска на панели задач и запустить ее оттуда. Введите Просмотр событий и дождитесь, пока отобразятся результаты. Найдите среди них программу и кликните на нее левой кнопкой.

2 способ — утилита Выполнить
Распространенный способ — запуск через программу Выполнить. Чтобы воспользоваться им, примените сочетание клавиш Win + R. В появившемся окне введите команду eventvwr.msc и нажмите Enter на клавиатуре.
3 способ — контекстное меню кнопки Пуск
Простой способ открыть приложение в Windows 10 — щелкнуть правой кнопкой по кнопке Пуск и выбрать пункт Просмотр событий в появившемся контекстном меню.
4 способ — Управление компьютером
Попасть в Просмотр событий также можно через Управление компьютером. Для этого запустите его любым методом. Например, кликнув ПКМ по иконке Этот компьютер и выбрав пункт Управление. В левой колонке окна утилиты щелкните на ссылку Просмотр событий, чтобы открыть журнал.
5 способ — поиск файла в Проводнике
Альтернативный вариант — вручную найти запускной файл утилиты в файловом менеджере и открыть его таким способом. Для этого нужно перейти в директорию C:\Windows\System32, найти в ней eventvwr.msc и выполнить его.
Интерфейс Журнала событий
Окно Журнала событий состоит из нескольких основных частей:
- Слева находится боковая панель навигации, в которой можно выбрать нужный журнал (категорию). Например, Приложение, Безопасность, Система и т.д.
- По центру располагается основной список событий из выбранной в данный момент категории.
- Под списком находятся более подробные сведения о выделенном действии.
- В правой части окна находится панель инструментов, при помощи которой можно быстро выполнить нужное действие с выбранным событием.
В верхней части окна также присутствует стандартное меню и несколько кнопок для навигации.
Что можно сделать в Журнале событий?
Разберем основной функционал Журнала событий и распространенные сценарии использования программы.
Анализ выполненных действий
Самый простой сценарий использования утилиты — просмотр и анализ произошедших в Windows событий для диагностики возможных неполадок. Для него нужно открыть программу и изучить отображаемые действия в основных журналах (разделах).
Если среди них найдутся ошибки, ничего критичного в этом нет. В работе ОС в любом случае возникают сбои, и это нормально. Поводом для беспокойств может становиться только слишком большое количество ошибок в списке событий.
Выявление причин ошибок
Наиболее часто Журнал событий используют для выявления причин произошедших ошибок. При помощи утилиты можно узнать больше сведений о возникших в системе сбоях, что помогает проще найти и устранить их источник.
Чтобы найти причину произошедшей ошибки, найдите ее в списке событий и кликните по ней дважды. В открывшемся окне просмотрите информацию о неполадке. Главное, на что стоит обратить внимание — строка Код ошибки. В ней указывается кодовый номер сбоя, по которому можно найти причину неисправности через поиск в интернете.
Привязка задачи к событию
Одна из полезных функций — возможность привязать задачу к возникновению действия. Это осуществляется с участием другой служебной программы Windows — Планировщика событий. С помощью этих двух утилит, Журнала и Планировщика, можно задать нужное действие, которое будет автоматически выполняться в тех случаях, когда в системе произойдет определенное событие.
Заключение
Журнал событий — полезная утилита, которая может упростить использование Windows и решение проблем в системе. С ее помощью можно проанализировать работу ОС и быстро выявить причины произошедших сбоев.
| FullEventLogView v1.80 — Event Log Viewer for Windows 11 / 10 / 8 / 7 / Vista Copyright (c) 2016 — 2023 Nir Sofer |
See Also
- NK2Edit — Edit, merge and fix the AutoComplete files (.NK2) of Microsoft Outlook.
- EventLogChannelsView — enable/disable/clear event log channels.
- UninstallView — Alternative uninstaller for Windows 10/8/7/Vista
Description
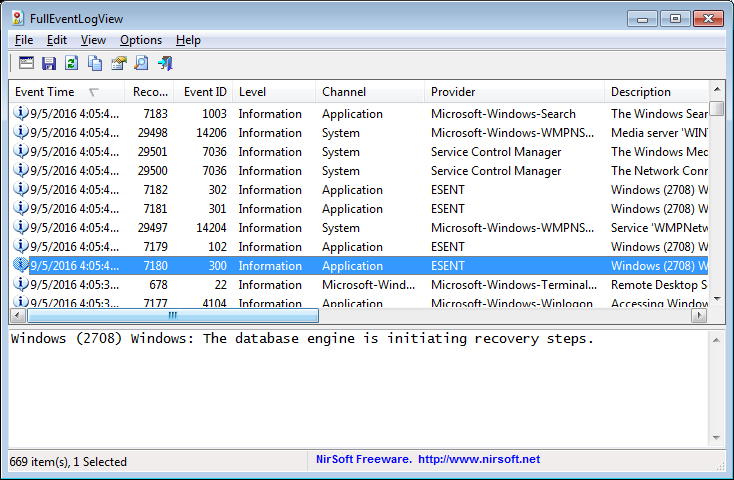
FullEventLogView is a simple tool for Windows 11/10/8/7/Vista that displays in a table the details of all events from the event logs of Windows, including the event description.
It allows you to view the events of your local computer, events of a remote computer on your network, and events stored in .evtx files.
It also allows you to export the events list to text/csv/tab-delimited/html/xml file from the GUI and from command-line.
System Requirements
This utility works on any version of Windows, starting from Windows Vista and up to Windows 11. Both 32-bit and 64-bit systems are supported.
For Windows XP and older systems, you can use the MyEventViewer tool.
FullEventLogView vs MyEventViewer
MyEventViewer is a very old tool originally developed for Windows XP/2000/2003.
Starting from Windows Vista, Microsoft created a new event log system with completely new programming interfaces. The old
programming interface still works even on Windows 10, but it cannot access the new event logs added on Windows Vista and newer systems.
MyEventViewer uses the old programming interface, so it cannot display many event logs added on Windows 11/10/8/7/Vista.
FullEventLogView uses the new programming interface, so it displays all events.
Versions History
- Version 1.80:
- Added ‘Black Background’ option (Under the View menu). When it’s turned on, the main table and the lower pane text-box are displayed in black background and white text, instead of default system colors.
- Fixed issue: When copying data to the clipboard or exporting to tab-delimited file, every line contained an empty field in the end of the line.
- Version 1.78:
- Added ‘Full Screen’ mode (View -> Full Screen or F11 key).
- Version 1.77:
- Added ‘Sort By’ toolbar button.
- Version 1.76:
- Fixed issue: The ‘Record ID’ value was limited to the size of 32-bit integer.
- Version 1.75:
- Fixed the filter to work properly when new event items are added in ‘Auto Refresh’ mode.
- Version 1.74:
- Updated to stop the event log scanner when you press the Esc key.
- Version 1.73:
- The status bar now displays the current scanned event log channel/filename.
- Version 1.72:
- Fixed to work properly when specifying to filter more than 23 event IDs (Workaround for limitation of event log queries).
- Version 1.71:
- Fixed to display the time properly in AM/PM format.
- Fixed the default columns size in high DPI mode.
- Version 1.70:
- Added option to choose a single event log filename (.evtx or .etl file) in the ‘Choose Data Source’ window.
- You can also load a single event log file (.evtx or .etl file) by dragging it from Explorer window into the main window of FullEventLogView.
- Version 1.68:
- Added ‘Add Header Line To CSV/Tab-Delimited File’ option (Turned on by default).
- Version 1.67:
- Fixed the /srawxml command-line option to save the raw xml much faster than the previous versions.
- Version 1.66:
- ‘Show Event Strings In Columns’ option — You can now change the number of event string columns displayed when this option is turned on.
You can do it by editing the following line in FullEventLogView.cfg (The default value is 10):
EventStringColumns=10 - You have to edit this value while FullEventLogView is not running.
- ‘Show Event Strings In Columns’ option — You can now change the number of event string columns displayed when this option is turned on.
- Version 1.65:
- Added option to save the selected events as raw event XML (In ‘Save Selected Items’ option), which is the same XML you see in the lower pane when choosing Options -> Lower Pane Display Mode -> Show Event XML.
- Added /srawxml command-line option to save the raw event XML from command-line.
- Updated the HTML export feature to HTML5.
- Added option to change the sorting column from the menu (View -> Sort By). Like the column header click sorting, if you click again the same sorting menu item, it’ll switch between ascending and descending order. Also, if you hold down the shift key while choosing the sort menu item, you’ll get a secondary sorting.
- Version 1.62:
- Added option to specify user name and password for connecting a remote computer (In the ‘Choose Data Source’ window). You have to use this option if you get ‘Access is denied’ error message when trying to connect the remote computer.
- Version 1.61:
- Fixed some high DPI mode issues.
- Version 1.60:
- Added ‘Tray Balloon On New Event’ option. This feature is active only when both ‘Put Icon On Tray’ and ‘Auto Refresh’ options are turned on.
When it’s active, FullEventLogView displays every new event in a tray balloon. - Added ‘Start As Hidden’ option. When this option and ‘Put Icon On Tray’ option are turned on, the main window of FullEventLogView will be invisible on start.
- Added ‘Tray Balloon On New Event’ option. This feature is active only when both ‘Put Icon On Tray’ and ‘Auto Refresh’ options are turned on.
- Version 1.58:
- Added ‘New FullEventLogView Instance’ under the File menu, for opening a new window of FullEventLogView.
- Version 1.57:
- Added ‘Log File’ column, which displays the log filename if the event was loaded directly from .evtx or .etl file.
- Version 1.56:
- In the the channel and provider fields of the ‘Advanced Options’ window — you can now choose the desired channel/provider from a combo-box.
- Version 1.55:
- When reading .etl files that store the event data inside EventPayload element of the XML, FullEventLogView now automatically converts the EventPayload
from hexadecimal string to readable text, and displays it as the decsription of the event.
For example, you can use this feature to view the Windows Update logs from C:\windows\logs\WindowsUpdate on Windows 10. - Added ‘Copy Clicked Cell’ option to the right-click context menu, which copies to the clipboard the text of cell that you right-clicked with the mouse.
- When reading .etl files that store the event data inside EventPayload element of the XML, FullEventLogView now automatically converts the EventPayload
- Version 1.53:
- Fixed bug: Wildcards didn’t work when using the ‘Search in full description string’ option.
- Fixed to save the ‘Case Sensitive’ option of the Quick Filter in the .cfg file.
- Version 1.52:
- Added ‘Select All’ and ‘Deselect All’ to the ‘Column Settings’ window.
- Version 1.51:
- Added the ‘Clear All Events Of Selected Channel’ option to the context menu.
- Increase the maximum size of the description filter string.
- Version 1.50:
- Fixed bug: FullEventLogView remained in memory if you closed the main window during events scanning.
- Added ‘Clear All Events Of Selected Channel’ option (Under the file menu). For example: If you select an event that its channel is
‘System’, using this option will delete all system events. - Added /ClearChannelEvents command-line option, which clears all events of the specified channel, for example:
FullEventLogView.exe /RunAsAdmin /ClearChannelEvents «Microsoft-Windows-Bits-Client/Operational» - Added 2 modes to description filter: ‘Search in description parameters’ and ‘Search in full description string’. In previous versions, the search was made inside description parameters,
but some people reported it’s a bug. The search is now made by default inside the full description string, but this search mode is slower because it requires to load the metadata and format the
description string before the filtering process.
- Version 1.38:
- Fixed bug: When trying to export events of remote computer from command-line, FullEventLogView loaded the events from local computer.
- Version 1.37:
- Added ‘Case Sensitive’ option to the Quick Filter window.
- Version 1.36:
- Added /RunAsAdmin command-line option for running FullEventLogView as administrator.
- Version 1.35:
- Added new options to the ‘Quick Filter’ feature, including the option to filter the list by Event ID.
- Version 1.32:
- When choosing to load only specific event IDs (From ‘Advanced Options’ window), the loading process is much faster.
- Version 1.31:
- Fixed bug: When connecting a remote computer the following error was displayed — Error 50: The request is not supported.
- Version 1.30:
- Fixed bug: FullEventLogView failed to display the event strings in the lower pane (‘Show Event Data + Description’ mode) and in the columns (‘Show Event Strings In Columns’ option).
- You can now resize the properties window, and the last size/position of this window is saved in the .cfg file.
- You can now send the data to stdout by specifying empty string as filename, for example:
FullEventLogView.exe /scomma «» | more
- Version 1.28:
- Fixed the lower pane to use the right font size in high DPI mode.
- Added option to choose another font (name and size) to display in the main window.
- Version 1.27:
- When exporting items with multiline description to tab-delimited file (Including the ‘Copy Selected Items’ option), FullEventLogView now put the description in quotes to
ensure the exported data will be displayed properly in Excel and other programs.
- When exporting items with multiline description to tab-delimited file (Including the ‘Copy Selected Items’ option), FullEventLogView now put the description in quotes to
- Version 1.26:
- Added support for saving as JSON file.
- Version 1.25:
- Added ‘Show Event Strings In Columns’ option (Under the Options menu). When it’s turned on, 10 new event string columns are added to the main table (‘String 1’, ‘String 2’, ‘String 3’…).
These columns display the strings from the event decsription and you can click the column header in order to sort the events according to the event strings.
- Added ‘Show Event Strings In Columns’ option (Under the Options menu). When it’s turned on, 10 new event string columns are added to the main table (‘String 1’, ‘String 2’, ‘String 3’…).
- Version 1.22:
- Fixed bug: On some systems, FullEventLogView missed some of the events when using a time filter.
- Version 1.21:
- Added /cfg command-line option, which instructs FullEventLogView to use a config file in another location instead if the default config file, for example:
FullEventLogView.exe /cfg «%AppData%\FullEventLogView.cfg»
- Added /cfg command-line option, which instructs FullEventLogView to use a config file in another location instead if the default config file, for example:
- Version 1.20:
- Added option to filter according to strings of the event description (In ‘Advanced Options’ window).
- Added ‘Quick Filter’ feature (View -> Use Quick Filter or Ctrl+Q). When it’s turned on, you can type a string in the text-box added under the toolbar and FullEventLogView will instantly filter the events table, showing only lines that contain the string you typed.
- Fixed the lower pane to switch focus when pressing tab key.
- Version 1.12:
- Added option to specify time range in GMT (‘Advanced Options’ window).
- Fix bug: When using /SaveDirect command-line option, the file was always saved according to the default encoding, instead of using the selected encoding in Options -> Save File Encoding.
- Version 1.11:
- Fixed bug: the process of exporting large amount of event log items from command-line was very slow, even when using /SaveDirect.
- Version 1.10:
- Added option to automatically read archive log files (In ‘Choose Data Source’ window). This option works only when you run FullEventLogView as administrator.
- Version 1.06:
- Fixed FullEventLogView to display event description properly when reading .evtx files from shadow copy (e.g: \\?\GLOBALROOT\Device\HarddiskVolumeShadowCopy3\Windows\System32\winevt\Logs )
- Fixed bug: FullEventLogView displayed error message when trying to read .etl files.
- Version 1.05:
- FullEventLogView now displays an error message if it fails to load events from external evtx file or from remote computer.
- Added ‘Choose Data Source’ icon to the toolbar.
- Version 1.00 — First release.
Start Using FullEventLogView
FullEventLogView doesn’t require any installation process or additional DLL files.
In order to start using it, simply run the executable file — FullEventLogView.exe
After running FullEventLogView, the main window loads and displays all events from the last 7 days.
You can change the default 7-days time filter and set other filters by using the ‘Advanced Options’ window (F9)
If you want to load the events from remote computer on your network or from event log files (.evtx), you should use the ‘Choose Data Source’ window (F7).
Lower Pane Display Mode
When you select an event in the upper pane, the lower pane displays the details of the selected event, depending on the display mode that you choose (Options -> Lower Pane Display Mode):
- Show Event Description:
Displays the full description of the event. Some event descriptions are too long for watching them in the ‘Description’ column, so you can view the long event description in the lower pane. - Show Event Data + Description:
Displays the full description of the event and additional data stored in this event. - Show Event XML:
Displays the full XML of the event.
Refresh (F5) And Smooth Refresh (F8)
FullEventLogView provides 2 types of refresh actions:
- Refresh (F5): Reloads the entire event log
- Smooth Refresh (F8): FullEventLogView only adds the new event items that have been created since the previous refresh.
Auto Refresh Mode
When Auto Refresh mode is turned on (Options -> Auto Refresh -> Every x seconds), FullEventLogView
automatically executes a smooth refresh according to the refresh interval you choose, so you’ll be able to see when a new event log item is created.
Show Event Strings In Columns
You can turn on the ‘Show Event Strings In Columns’ option if you want to view all event strings in the upper pane table.
By default, FullEventLogView displays 10 event string columns (String 1, String 2, String 3,…).
If you need more than 10 event string columns, You can do it by editing the following line in FullEventLogView.cfg:
EventStringColumns=10
You have to edit this value while FullEventLogView is not running.
Run As Administrator
By default, FullEventLogView doesn’t request elevation (Run As Administrator). If you want to watch events thar are only available with administrator privilege (like the security log),
you have to run FullEventLogView as administrator by press Ctrl+F11.
Command-Line Options
|
/ChannelFilter [1 — 3] /EventIDFilter [1 — 3] /ProviderFilter [1 — 3] /ChannelFilterStr [Filter String] /EventIDFilterStr [Filter String] /ProviderFilterStr [Filter String] . . . |
You can use any variable inside the .cfg file in order to set the configuration from command line, here’s some examples:
In order to show only events with Event ID 8000 and 8001:
In order show only events from Microsoft-Windows-Dhcp-Client/Admin channel:
In order to read events from .evtx files stored in c:\temp\logs :
In order to read events from remote computer:
In order to export events from remote computer into .csv file:
You can find more command-line examples in the following Web pages: |
| /ClearChannelEvents <Channel Name> |
Clear all events of the specified channel, for example: FullEventLogView.exe /RunAsAdmin /ClearChannelEvents «Microsoft-Windows-WLAN-AutoConfig/Operational» |
| /cfg <Filename> |
Start FullEventLogView with the specified configuration file. For example: FullEventLogView.exe /cfg «c:\config\felv.cfg» FullEventLogView.exe /cfg «%AppData%\FullEventLogView.cfg» |
| /RunAsAdmin | Run FullEventLogView as administrator. |
| /stext <Filename> | Save the event log items into a simple text file. |
| /stab <Filename> | Save the event log items into a tab-delimited text file. |
| /scomma <Filename> | Save the event log items into a comma-delimited text file (csv).
|
| /stabular <Filename> | Save the event log items into a tabular text file. |
| /shtml <Filename> | Save the event log items into HTML file (Horizontal). |
| /sverhtml <Filename> | Save the event log items into HTML file (Vertical). |
| /sxml <Filename> | Save the event log items into XML file. |
| /sjson <Filename> | Save the event log items into JSON file. |
| /srawxml <Filename> | Save the event log items into raw event XML file. |
| /SaveDirect |
Save the event log items in SaveDirect mode. For using with the other save command-line options ( /scomma, /stab, /sxml, and so on…) When you use the SaveDirect mode, the event log items are saved directly to the disk, without loading them into the memory first. Be aware that the sorting feature is not supported in SaveDirect mode. |
| /sort <column> |
This command-line option can be used with other save options for sorting by the desired column. The <column> parameter can specify the column index (0 for the first column, 1 for the second column, and so on) or the name of the column, like «Record ID» and «Event ID». You can specify the ‘~’ prefix character (e.g: «~Channel») if you want to sort in descending order. You can put multiple /sort in the command-line if you want to sort by multiple columns. |
Translating FullEventLogView to other languages
In order to translate FullEventLogView to other language, follow the instructions below:
- Run FullEventLogView with /savelangfile parameter:
FullEventLogView.exe /savelangfile
A file named FullEventLogView_lng.ini will be created in the folder of FullEventLogView utility. - Open the created language file in Notepad or in any other text editor.
- Translate all string entries to the desired language.
Optionally, you can also add your name and/or a link to your Web site.
(TranslatorName and TranslatorURL values) If you add this information, it’ll be
used in the ‘About’ window. - After you finish the translation, Run FullEventLogView, and all translated
strings will be loaded from the language file.
If you want to run FullEventLogView without the translation, simply rename the language file, or move
it to another folder.
License
This utility is released as freeware.
You are allowed to freely distribute this utility via floppy disk, CD-ROM,
Internet, or in any other way, as long as you don’t charge anything for this and you don’t
sell it or distribute it as a part of commercial product.
If you distribute this utility, you must include all files in
the distribution package, without any modification !
Disclaimer
The software is provided «AS IS» without any warranty, either expressed or implied,
including, but not limited to, the implied warranties of merchantability and fitness
for a particular purpose. The author will not be liable for any special, incidental,
consequential or indirect damages due to loss of data or any other reason.
Feedback
If you have any problem, suggestion, comment, or you found a bug in my utility,
you can send a message to nirsofer@yahoo.com
FullEventLogView is also available in other languages. In order to change the language of
FullEventLogView, download the appropriate language zip file, extract the ‘fulleventlogview_lng.ini’,
and put it in the same folder that you Installed FullEventLogView utility.
| Language | Translated By | Date | Version |
|---|---|---|---|
| Brazilian Portuguese | igorruckert | 25/09/2016 | 1.00 |
| Brazilian Portuguese | Paulo Guzmán | 03/11/2022 | 1.74 |
| Bulgarian | Nikolay Nikolov | 29/09/2017 | 1.22 |
| Dutch | Jan Verheijen | 26/09/2023 | 1.80 |
| French | Largo | 24/09/2023 | 1.80 |
| German | «Latino» auf WinTotal.de | 24/09/2023 | 1.80 |
| Greek | geogeo.gr | 10/12/2017 | 1.25 |
| Hindi | Manish | 10/04/2019 | 1.32 |
| Hungarian | Timinoun | 12/12/2022 | 1.75 |
| Italian | Styb | 30/05/2023 | 1.78 |
| Japanese | youzeeen | 03/04/2021 | 1.61 |
| Persian | ZendegiyeSabz | 28/09/2023 | 1.80 |
| Polish | Hightower | 25/09/2023 | 1.80 |
| Russian | Dmitry Yerokhin | 24/09/2023 | 1.80 |
| Simplified Chinese | DickMoore | 04/06/2023 | 1.78 |
| Simplified Chinese | Qiang | 01/02/2021 | 1.60 |
| Slovak | František Fico | 02/10/2023 | 1.80 |
| Spanish | Fernando Lastra | 14/06/2023 | 1.78 |
| Swedish | I.K.l | 06/07/2017 | 1.22 |
| Traditional Chinese | Danfong Hsieh | 24/09/2023 | 1.80 |
| Turkish | HARUN ARI | 22/09/2023 | 1.80 |