Во всех версиях операционных систем Windows есть так называемый «Диспетчер задач», при помощи которого, порой сложно решить какие-то возникшие на компьютере проблемы. Каждый опытный пользователь компьютера о диспетчере задач конечное же знает, но новички далеко не все. А ведь инструмент очень полезный и может пригодиться каждому. В данной статье будет рассказано о том, что такое диспетчер задач, для чего он может понадобиться и какие основные полезные возможности в нём имеются.
Диспетчер задач — это отдельная программа в операционных системах Windows. Её не требуется самостоятельно устанавливать, потому что она автоматически уже предустановлена, т. е. будет доступна сразу после установки Windows на компьютер. Основное его назначение — просмотр запущенных на компьютере программ (процессов и служб), а также управление ими, например, закрытие зависшей программы, её перезапуск, анализ ресурсов компьютера, которые выделяются под каждую из программ и служб системы. Этим пользуются чаще всего. Но есть и другие возможности, особенно в последних версиях Windows.
Как запустить диспетчер задач
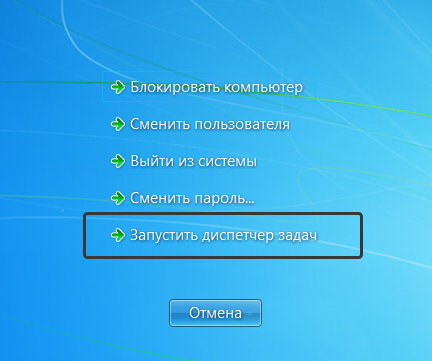
Запустить диспетчер задач в Windows очень легко. Проще всего это сделать горячими клавишами. Для этого вам нужно зажать на клавиатуре клавиши: Ctrl + Shift+ Esc. Диспетчер задач откроется сразу. Альтернативная комбинация: Ctrl + Alt + Del. При этом откроется окно , где нажать кнопку запуска диспетчера задач:
В Windows 8 и 10 аналогично.
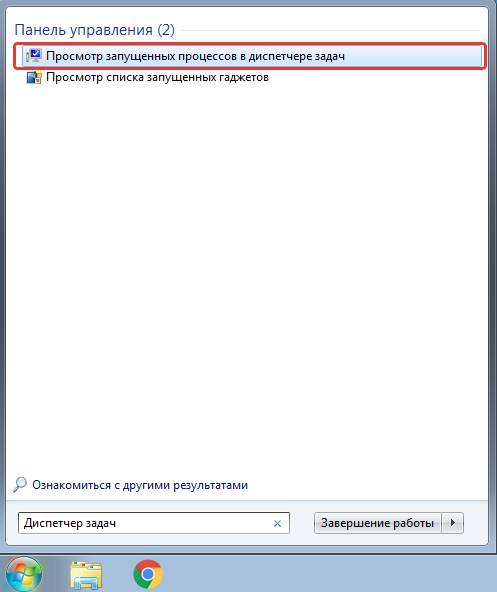
Если у вас не получается открыть диспетчер задач при помощи перечисленных выше горячих клавиш на клавиатуре, то воспользуйтесь поиском Windows. В поиске наберите «Диспетчер задач» и нужная программа появится в списке, где вы сможете её сразу открыть. Пример поиска:

В списке результатов поиска диспетчер задач может так и называться, а может называться так «Просмотр запущенных процессов в диспетчере задач».
Всё о том, как пользоваться поиском Windows различных версий, рассказано в отдельной статье — здесь.
Обзор функционала диспетчера задач на примере Windows 8, 10
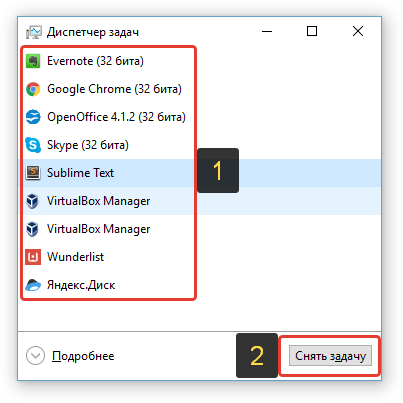
Изначально диспетчер задач открывается в свёрнутом виде, где будут все открытые (запущенные) в данный момент программы на компьютере:

Через данное окно вы можете быстро завершить работу какой-либо программы (например, в случае её зависания). Для этого выберите программу из списка и нажмите «Снять задачу».
О решении проблем с зависаниями компьютера рассказано вот здесь.
Чтобы перейти к полному функционалу диспетчера задач, нажмите «Подробнее» (вы сможете свернуть диспетчер обратно в компактный режим кнопкой «Меньше»).
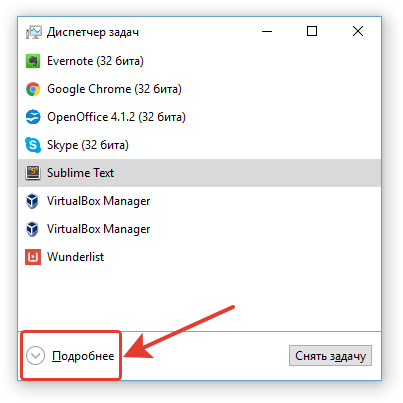
В результате диспетчер задач откроется в подробном виде, с несколькими вкладками для анализа различных параметров.
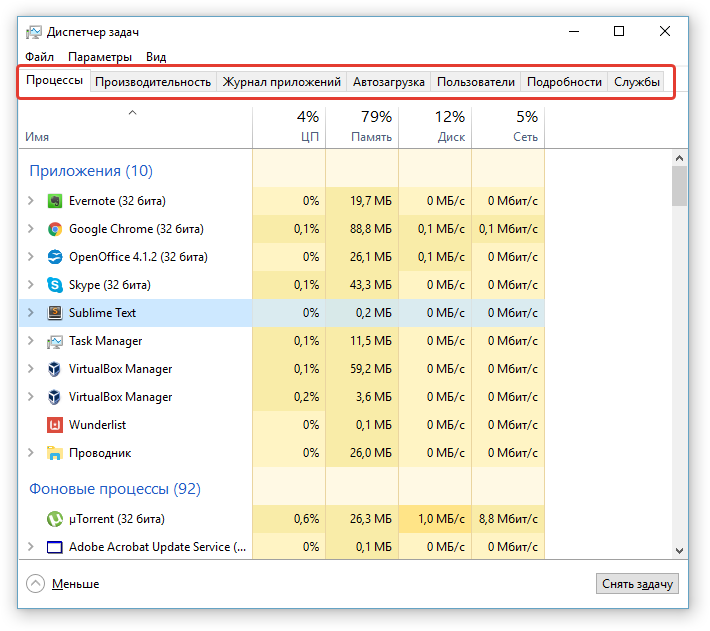
Вкладка «Процессы»
Здесь отображены все активные на данный момент программы на компьютере, а также те, которые работаю в фоновом режиме (т. е. вы не видите их работу, они как бы скрыты).
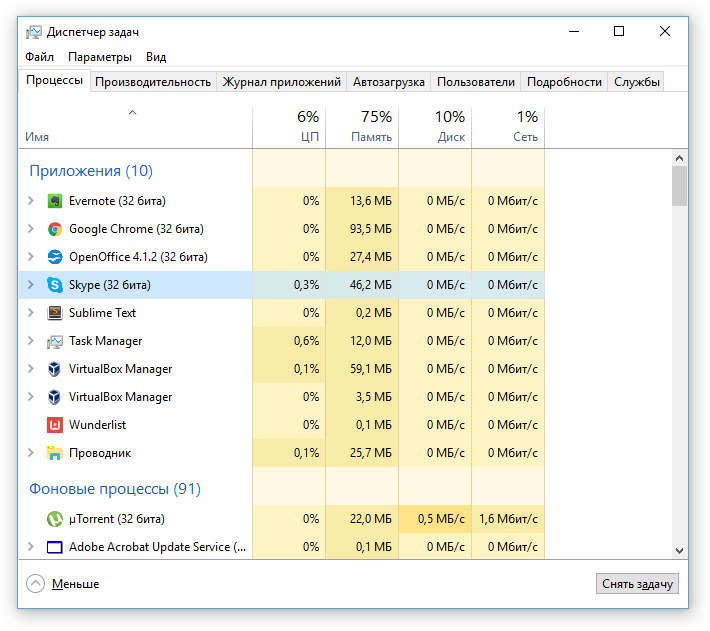
В первом столбце таблицы показаны названия программ. В следующих столбцах отображены ресерсы компьютера, которые занимает каждая из программ, т. е. — какая нагрузка ложится на центральный процессор (столбец «ЦП»), какой объём памяти программа занимает в оперативной памяти, какая нагрузка на жёсткий диск (запись и считывание информации), а также какая нагрузка на сеть (т. е. как активно программа что-то передаёт или скачивает из интернета / локальной сети). Вверху каждого столбца указано, сколько всего ресурсов (в процентах) потребляют все активные программы на вашем компьютере.
Такая информация позволяет оценить, какие из программ сильнее всего нагружают компьютер в целом или какие-то из основных его компонентов. Для удобства можно отсортировать порядок программ по нужному столбцу, кликнув по нему. Например, хотим увидеть, какие программы «съедают» больше всего оперативной памяти компьютера. Для этого кликаем по столбцу «Память» и в нужные программы отобразятся в самом верху.
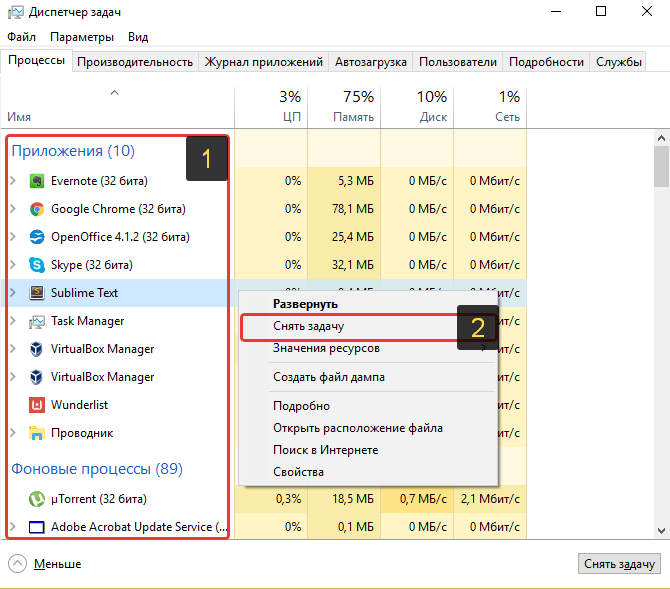
Вы можете быстро закрыть любую из активных программ в списке. Для этого щёлкните по ней правой кнопкой мыши по выбранной из списка (1) программе и нажмите «Снять задачу» (2).
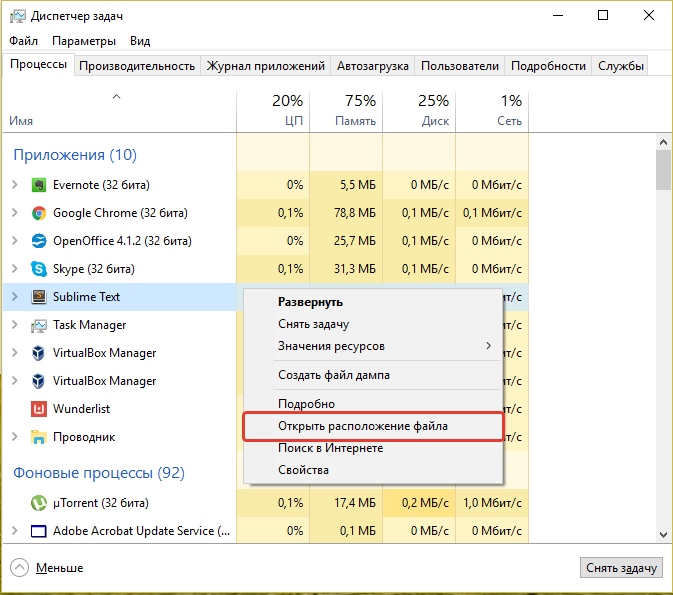
Иногда требуется посмотреть, а где на компьютере расположена та или иная программа из отображённых в списке. Чтобы открыть папку с программой, выберите её из списка, щёлкните правой кнопкой мыши и нажмите «Открыть расположение файла».
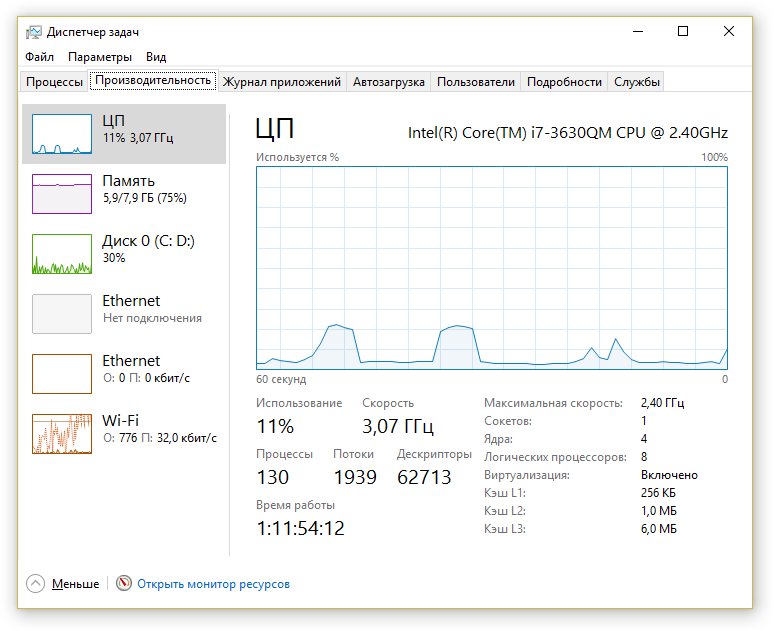
Вкладка «Производительность»
Здесь отображается сводка в реальном времени по использованию ресурсов вашего компьютера программами. Слева расположены основные компоненты, по которым отслеживается нагрузка в реальном времени: процессор (ЦП), оперативная память (Память), жёсткий диск (Диск), а также сетевые устройства (Ethernet – проводной интернет) и Wi-Fi.
Кликнув по компоненту, справа откроется графическое отображение нагрузки на него в реальном времени, а также дополнительная информация.
Вкладка «Журнал приложений»
В целом, чаще всего ненужная вкладка, где показана информация о нагрузке стандартных Windows-приложений на компоненты компьютера.
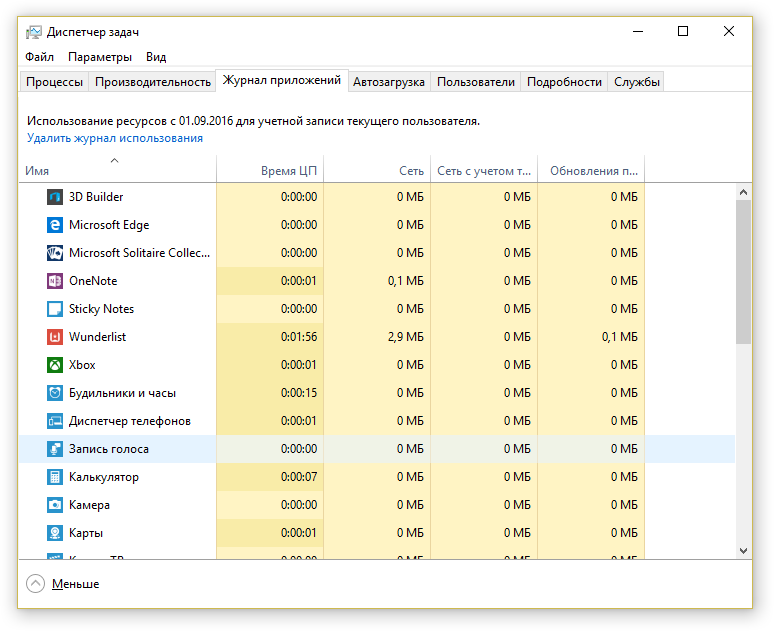
Здесь подразумеваются те приложения, которые можно загрузить из магазина Windows, например, «Запись голоса», «Карты», «Музыка Groove» и другие. Также в этом списке будут некоторые стандартные программы, доступные сразу после установки Windows, например, браузер Microsoft Edge.
Вкладка «Автозагрузка».
Здесь можно увидеть, какие программы автоматически запускаются сразу после загрузки Windows, т. е. сразу после включения компьютера. Это очень нужная информация, поскольку чем больше программ автоматически запускается сразу после старта Windows, тем больше нагрузки на компьютер. К примеру, вы можете намного дольше ожидать полной загрузки компьютера, чтобы начать работать. Поэтому, автозагрузку тех программ, которые вам не нужны сразу после включения компьютера, лучше отключить, чтобы бестолку не нагружать компьютер.
Дополнительная полезная информация по отключению программ из автозагрузки находится здесь.
Увидеть, включён ли автозапуск программы или отключён вы можете в столбце «Состояние» (1). Чтобы включить / отключить из автозагрузки нужную программу, выберите её из списка и нажмите кнопку справа внизу «Включить / Отключить» (2).

Вкладка «Пользователи»
Информацией на этой вкладке имеет смысл пользоваться только тогда, когда на компьютере работает не один единственный пользователь, а два и более. Если на компьютере работает несколько пользователей, то на этой вкладке можно посмотреть (по аналогии со вкладкой «Процессы»), обо всех активных у каждого из пользователей программ, а также какова нагрузка каждой из них ложится на основные компоненты компьютера.
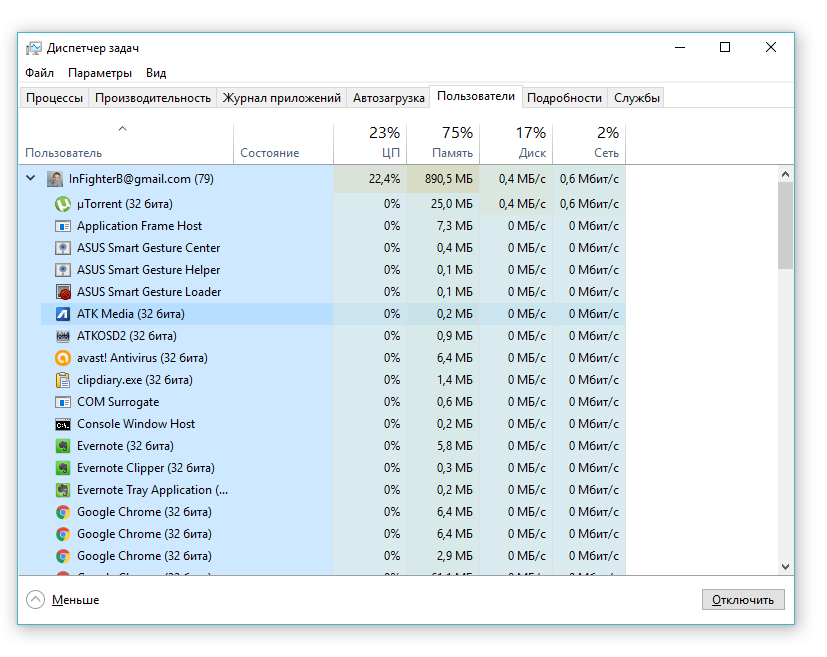
В случае, если на компьютере работает только один пользователь, то удобнее пользоваться вкладкой «Процессы», рассмотренной выше.
Через данную вкладку можно закрывать программы, а также открывать папку, откуда была открыта программа, точно также как через вкладку «Процессы».
Вкладка «Подробности»
На данной вкладке можно увидеть более подробную информацию по активным на компьютере программам, например — увидеть название процесса (открытый файл), относящегося к программе, состояние программ (выполняется или приостановлено), описание и пользователя, под которым запущена программа.
Процесс программы — это определённый её файл.

Чаще всего данная вкладка не используется, поскольку хватает информации на вкладке «Процессы». Тем более, более подробная информация доступная для программ на этой вкладке редко является полезной. В описании, например, далеко не всегда присутствует именно описание, поскольку часто там дублируется либо название программы, либо имя процесса.
Разве что по названию процесса (столбец «Имя») можно понять, какой именно файл программы открыт.
Вкладка «Службы»
Службы — это фоновые программы, которые загружаются после запуска Windows и многие из которых являются необходимыми для работы различных встроенных в Windows программ, а также сторонних.
Через данную вкладку можно запустить остановленные (выключенные) службы, а также наоборот — отключить те, которые в данный момент работают. Некоторые лужбы имеет смысл отключать только для того, чтобы облегчить нагрузку на компьютер, поскольку чем больше служб работает одновременно, тем сильнее нагрузка.
Чтобы ориентироваться, какие службы можно отключить, а какие нельзя, требуется отдельное изучение каждой из этих служб. Большую часть из них трогать вообще нельзя, поскольку они являются служебными и жизненно необходимыми для правильной работы Windows и всех её компонентов. Отключив одну службу, могут перестать работать какие-то программы. Более того, службы могут зависеть друг от друга и бывает, что отключение одной службы ведёт за собой отключение ещё нескольких.
Не стоит пробовать отключать службу, пока на 100% не убедитесь, что она никогда не используется! Не стоит заниматься работой со службами, будучи неопытным пользователем компьютера!
Диспетчер задач на примере Windows 7 (в сравнении с Windows 8, 10)
В Windows 7 и более ранних версиях Windows, диспетчер задач имеет 90% всех тех же возможностей, что имеются в диспетчере задач Windows 8 и 10. Отличия заключаются в менее удобном интерфейсе и удобстве взаимодействия.
Вкладка «Приложения» аналогична вкладке «Процессы» из Windows 8,10. Только в Windows 7 здесь отображается минимум информации, например, не отображаются программы, работающие в фоновом режиме (невидимые), также отсутствует дополнительная информация по нагрузке программы на компьютер (по отдельным компонентам).
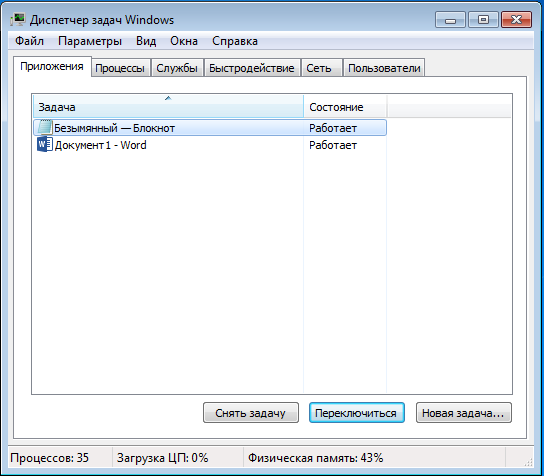
Для завершения программы используется кнопка «Снять задачу.
Вкладка «Процессы» аналогична вкладке «Подробности» из Windows 8,10 и там располагается та же самая информация, практически без изменений.
Вкладка «Службы» точно такая же как в новых версиях Windows.
Вкладка «Быстродействие» аналогична вкладке «Производительность» из Windows 8,10. Отличается менее удобным интерфейсом и меньшим количеством отображаемой информации.
Вкладка «Сеть» показывает нагрузку общую нагрузку на сеть со стороны программ, например, как много программы передают данные в интернет или скачивают. В Windows 8,10 такой вкладки нет, поскольку отображение нагрузки на сеть включено во вкладку «Производительность».
Вкладка «Пользователи». В Windows 8,10 есть такая же вкладка, позволяющая увидеть, какие программы открыты и работаю от того или иного пользователя Windows (если их несколько). В случае с Windows 7, на этой вкладке можно увидеть лишь список пользователей, активных на компьютере с возможность отключить нужного пользователя (если он не один) или выйти из его аккаунта в Windows.
Запуск программ через диспетчер задач
Через диспетчер задач можно не только закрывать программы, но и запускать вручную их запускать. К примеру, если программа зависла, вы её закрыли и через диспетчер задач можете запустить.
Это не актуально в том случае, если нужно запустить программу, которую вы итак можете легко открыть с ярлыка на рабочем столе, к примеру. Однако, если завис проводник Windows, то закрыв его, вы не увидите ничего кроме обоев рабочего стола и уже не сможете запустить никакую программу стандартным методом. В этом случае как раз помогает диспетчер задач.
Во всех версиях Windows процесс запуска программы через диспетчер задач одинаков.
Откройте меню «Файл» (1) и выберите «Запустить новую задачу» (2).
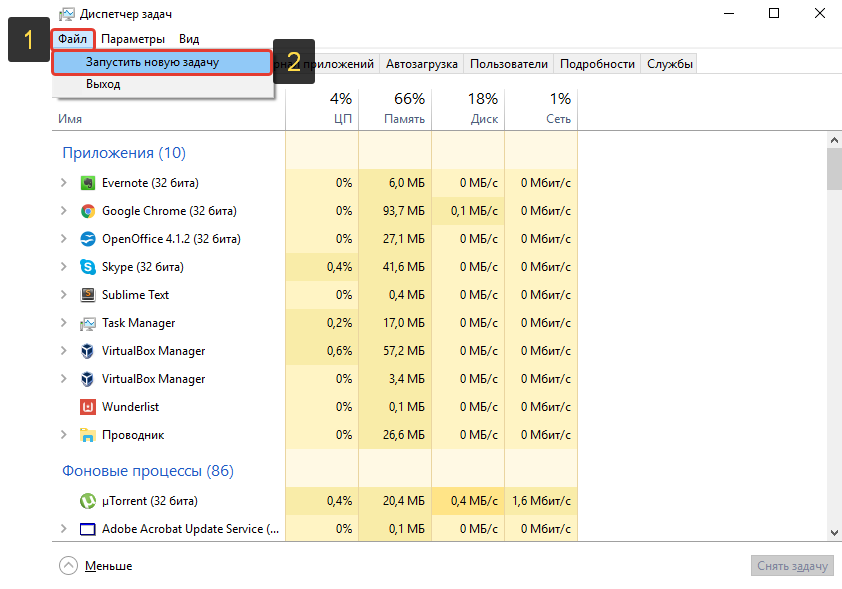
Вы можете ввести в окно (1) путь к файлу, который требуется запустить или же воспользоваться кнопкой «Обзор» (2), чтобы найти нужный файл и открыть его. Кнопка «ОК» (3) служит для запуска выбранной программы.

Пример. У вас зависла программа проводник (файл называется explorer.exe). Через диспетчер задач вы закрываете проводник и он автоматически не перезапустился (такое нередко случается). В результате вы увидите только фон рабочего стола и не сможете перейти как обычно в нужную папку и заново открыть программу. Здесь выручает диспетчер задач, через который вы находите нужный файл (explorer.exe) и запускаете его.
Заключение
Диспетчер задач (особенно в новых версиях Windows) очень часто оказывается незаменимым, поскольку позволяет, как минимум, быстро закрывать зависшие программы, перезапускать и настроить автозапуск нужых программ. Более опытным пользователям порой может потребоваться проанализировать нагрузку на компьютер от той или иной программы или же в целом. Поэтому всегда нужно уметь пользоваться диспетчером задач!
Всем хорошего дня и отличного настроения! 
Во всех версиях операционной системы Windows есть специальный инструмент, с помощью которого можно легко решить практически любую проблему с зависшим приложением. Называется он «Диспетчер задач». Изначально он служил просто для мониторинга активных процессов (запущенных программ, игр) и их закрытия в случаи зависания, но сейчас это инструмент, в котором содержится множество полезной информации для пользователя.
В этой статье мы разберем только самые основные и часто используемые функции диспетчера задач операционной системы Windows 10.
Как запустить Диспетчер задач
Есть несколько способов для запуска диспетчера задач, но мы разберем наиболее простые и актуальные:
- Сочетание клавиш Ctrl + Shift + Esc;
- Сочетание клавиш Ctrl + Alt + Delete и выбор пункта «Диспетчер задач»;
- Нажать правой клавишей мышки на панель задач и выбрать пункт «Диспетчер задач».
При первом открытии диспетчер задач запустится в компактном режиме. В нем будут отображены только запущенные на компьютере программы.

Подобный функционал у диспетчера задач был еще в операционной системе Windows NT 3.1. В данном режиме можно быстро закрыть зависшую или некорректно работающую программу.
|
Windows 10 |
Windows NT 3.1 |
Для этого нужно просто кликнуть по ней правой кнопкой мышки и выбрать соответствующий пункт из выпадающего меню, либо просто найти зависшее приложение и нажать кнопку «снять задачу»

По мере эволюции операционной системы Windows менялся внешний вид и функционал диспетчера задач. Сейчас это не просто программа для закрытия зависших приложений, это полноценный инструмент по мониторингу, диагностике и даже настройке операционной системы.
Чтобы воспользоваться всеми функциями, нужно перейти в расширенный режим работы. Для этого необходимо нажать «Подробнее».

Начнем знакомство с панели меню диспетчера задач.
В пункте «меню файла» можно запустить новую задачу, для этого нужно написать название процесса и нажать «ОК».

Остальные вкладки меню крайне редко используются и отвечают за параметры внешнего вида и отображения диспетчера задач.
А теперь подробно разберем его расширенные возможности.
«Процессы»
Это одна из наиболее часто используемых вкладок в диспетчере задач. В данном меню отображаются все активные процессы на компьютере. Они делятся на приложения и фоновые процессы.

Приложения — это активные программы: игры, браузеры. Все приложения можно безопасно закрывать. Процессы обычно не имеют графической оболочки и работают автономно, например, система синхронизации времени или фоновое обновление для браузера Google Chrome.
В данном меню можно также наблюдать за тем, какую нагрузку на процессор оказывают приложения и процессы, сколько потребляют оперативной памяти, как воздействуют на жесткий диск, сеть и видеокарту.

Можно закрывать зависшие приложения и процессы, а так же смотреть, где располагается активная программа на жестком диске.
Для того чтобы увидеть все действия, которые можно произвести с процессом или программой, необходимо щелкнуть по ним правой кнопкой мыши.

Внешний вид вкладки, вернее количество информации, отображаемой о процессе, также можно настроить под себя. Для этого нажмите правой кнопкой мыши на любой из показателей загрузки системы и отметьте галочкой то, что нужно отображать.

Также можно настроить значения (проценты или мегабайты), в которых будет выводиться информация о воздействии приложений и процессов на оперативную память, диск и сеть.
«Производительность»
Во вкладе «Производительность» в режиме реального времени можно наблюдать за тем, какую нагрузку на компоненты системы (процессор, оперативную память, жесткий диск и SSD, сеть и видеокарту) создают запущенные программы.

Помогает в тех случаях, когда компьютер начинает тупить без видимых на то причин. Здесь сразу будет видно, какой компонент системы загружен и насколько сильно.
График загрузки процессора можно настраивать для мониторинга каждого отдельного ядра процессора, а не общей загруженности в целом.

Помимо этого, на вкладке ЦП можно узнать точную модель и другую техническую информацию о процессоре:
- базовая частота
- количество физических и логических ядер
- объем кэша
На вкладке «Память», помимо объема занятой оперативной памяти, можно узнать эффективную частоту памяти и количество разъемом на материнской плате для установки планок памяти.

В случае с видеокартой есть дополнительная возможность мониторинга температуры и потребления видеопамяти программами или играми.

«Журнал приложений»
В данной вкладке отображаются только приложения из магазина Windows, если таковые имеются, а также нагрузка, которую они оказывают на систему.

«Автозагрузка»
Очень актуальное меню. После установки программ многие из них добавляют себя в автозагрузку для запуска вместе с операционной системой. Со временем там может накопиться огромное количество программ, причем не всегда нужных. Все бы ничего, но они отъедают ресурсы процессора и оперативную память, которой и так всегда мало, и к тому же увеличивают время включения компьютера.

Чтобы отключить ненужную программу, просто кликаем правой кнопкой мышки по программе или на окошко в нижней части диспетчера, далее выбираем «Отключить».
«Пользователи»
Во вкладке «Пользователи» отображаются активные пользователи операционной системы — это те, кто вошел в свою учетную запись. Тут также можно узнать количество системных ресурсов и программы, которые они используют. Если на компьютере один пользователь, вкладка совершенно бесполезная.

«Подробности»
Вкладка «Подробности» содержит различные сведения о запущенных процессах. Она похожа на рассмотренные чуть выше «Процессы», но здесь вы найдете больше информации и все отображаемые процессы из всех учетных записей пользователей в системе.

Для получения доступа к дополнительным параметрам процесса необходимо щелкнуть по нему правой кнопкой мышки.
«Службы»
Службы операционной системы — это системные программы, которые в зависимости от назначения запускаются автоматически при запуске операционной системы или только по необходимости.

Большинство служб являются частью операционной системы Windows. Например, Центр безопасности Защитника Windows — это новое приложения для управления встроенным системным антивирусом «Защитник Windows». Также есть службы, которые являются частью установленных программ, как, например, драйвера для видеокарт AMD или Nvidia. Тот же Google Chrome, TeamViewer или Adguard при установке создают одноименную службу, которая необходима для нормального функционирования самой программы.

Не стоит заниматься отключением служб без четкого понимания того, за что они отвечают, потому что большая их часть необходима для нормальной работы операционной системы, всех ее компонентов и установленных программ.
Для получения дополнительной информации об интересующей вас службе можно воспользоваться поиском в Интернете или открыть специальное меню для администрирования служб Windows, в котором будет дано подробное описание, состояние, тип запуска и зависимость от других служб.

Если же вам мало возможностей и информации, которая предоставляется диспетчером задач, есть сторонняя утилита Process Explorer для расширенного управления всеми процессами системы.
Process Explorer
Process Explorer распространятся абсолютно бесплатно. Скачать можно с официального сайта Microsoft.

С помощью этой программы можно не только отследить какой-либо процесс, но и узнать, какие файлы и папки он использует. На экране отображаются два окна. Содержимое одного окна зависит от режима, в котором работает Process Explorer: режим дескриптора или режим DLL.

Во втором отображается список активных процессов с их иерархией. Можно посмотреть подробную информацию о каждом из них: владелец, занятая память, библиотеки, которые он использует.
Программа позволяет менять приоритеты процессов и определять, какое ядро процессора будет его выполнять.
Можно управлять потоками процессов: запускать их, останавливать или ставить на паузу. Также можно «заморозить» процесс. Process Explorer поможет распознать, к какому процессу относится запущенное окно на рабочем столе, что поможет быстро обнаружить вредоносные программы.

Task Manager shows you what programs are running on your Windows computer and offers some limited control over those running tasks.
What Is Task Manager Used For?
For an advanced tool that can do an incredible number of things, most of the time the Windows Task Manager is used to do something very basic: see what’s running right now.
Open programs are listed, of course, as are programs that are running «in the background» that Windows and your installed programs have started.
Task Manager can be used to forcefully end any of those running programs, as well as to see how much individual programs are using your computer’s hardware resources and which programs and services are starting when your computer starts.
See the Task Manager Walkthrough section at the bottom of this article for every detail about this tool. You’ll be amazed at how much you can learn about the software that’s running on your computer with this utility.
How to Open Task Manager
Task Manager (Windows 11).
There is no shortage of ways to open Task Manager, which is probably a good thing considering that your computer may be suffering some kind of problem when you need to open it.
Let’s start with the easiest way first: Ctrl+Shift+Esc. Press those three keys together at the same time and Task Manager will launch.
CTRL+ALT+DEL, which opens the Windows Security screen, is another way. In Windows XP, this shortcut opens Task Manager directly.
Another easy way to open Task Manager is to right-click or tap-and-hold on any empty space on the taskbar, that long bar at the bottom of your Desktop. Choose Task Manager (Windows 11, 10, 8, & XP) or Start Task Manager (Windows 7 & Vista) from the pop-up menu.
You can also start the Task Manager directly using its run command. Open a Command Prompt window, or even just Run (Win+R), and then execute taskmgr.
Task Manager is also available on the Power User Menu in Windows 11, 10, and 8.
More About Opening the Task Manager
In Windows 10 and Windows 8, Task Manager defaults to a «simple» view of the running foreground programs. Select More details at the bottom to see everything.
Task Manager Availability
Task Manager is included with Windows 11, Windows 10, Windows 8, Windows 7, Windows Vista, and Windows XP, as well as with Server versions of the Windows operating system.
Microsoft improved Task Manager, sometimes considerably, between each version of Windows. Specifically, the Task Manager in Windows 11/10/8 is very different from the one in Windows 7 & Vista, and that one very different from the one in Windows XP.
A similar program called Tasks exists in Windows 98 and Windows 95, but doesn’t offer near the feature set that Task Manager does. That program can be opened by executing taskman in those versions of Windows.
Task Manager Walkthrough
There’s a mind-boggling level of information available in Task Manager about what’s going on in Windows, from overall resource usage down to minute details like how many seconds each individual process has used of the CPU’s time.
Every little bit, tab by tab, is fully explained below. Right now, however, let’s look at your menu options and what features and choices you have access to there:
Most of what’s discussed in these first three menu groups do not apply to Windows 11 version 22H2 and newer. Exceptions are called out.
File Menu
- Run new task — opens the Create new task dialog box. From here you can browse to, or enter the path of, any executable on your computer and open it. You also have the option to Create this task with administrative privileges, which will run the executable with «elevated» permissions.
- Exit — will close the Task Manager program. It will not end any apps, programs, or processes you’re viewing or have selected.
Settings/Options Menu
Settings (Windows 11).
This menu is called Settings in Windows 11 22H2 and newer, and is located in the bottom-left corner of Task Manager. In older versions, Options is located along the top of Task Manager.
- Always on top — if selected, will keep Task Manager in the foreground at all times.
- Minimize on use — if selected, will minimize Task Manager when you choose the Switch to option, available in several areas throughout the tool.
- Hide when minimized — if selected, will prevent Task Manager from showing up in the taskbar like a normal program. It will, in either case, always appear in the taskbar notification area (the space next to the clock with the little icons).
- Default Start Page — sets which tab is in focus when Task Manager is first launched. This is called Set default tab in some versions of Windows.
- Show full account name — if selected, displays a user’s real name next to the user’s username where applicable.
- Show history for all processes — if selected, shows data for non-Windows Store apps and programs in the App History tab.
View Menu
- Refresh now — when tapped or clicked, instantly update all the regularly updated hardware resource data found throughout Task Manager.
- Update speed — sets the rate at which resource data is updated throughout Task Manager. Choose High for 2 updates per second, Normal for 1 update per second, and Low for an update every 4 seconds. Paused freezes updates.
- Group by type — when checked, groups processes in the Processes tab by App, Background process, and Windows process.
- Expand all — will instantly expand any collapsed entries but only on the tab in which you’re viewing at the moment.
- Collapse all — will instantly collapse any expanded entries but only on the tab in which you’re viewing at the moment.
- Status values — sets whether a process’ suspended status is reported in the Status column, available in the Processes and Users tabs. Choose Show suspended status to show it or Hide suspended status to hide it.
Update speed is called Real time update speed in Windows 11, and it’s located in Settings.
Check out the next 10 sections for every detail imaginable on the Processes, Performance, App History, Startup apps, Users, Details, and Services tabs in the Windows Task Manager!
Microsoft has improved this utility considerably from early versions of the Windows operating system, incrementally adding features with every new Windows release. This walkthrough covers elements found in Task Manager for Windows 11, Windows 10, and Windows 8, and can also be used to understand the more limited Task Manager versions available in Windows 7, Windows Vista, and Windows XP.
The Processes Tab
Processes Tab (Windows 11).
The Processes tab in Task Manager is like «home base» in a way—it’s the first tab you see by default, gives you some basic information about what’s running on your computer right now, and lets you do most of the common things people do in Task Manager.
This tab contains a list of all the running programs and apps on your computer (listed under Apps), as well as any Background processes and Windows processes that are running. From this tab, you can close running programs, bring them to the foreground, see how each is using your computer’s resources, and more.
Processes is available in Task Manager as described here in Windows 8 and newer, but most of the same functionality is available in the Applications tab in Windows 7, Vista, and XP. The Processes tab in those older versions of Windows most resembles Details, described below.
Right-click or tap-and-hold on any listed process, and you’ll be presented with several options, depending on the type of process:
- Expand/Collapse — just another way to collapse or expand any grouped processes or windows — the same as using the little arrows to the left of the app or process name.
- Switch to and Bring to front options — available via right-clicking on the window results under the Apps, both bring up the selected window. Minimize and Maximize do what you’d guess, only they don’t necessarily bring the window to the foreground.
- Restart — available for some processes in control of Windows, like Windows Explorer, and will close and automatically restart that process.
- End task — no matter where you find it, does just that — it closes the task. If you End task from a process that has child windows or processes, they will close as well.
- Resource values — has nested menus within it of Memory, Disk, and Network. Choose Percents to show resources as a percent of total available on your system. Choose Values (the default) to show the actual level of resource being used. Resource values are also available from the individual column options (more on this in the section below).
- Create dump file — generates what’s called a «dump with heap» — an often very large file, in DMP format, that contains everything going on with that program, usually helpful only to a software developer trying to fix an unknown problem.
- Go to details — switches you to the Details tab and preselects the executable responsible for that process.
- Open file location — opens the folder on your computer that contains the executable responsible for that process and preselects it for you.
- Search online — opens up a search results page in your default browser for the executable file and the common name, hopefully serving up something useful.
- Properties — opens the Properties of the processes’ executable. This is the same Properties window you have access to from the file if you were to go there manually via the right-click menu in any file list in Windows.
By default, the Processes tab shows the Name column, as well as Status, CPU, Memory, Disk, and Network. Right-click or tap-and-hold on any column heading and you’ll see additional information you can choose to view for each running process:
- Name — the program or process’s common name, or file description, if it’s available. If it’s not, the file name of the running process is shown instead. In 64-bit versions of Windows, 32-bit program names are suffixed by (32-bit) when they’re running. This column can not be hidden.
- Type — shows the type of process in each row—a standard App, a Background process, or a Windows process. Task Manager is usually configured to Group by type already, so this column isn’t usually helpful to have open.
- Status — will note if a process is Suspended, but only if Task Manager is configured to Show suspended status from the View > Status values menu.
- Publisher — shows the running file’s author, extracted from the file’s copyright data. Nothing is shown if no copyright was included when the file was published.
- PID — shows each process’s process id, a unique identifying number assigned to each running process.
- Process name — displays the actual file name of the process, including the file extension. This is exactly how the file appears if you were to traditionally navigate to it in Windows.
- Command line — shows the full path and exact execution of the file that resulted in the running of the process, including any options or variables.
- CPU — a continuously updated display of how much of your central processing unit’s resources each process is using at the given moment. Total percentage of total CPU utilization is shown in the column header and includes all processors and processor cores.
- Memory — is a continuously updated display of how much of your RAM is being used by each process at the given moment. Total memory usage is shown in the column header.
- Disk — a continuously updated display of how much read and write activity each process is responsible for, across all of your hard drives, at the given moment. The percentage of total disk utilization is shown in the column header.
- Network — a continually updated display of the bandwidth being utilized by each process. The percentage utilization of the primary network as a whole is shown in the column header.
- GPU — a continuously updated display of the GPU utilization across all engines at the given moment. The percentage of total GPU utilization is shown in the column header.
- GPU engine — which GPU engine each process is using.
- Power usage — a continually updated display of the CPU, disk, and GPU impact on power consumption. Value can toggle between Very low, Low, Moderate, High, and Very high.
- Power usage trend — CPU, disk, and GPU impact on power consumption over time.
The button at the bottom-right of this tab changes depending on what you have selected. On most processes, it becomes End task but a few have a Restart ability.
The Performance Tab (CPU)
CPU Performance Tab (Windows 11).
The Performance tab, available in all versions of Windows, gives you an overview of how your hardware is being utilized by Windows and whatever software you’re running right now.
This tab is further broken down by the individual hardware categories that are most important to your system’s performance — CPU, Memory, Disk, and GPU, plus either Wireless or Ethernet (or both). Additional hardware categories might also be included here too, like Bluetooth.
Let’s look at CPU first and then Memory, Disk, and Ethernet over the next several parts of this walkthrough:
Above the graph, you’ll see the make and model of your CPU(s), along with the maximum speed, also reported below.
The CPU % Utilization Graph operates as you’d probably expect, with time on the x-axis and total CPU utilization, from 0% to 100%, on the y-axis.
The data at the far right is right now, and moving left, you’re seeing an increasingly older look at how much of your CPU’s total capacity was being utilized by your computer. Remember, you can always change the rate at which this data is updated via Settings > Real time update speed (Windows 11) or View > Update Speed.
Right-click or tap-and-hold anywhere on the right to bring up some options for this graph:
- Change graph to — gives you the options of Overall utilization (one graph representing the total utilization across all physical and logical CPUs), Logical Processors (individual graphs, each representing a single CPU core), and NUMA nodes (each NUMA node in an individual graph).
- Show kernel times — adds a second layer to the CPU graph that isolates CPU utilization due to kernel processes—those executed by Windows itself. This data appears as a dotted-line so you don’t confuse it with the overall CPU utilization, which includes both user and kernel processes (i.e., everything).
- Graph summary view — hides all the data in Task Manager, including the menus and other tabs, leaving only the graph itself. This is particularly helpful when you need to keep an eye on CPU utilization without the distractions of all that other data.
- View — gives you a right-click method of jumping to the other Memory, Disk, Network, and GPU areas of the Performance tab.
- Copy — will copy all of the non-graph information on the page (more on all of that below) to the Windows clipboard, making it really easy to paste anywhere you like… like that chat window where you’re getting help from tech support.
There’s lots of other information on this screen, all located below the graph. The first set of numbers, which are displayed in a larger font and that you’ll no doubt see change from moment to moment, include:
- Utilization — shows the current Overall utilization of the CPU, which should match where the data line meets the graph’s y-axis, on the far right.
- Speed — shows the speed at which the CPU is operating at right now.
- Processes — a total count of all processes running at the moment.
- Threads — the total number of threads running in the processes at this time, including one idle thread per processor installed.
- Handles — the total number of object handles in the tables of all running processes.
- Up time — the total time the system has been running in DD:HH:MM:SS (e.g., 2:16:47:28 means 2 days, 16 hours, 47 minutes, and 28 seconds). This count resets to zero when the computer is restarted or powered on.
The remaining data you see is static data about your CPU(s):
- Base speed — the listed maximum speed for your CPU. You may see the actual speed go a bit higher and lower than this as you use your computer.
- Sockets — indicates the number of physically distinct CPUs you have installed.
- Cores — reports the total number of independent processing units available across all installed processors.
- Logical processors — the total number of non-physical processing units available across all installed processors.
- Virtualization — reports the current status, either Enabled or Disabled, of hardware-based virtualization.
- Hyper-V support — indicates whether or not Microsoft Hyper-V virtualization is supported by the installed CPU(s).
- L1 cache — reports the total amount of L1 cache is available in the CPU, a small but super-fast pool of memory the CPU can use exclusively for its own purposes.
- L2 cache, L3 cache, and L4 cache — are increasingly larger, and slower, stores of memory that the CPU can use when the L1 cache is full.
Finally, at the very bottom of every Performance tab you’ll see a shortcut to Resource Monitor, a more robust hardware monitoring tool included with Windows.
The Performance Tab (Memory)
Memory Performance Tab (Windows 11).
The next hardware category in the Performance tab in Task Manager is Memory, tracking and reporting on various aspects of your installed RAM.
Above the topmost graph, you’ll see the total amount of memory, likely in GB, installed and recognized by Windows.
Memory has two different graphs:
The Memory Usage Graph, similar to the CPU graph, operates with time on the x-axis and total RAM utilization, from 0 GB to your maximum usable memory in GB, on the y-axis.
The data at the far right is right now, and moving left you’re seeing an increasingly older look at how much of your RAM’s total capacity was being utilized by your computer.
The Memory Composition Graph is not time-based, but instead a multi-section graph, some parts of which you may not always see:
- In use — memory in use by «processes, drivers, or the operating system.»
- Modified — memory «whose contents must be written to disk before it can be used for another purpose.»
- Standby — memory in memory that contains «cached data and code that is not actively in use.»
- Free — memory that «is not currently in use, and that will be repurposed first when processes, drivers, or the operating system need more memory.»
Right-click or tap-and-hold anywhere on the right to bring up some options:
- Graph summary view — hides all the data in Task Manager, including the menus and other tabs, leaving only the two graphs themselves. This is particularly helpful when you need to keep an eye on memory usage without all that extra data in the way.
- View — gives you a right-click method of jumping to the other CPU, Disk, Network, and GPU areas of the Performance tab.
- Copy — will copy all of the non-graph memory use and other information on the page (more on all of that below) to the clipboard.
Below the graphs are two sets of information. The first, which you’ll notice is in a larger font, is live memory data which you’ll probably change every so often:
- In use — the total amount of RAM in use at this moment, which matches where the data line crosses the graph’s y-axis, on the far right of the memory usage graph.
- Available — the memory that’s available to be used by the operating system. Adding the Standby and Free amounts listed in the Memory Composition Graph will get you this number as well.
- Committed — has two parts, the first being the Commit Charge, a lower number than the second, the Commit Limit. These two amounts are related to virtual memory and the paging file; specifically, once the Commit Charge reaches the Commit Limit, Windows will attempt to increase the size of the pagefile.
- Cached — the memory being passively used by the operating system. Combining the Standby and Modified amounts listed in the Memory Composition Graph will get you this number.
- Paged pool — reports the amount of memory used by important operating system processes (kernel mode components) that can be moved to the pagefile if physical RAM starts to run out.
- Non-paged pool — reports the amount of memory used by kernel-mode components that must be kept in physical memory and can’t be moved to the virtual memory pagefile.
The remaining data, in smaller font and on the right, contains static data about your installed RAM:
- Speed — the speed of the installed RAM, usually in MHz.
- Slots used — reports the physical RAM module slots on the motherboard that are used and the total available. For example, if this is 2 of 4, it means that your computer supports 4 physical RAM slots but only 2 are currently being used.
- Form factor — reports the form factor of the installed memory, almost always DIMM.
- Hardware reserved — the amount of physical RAM reserved by hardware devices. For example, if your computer has integrated video hardware, without dedicated memory, several GB of RAM may be reserved for graphics processes.
The slots used, form factor, and speed data are particularly helpful when you’re looking to upgrade or replace your RAM, especially when you can’t find information about your computer online or a system information tool isn’t more helpful.
The Performance Tab (Disk)
Disk Performance Tab (Windows 11).
The next hardware device to be tracked in the Performance tab in Task Manager is Disk, reporting on various aspects of your hard drive and other attached storage devices like external drives.
Above the topmost graph, you’ll see the make model number of the device, if available. If you’re looking for a specific hard drive, you can check the other Disk x entries on the left.
Disk has two different graphs:
The Active Time Graph, similar to the CPU and main Memory graphs, this one operates with time on the x-axis. The y-axis shows, from 0 to 100%, the percentage of time that the disk was busy doing something.
The data at the far right is right now, and moving left you’re seeing an increasingly older look at the percentage of time this drive was active.
The Disk Transfer Rate Graph, also time-based on the x-axis, shows the disk write speed (dotted line) and disk read speed (solid line). The numbers on the top-right of the graph are showing peak rates over the time frame on the x-axis.
Right-click or tap-and-hold anywhere on the right to show some familiar options:
- Graph summary view — hides all the data in Task Manager, including the menus and other tabs, leaving only the two graphs themselves.
- View — gives you a right-click method of jumping to the other CPU, Memory, Network, and GPU areas of the Performance tab.
- Copy — will copy to the clipboard all of the non-graph disk use and other information on the page.
Below the graphs are two different sets of information. The first, shown in a larger font, is live disk usage data which you’ll certainly see change if you watch:
- Active time — shows the percentage of time, within the units of time on the x-axis, that the disk is busy reading or writing data.
- Average response time — reports the average total time it takes for the disk to complete an individual read/write activity.
- Read speed — the rate at which the drive is reading data from the disk, at this moment, reported in either MB/s or KB/s.
- Write speed — the rate at which the drive is writing data to the disk, at this moment, reported in either MB/s or KB/s.
The rest of the data about the disk is static and reported in TB, GB, or MB:
- Capacity — the total size of the physical disk.
- Formatted — the total of all formatted areas on the disk.
- System disk — indicates whether or not this disk contains the system partition.
- Page file — indicates whether or not this disk contains a pagefile.
- Type — indicates the disk type, such as SSD, HDD, or Removable.
Much more information about your physical disks, the drives they make up, their file systems, and lots more, can be found in Disk Management.
The Performance Tab (Ethernet)
Ethernet Performance Tab (Windows 11).
The final major hardware device to be tracked in the Performance tab in Task Manager is Ethernet, reporting on various aspects of your network, and ultimately internet, connection.
Above the graph, you’ll see the make and model of the network adapter you’re viewing the performance of. If this adapter is virtual, like a VPN connection, you’ll see the name provided for that connection, which may or may not look familiar to you.
The Throughput Graph has time on the x-axis, like most graphs in Task Manager, and the total network utilization, in Gbps, Mbps, or Kbps, on the y-axis.
The data at the far right is right now, and moving left you’re seeing an increasingly older look at how much network activity was taking place via this particular connection.
Right-click or tap-and-hold anywhere on the right to bring up some options for this graph:
- Graph summary view — hides all the data in Task Manager, including the menus and other tabs, leaving only the graph, a fantastic choice if you want to dock this window in the corner of your desktop to keep an eye on things.
- View — gives you a right-click method of jumping to the other CPU, Memory, Disk, and GPU areas of the Performance tab.
- View network details — will bring up the Network Details window, a data-only, fine-grained, down-to-the-byte view the different types of information passing in and out of each adapter on your system.
- Copy — will copy to the clipboard all of the non-graph network utilization data and other information on the page.
Below the graph is live send/receive data:
- Send — shows the current rate by which data is being sent via this adapter, in Gbps, Mbps, or Kbps, and reported on the graph as a dotted line.
- Receive — shows the current rate by which data is being received via this adapter, in Gbps, Mbps, or Kbps, and reported on the graph as a solid line.
…and next to that, some helpful static information on this adapter:
- Adapter name — the name, in Windows, given to this adapter.
- SSID — the wireless network name that you’re connected via this adapter.
- DNS name — the DNS server that you’re currently connected to. This is not the same thing as the DNS servers that your connection to the internet is using!
- Connection type — shows the general type of connection this is, like Ethernet, 802.11ac, Bluetooth PAN, etc.
- IPv4 address — lists the current IPv4 IP address tied to this adapter’s current connection.
- IPv6 address — lists the current IPv6 address tied to this adapter’s current connection.
- Signal strength — shows the current wireless signal strength.
The data you see in this «static» area varies greatly depending on the type of connection. For example, you’ll only see signal strength and SSID on non-Bluetooth wireless connections. The DNS name field is even more rare, usually only showing up on VPN connections.
The App History Tab
App History Tab (Windows 11).
The App History tab in Task Manager shows CPU and network hardware resource usage on a per-app basis. To also see data for non-Windows Store apps and programs, choose Show history for all processes from the Settings or Options menu.
This tab is only available in Task Manager in Windows 11, 10, and 8.
The date app-specific resource tracking started is shown at the top of the tab, after Resource usage since …. select Delete usage history to remove all the data recorded in this tab and immediately start the counts over at zero.
By default, the App History tab shows the Name column, as well as CPU time, Network, Metered network, and Tile updates. Right-click or tap-and-hold on any column heading, and you’ll see additional information you can choose to view for each app or process:
- Name — the program or process’s common name, or file description, if it’s available. If it’s not, the file name of the running process is shown instead. This column can not be removed.
- CPU time — the amount of time spent by the CPU executing instructions initiated by this app or process.
- Network — the total network activity (downloads + uploads), in MB, this process or app is responsible for.
- Metered network — reports, in MB, the total network activity by this app that occurred over a metered network connection.
- Notifications — reports, in MB, the total network usage of this app’s notifications.
- Tile updates — the total download and upload activity, in MB, used by this app’s tile updates and notifications.
- Non-metered network — reports, in MB, the total network activity by this app that occurred over a non-metered network connection
- Downloads — reports the total download activity, in MB, this process or app is responsible for.
- Uploads — reports the total upload activity, in MB, this process or app is responsible for.
Right-click or tap-and-hold on any row with a non-app process, and you’ll get two options:
- Search online — opens a search results page in your default browser, using the executable file and the common name as the search terms.
- Properties — opens the Properties of the processes’ executable. This is the same Properties window you’d see if you were to choose this option after right-clicking on the file anywhere else in Windows.
In some versions of Windows, you can right-click or tap-and-hold any app to Switch to that app. The switch to wording on the apps is a little disingenuous here because the app, even if running, won’t be switched to at all. Instead, a completely new instance of the app is started.
The Startup Apps Tab
Startup Apps Tab (Windows 11).
The Startup Apps tab (called just Startup before Windows 11) in Task Manager shows you all the processes that are configured to start automatically when Windows starts. Previously disabled startup processes are listed, too.
This is only available in Task Manager in Windows 11, Windows 10, and Windows 8.
In versions of Windows that have it, this Task Manager tab replaces, and expands upon, the data in the Startup tab found in the System Configuration (msconfig) tool.
Above the table is a Last BIOS time indication which is a measurement, in seconds, of the last system startup time. Technically, this is the time between BIOS handing booting off to Windows and when Windows has fully started (not including you signing on). Some computers may not see this.
Right-click or tap-and-hold on any listed process and you’ll be presented with several options, depending on the type of process:
- Expand/Collapse — just another way to expand or collapse grouped processes. This is no different from using the little arrows to the left of the process name.
- Disable/Enable — will disable a currently enabled, or enable a previously disabled, process from starting automatically with Windows.
- Open file location — opens the folder on your computer that contains the executable responsible for that process and selects it for you.
- Search online — opens up a search results page in your default browser, using the file and common names as search terms. This is a great way to investigate a startup item you’re not sure what to do with.
- Properties — opens the Properties of the processes’ executable. This is the same Properties option available from the file’s right-click menu in other parts of Windows.
By default, the Startup Apps tab shows the Name column, as well as Publisher, Status, and Startup impact. Right-click or tap-and-hold any column heading, and you’ll see additional information you can choose to view for each startup process:
- Name — the program or process’s common name, or file description, if it’s available. If it’s not, the file name of the running process is shown instead. You can’t remove this column from the table.
- Publisher — shows the running file’s author, extracted from the file’s copyright data. If the file doesn’t contain copyright data, then this field is left blank.
- Status — will note if a process is Enabled or Disabled as a startup item.
- Startup impact — the impact on CPU and disk activity that this process had the last time the computer started. Possible values include High, Medium, Low, or None, and is updated after each startup. You’ll see Not measured if Windows wasn’t able to determine the resource impact for some reason.
- Startup type — indicates the source of the instruction to start this process at startup. Registry is referring to the Windows Registry (at SOFTWARE\Microsoft\Windows\CurrentVersion\Run in HKEY_LOCAL_MACHINE or HKEY_CURRENT_USER) and Folder to the Startup folder in the Start Menu.
- Disk I/O at startup — the total read/write activity, measured in MB, that this process engaged in during the Windows startup process.
- CPU at startup — the total CPU time, measured in milliseconds, that this process used during the Windows startup process.
- Running now — indicates if the listed process is currently running.
- Disabled time — lists the day of the week, month, day, year, and local time that a disabled startup process was disabled.
- Command line — shows the full path and exact execution, including any options or variables, of this startup process.
In lieu of right-clicking or tap-and-holding a process to disable or enable it from starting up, you can choose to tap or click the Disable or Enable button, respectively, to do the same.
The Users Tab
Users Tab (Windows 11).
The Users tab in Task Manager is a lot like the Processes tab, but processes are instead grouped by signed-in user. At a minimum, it’s a convenient way to see which users are currently signed in to the computer and what hardware resources they’re using.
This is only available in Task Manager in Windows 11, Windows 10, and Windows 8.
To see real names in addition to account usernames, choose Show full account name from the Settings or Options menu.
Right-click or tap-and-hold on any user and you’ll be presented with several options:
- Expand/Collapse — just another way to collapse or expand the grouped processes running under that user. It works the same as the arrows to the left of the user.
- Disconnect — will disconnect the user from the system but will not sign that user off. Disconnecting usually only has value if the user you disconnect is using the computer remotely, at the same time you are.
- Manage user accounts — just a shortcut to User Accounts applet in Control Panel.
Right-click or tap-and-hold on any listed process under a user (expand the user if you don’t see these) and you’ll be presented with several options:
- Switch to — if available, brings this running program to the foreground.
- Restart — available for some Windows processes, like Windows Explorer, and will close and automatically restart the process.
- End task — unsurprisingly, ends the task.
- Resource values — the top level menu of a series of nested menus: Memory, Disk, and Network. Choose Percents to show resources as a percent of total resources. Choose Values (the default) to show the actual resource level being utilized.
- Provide feedback — launches Feedback Hub where you can send feedback to Microsoft with suggestions or problems you have with that app.
- Efficiency mode — turns on Efficiency mode for the selected process to lower process priority and improve power efficiency (but it might also cause instability).
- Create dump file — generates a «dump with heap» in DMP format. This often very large file contains everything involved with that process.
- Go to details — switches you to the Details tab and selects the executable responsible for that process.
- Open file location — opens the folder on your computer that contains the executable responsible for the particular process.
- Search online — automatically searches online for information about the process. The page that opens is in your default browser, but always uses Microsoft’s Bing search engine.
- Properties — opens the Properties data available for this processes’ executable.
By default, the Users tab shows the User column, as well as Status, CPU, Memory, Disk, Network, and, in some Windows versions, GPU. Right-click or tap-and-hold on any column heading, and you’ll see additional information you can choose to view for each user and running process:
- User — shows the user’s account name along with an updated number, in parentheses, indicating the number of processes running under that user at this moment. The expanded view of the User shows those running processes.
- ID — shows the number assigned to the session that the user became a part of when signing in. Certain types of software, as well as Windows itself, may be a part of a session so a sole user of a computer may not be assigned Session 0.
- Session — describes the type of session this user is using on the computer. When using your computer normally, you’ll see Console. If you’re connecting remotely, like via Remote Desktop, you’ll see RDP-Tcp#0 or something similar.
- Client name — displays the hostname of the client computer that the user is using to connect to this computer. You’ll only see this when there’s an active remote connection, like a Remote Desktop connection to your PC.
- Status — will note if a process is Suspended, but only if Task Manager is configured to report this, via View > Status values > Show suspended status.
- CPU — a continuously updated display of how much of your CPU’s resources each process, as well as each user as a whole, is using at the given moment. Total percentage of total CPU utilization is shown in the column header and includes all processors and processor cores.
- Memory — a continuously updated display of how much of your RAM is being used by each process and each user at the given moment. Total memory usage is shown in the column header.
- Disk — a continuously updated display of how much read and write activity each process, and user, is responsible for, across all of your hard drives, at the given moment. The percentage of total disk utilization is shown in the column header.
- Network — a continually updated display of the bandwidth being utilized by each process and each user. The percentage utilization of the primary network as a whole is shown in the column header.
- GPU — a continuously updated display of the GPU utilization across all engines at the given moment. The percentage of total GPU utilization is shown in the column header.
- GPU engine — which GPU engine each process is using.
The button at the bottom-right of this tab (not available in Windows 11) changes depending on what you have selected. On a user, it becomes Disconnect and on a process, it becomes End task or Restart, depending on the process selected.
The Details Tab
Details Tab (Windows 11).
The Details tab in Task Manager contains what can only be interpreted as the mother lode of data on each process running on your computer right now. It shows every individual process that’s running right now—no program grouping, common names, or other user-friendly displays here. This tab is very helpful during advanced troubleshooting, when you need to easily find something like an executable’s exact location, its PID, or some other piece of information you haven’t found elsewhere in Task Manager.
This tab is what the Processes tab was in Windows 7 and earlier, with a few extras.
Right-click or tap-and-hold on any listed process, and you’ll be presented with several options:
- End task — ends the process. Assuming the ending was successful, the process will disappear from the list in the tab.
- End process tree — ends the process, as well as any child processes that the process was responsible for starting.
- Provide feedback — starts Feedback Hub where you can send feedback to Microsoft with suggestions or problems you have with the selected process.
- Efficiency mode — enables Efficiency mode for the process to lower priority and improve power efficiency.
- Set priority — allows you to set the base priority of a process which, depending on what threads are seeking the same priority at the same time, may improve the process’ ability to utilize the CPU by giving it access to it before other processes. Options are Realtime, High, Above normal, Normal, Below Normal, and Low.
- Set affinity — allows you to choose which CPU cores the process is allowed to utilize. Options include or any combination of CPU cores available on your computer. At least one core must be chosen.
- Analyze wait chain — shows, in a new Analyze wait chain window, what other processes the process in question is using… or waiting to use. If one of those processes this one is waiting on is frozen/hung, it will be highlighted in red. You can then end that process, via the End process button, and potentially prevent any data loss that may have occurred by ending the original process.
- UAC virtualization — toggles UAC virtualization on or off for the process, assuming it’s allowed for it.
- Create dump file — generates a «dump with heap»—a file, DMP format, that contains everything going on with that process.
- Open file location — opens the folder on your computer that contains the executable responsible for that process.
- Search online — opens up a search results page in your default browser, using the executable file and the common name as search terms.
- Properties — opens the Properties of the processes’ executable. This is the same Properties window you’d see if you opened Properties from the file directly.
- Go to service(s) — switches you to the Services tab and preselects the service(s) associated with the process. If no service is associated, then no preselection takes place, but you’ll still be switched to that tab.
By default, the Details tab shows the Name column, as well as PID, Status, User name, CPU, Memory (active private working set), Architecture, and Description. Right-click or tap-and-hold any column heading and choose Select columns. From this list are a number of additional columns of information you can choose to view for each running process:
- Name — the actual file name of the running process, including the file extension. This is exactly how the file appears if you were to navigate to it in Windows.
- Package name — another descriptive field available for apps. These processes are typically located in the \Windows\SystemApps or \Program Files\WindowsApps folders.
- PID — shows the process’s process id, a unique identifying number assigned to each running process.
- Status — will note if a process is currently Running or Suspended.
- User name — shows the account name of the user that started the process, even if it was automatic. Aside from signed-in users (like you), you’ll also see LOCAL SERVICE, NETWORK SERVICE, SYSTEM, and possibly a few others.
- Session ID — shows the number assigned to the session that the process was started in. Windows itself may be a part of a session, probably 0, and then other users, like you, will be part of different sessions, likely 1 or 2.
- Job Object ID — shows the «job object in which the process is running.»
- CPU — live display of how much of your central processing unit’s resources the process is currently using and includes all processors and cores.
- CPU time — the total processor time, in HH:MM:SS format, that the process has utilized since it started.
- Cycle — reports the current percent of CPU cycle time consumption by the process, which includes all processors and cores. Usually, the System Idle Process will be utilizing most of the cycle time.
- Working set (memory) — a live display of how much of your computer’s physical memory is in use by the process at this time. This is a combination of the memory reported in the private and shared working set.
- Peak working set (memory) — the maximum amount of physical memory this process used at one time since the process started. Think of this as the «record high memory use» for this process.
- Working set delta (memory) — the change in the process’ physical memory usage between each test. In other words, it shows the change in the Working set (memory) value each time that value is tested.
- Memory (active working set) — the physical memory in use by the process.
- Memory (private working set) — the physical memory in use by the process that no other process is able to use.
- Memory (shared working set) — the physical memory in use by the process that is available for sharing with other processes.
- Commit size — the «amount of virtual memory reserved by the operating system for the process.»
- Paged pool — the «amount of pageable kernel memory allocated by the kernel or drivers on behalf of the process.»
- NP pool — the «amount of non-pageable kernel memory allocated by the kernel or drivers on behalf of the process.»
- Page faults — the «number of page faults generated by the process since it was started.» A page fault occurs when the process accesses memory that’s not part of its working set. Here’s how to fix a page fault error.
- PF Delta — the «change in the number of page faults since the last update.»
- Base priority — the «ranking that determines the order in which threads of a process are scheduled.» Possible values include Realtime, High, Above normal, Normal, Below Normal, Low, and N/A. Base priority for a process can be set via Set priority, available when right-clicking or tap-and-holding on the process.
- Handles — reports the «current number of handles open by the process.»
- Threads — reports the number of active threads the process is running right now.
- User objects — the «number of window manager objects (windows, menus, cursors, keyboard layouts, monitors, etc.) used by the process.»
- GDI objects — the «number of GDI (Graphics Device Interface) objects used by the process.»
- I/O reads — the count of «read I/O operations generated by the process since it was started.» This includes file, device, and network I/Os.
- I/O writes — the count of «write I/O operations generated by the process since it was started.» This includes file, device, and network I/Os.
- I/O other — the count of «non-read/non-write I/O operations generated by the process since it was started.» Control functions are a common other example.
- I/O read bytes — reports the actual amount of I/O reads, in bytes, that this process is responsible for generating since it started.
- I/O write bytes — reports the actual amount of I/O writes, in bytes, that this process is responsible for generating since it started.
- I/O other bytes — reports the actual amount of I/O operations (other than reads and writes), in bytes, that this process is responsible for generating since it started.
- Image path name — reports the full location, including the drive, folders, and file name with extension, where this process can be found on the hard drive.
- Command line — shows the full image path name, plus any options or variables used to execute the process.
- Operating system context — reports the «operating system context in which the process is running.» If you see an older version of Windows in this field, it does not indicate that you’re running an outdated process. It’s simply reporting the level of compatibility, and only if provided by the manifest in the process executable.
- Platform — reports if the process is running as 64-bit or 32-bit. This notation can also be seen, in parentheses, after the process’ name back on the Processes tab.
- Architecture — reports the same information as Platform, but expressed as x86 or x64 for 32-bit or 64-bit, respectively.
- Elevated — indicates whether the process is running «elevated» (i.e. as an administrator) or not. This is the same «elevated» as in running a command via an elevated Command Prompt.
- UAC virtualization — «specifies whether User Account Control (UAC) virtualization is enabled, disabled, or not allowed in the process.»
- Description — the process’s common name, or file description, if available. If it’s not, the file name of the running process is shown instead.
- Data Execution Prevention — «specifies whether Data Execution Prevention (DEP) is enabled or disabled for the process.»
- Hardware-enforced Stack Protection — specifies the status (enabled or disabled) of Hardware-enforced Stack Protection (a security feature using shadow stacks) for the process.
- Extended Control Flow Guard — specifies the status (enabled or disabled) of Extended Control Flow Guard (XFG, a security feature) for the process.
With all selected processes, the button on the top-right (in Windows 11) or bottom-right will End task — the same as the End task right-click/tap-and-hold option.
The Services Tab
Services Tab (Windows 11).
The Services tab in Task Manager is a stripped-down version of Services, the tool in Windows that’s used to manage Windows services. Most services will be Running or Stopped. This tab serves as a quick and convenient way to start and stop major Windows services.
This tab is available in Task Manager in Windows 11, 10, 8, 7, and Vista. The full Services tool can be found in Windows/Administrative Tools, via Control Panel. It can also be launched by the Open Services link here in Task Manager.
Right-click or tap-and-hold on any listed service, and you’ll be presented with a few options:
- Start — will start a currently stopped service.
- Stop — will stop a currently running service.
- Restart — will restart a currently running service (i.e., stop it and then automatically start it again).
- Open Services — no matter which service you choose this option from, opens the Services tool. It does not preselect the service in Services.
- Search online — opens up a search results page in your default browser, using the service name and description as the search terms.
- Go to details — switches you to the Details tab and auto-selects the executable responsible for that service. This option is only available if the service is running.
Unlike with other tabs in Task Manager, the columns in the Services tab are preset and can not be changed:
- Name — the name of the service and comes from the Service name field in the Services tool.
- PID — shows the unique process id for the service’s associated process.
- Description — the listed description for the service and comes from the Display name field in the Services tool.
- Status — will note if a process is currently Running or Stopped.
- Group — displays the group the service is a part of, if it is part of one.
While they can’t be changed, the columns in the Services tab can be rearranged. Just click or hold and drag around as you like.
Диспетчер задач
Диспетчер задач (Windows Task Manager) — это небольшая системная программа, которая показывает процессы компьютера, а также позволяет ими управлять. Через нее можно посмотреть, какие приложения сейчас запущены, следить за быстродействием компьютера, подключением к сети и за другими важными вещами.
Чаще всего Диспетчер задач используется для того, чтобы выключить зависшую программу. Но еще он нужен для диагностики компьютера.
Как открыть
Классический способ запуска Диспетчера задач – через комбинацию клавиш Ctrl + Alt + Delete
Сначала нажимаем на клавишу клавиатуры Ctrl, не отпуская ее, Alt, и, не отпуская эти две кнопки, нажимаем на Delete.

Экран компьютера станет примерно таким:

Выбираем пункт «Диспетчер задач», после чего экран возвращается в прежний вид и появляется окно программы.

Другие способы запуска
Ctrl + Shift + Esc. Более современный вариант запуска. Через эту комбинацию клавиш программа открывается сразу же, миную показ «голубого экрана». Работает только в современных версиях системы Windows — 7, 8 и 10.
Через панель задач. Щелкаем правой кнопкой мыши на любом свободном месте Панели задач и выбираем пункт «Запустить Диспетчер задач».

Через команду «Выполнить». Нажимаем комбинацию клавиш Win + R.

В открывшемся окне печатаем taskmgr и жмем кнопку OK.

Запуск программы с помощью поиска. Открываем меню Пуск и в поле поиска печатаем Диспетчер задач. В результатах выбираем пункт «Просмотр запущенных процессов в Диспетчере задач».

Как отключить зависшую программу
Самое популярное применение Диспетчера задач — выключение зависших приложений. Собственно, это его наиважнейшая функция — отрубать те программы, которые не получается закрыть обычным способом.
А также он спасает, когда из-за проблем с одной программой виснет вся система. То есть компьютер не реагирует ни на какие действия (бывает, даже курсор мыши не двигается).
Решается эта проблема так:
- Запускаем Диспетчер задач.
- Щелкаем по нужной программе во вкладке «Приложения» один раз левой кнопкой мышки (чтобы выделить ее) и нажимаем на кнопку «Снять задачу» внизу.
В графе «Состояние» показывается статус каждого запущенного приложения. У проблемной программы он обычно указан как «Не отвечает».

На заметку. Если после этого программа по-прежнему «висит», щелкните по ней правой кнопкой мыши и в списке выберите «Перейти к процессу». Откроется вкладка «Процессы», где уже будет выделен тот, что нужно выключить. Для этого нажмите на кнопку «Завершить процесс» (внизу).
Для чего еще нужен Диспетчер задач
Еще здесь можно найти данные об объеме занятой оперативной памяти, нагрузке на центральный процессор и общем количестве запущенных процессов. Эта информация всегда показывается внизу, независимо от открытой вкладки.

Но самую ценную информацию можно получить из вкладок программы (вверху). Там же можно управлять некоторыми процессами компьютера.

Процессы. Здесь показывается детальная информация обо всех процессах, которые сейчас запущены — то, как они нагружают процессор и занимают оперативную память. Их можно сортировать: по убыванию, возрастанию, в алфавитном порядке. Для этого просто нажать на нужный столбец.
Таким образом, например, можно узнать, какой процесс использует больше всего памяти.

В отличие от вкладки «Приложения», здесь мы можем управлять и теми, которые не видны на Панели задач — работают в фоновом режиме или находятся в системном трее.
С каждым из них можно проделать различные манипуляции: открыть папку, в которой хранится этот файл, установить для него приоритет, завершить процесс и др. Для этого нужно щелкнуть по нему правой кнопкой мышки.

Если нужно получить больше данных, нажмите кнопку «Вид» вверху, выберите пункт «Выбрать столбцы», птичками отметьте то, что нужно отображать, и нажмите ОК.
Также именно здесь (среди процессов) можно обнаружить работу вирусов и вредоносных программ. Но закрывать их особого смысла нет, так как после перезагрузки компьютера они запустятся снова. Избавляться от них нужно по-другому — при помощи хорошего антивируса.
На заметку. В попытках ускорить работу компьютера некоторые пользователи начинают завершать разные неизвестные им процессы. Делать этого не рекомендуется, так как можно случайно закрыть что-то важное и компьютер начнет работать неправильно или вообще зависнет. Страшного в этом ничего нет – после перезагрузки все они запустятся снова. Но все же лучше не рисковать, ведь можно потерять несохраненную информацию.
Службы. В этой вкладке показаны приложения, которые запускаются операционной системой (как правило, в автоматическом режиме) и выполняются вне зависимости от статуса пользователя.
Через правую кнопку мыши эти службы можно редактировать. Но лучше этого не делать, так как все они нужны для корректной работы компьютера.

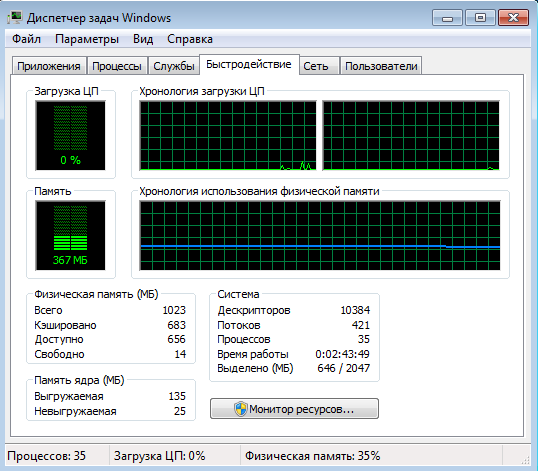
Быстродействие. Полная информация о загруженности процессора и объеме занятой оперативной памяти.

При желании можно получить еще более подробную информацию, нажав на кнопку «Монитор ресурсов» внизу.
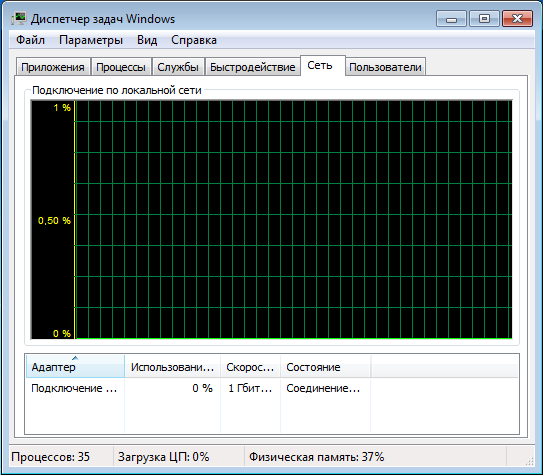
Сеть. Информация о сетевых подключениях. Используется крайне редко в случае неполадок с интернет-соединением.

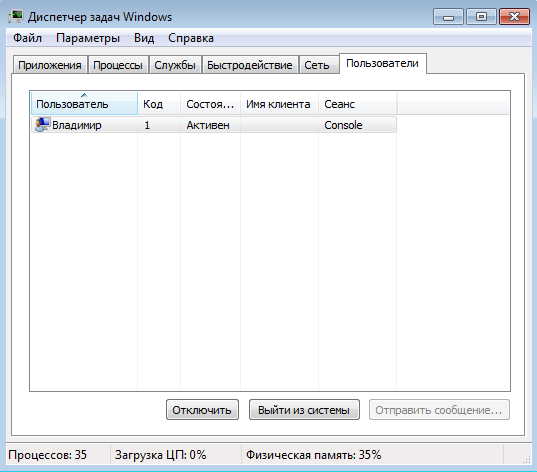
Пользователи. Предоставляет информацию о пользователях системы. А также здесь можно отключать отдельных пользователей, отправлять им сообщения и завершать сеансы.

Эта вкладка может пригодиться только в том случае, если к вашему компьютеру кто-то подключается удаленно.
Если Диспетчер задач не запускается
Бывает и так, что вызвать приложение никак не получается. Либо программа просто не открывается, либо появляется сообщение «Диспетчер задач отключен администратором».
Проблема решается небольшой правкой системы:
1. Сначала нужно зайти в реестр Windows. Для этого нажимаем комбинацию клавиш клавиатуры Win + R, в окошке печатаем regedit и нажимаем на кнопку ОК.

2. Далее, идем по пути HKEY_CURRENT_USER\Software\Microsoft\Windows\Current Version\Policies\System.

Если такого раздела нет, щелкаем по папке Policies и внутри создаем раздел с названием System. Заходим в него, щелкаем правой кнопкой мыши внутри окна (в правой части) и создаем параметр DWORD. Называем его DisableTaskMgr
3. В правой части окна щелкаем два раза левой кнопкой мыши по файлу (ключу реестра) DisableTaskMgr и в окошке, в поле «Значение», указываем 0 и нажимаем OK.

4. Закрываем редактор реестра и пробуем открыть Диспетчер задач. Если он по-прежнему не запускается, перезагружаем компьютер.
 Диспетчер задач в Windows — один из самых важных инструментов операционной системы. С помощью него Вы можете увидеть, из-за чего тормозит компьютер, какая программа «съедает» всю память, процессорное время, постоянно что-то записывает на жесткий диск или же обращается к сети.
В Windows 10 и 8 был представлен новый и гораздо более продвинутый диспетчер задач, тем не менее, диспетчер задач Windows 7 также является серьезным инструментов, использовать который должен уметь каждый пользователь Windows. Некоторые из типичных задач стало значительно проще выполнять в Windows 10 и 8. См. также: что делать, если диспетчер задач отключен администратором системы
Как вызвать диспетчер задач
Вызвать диспетчер задач Windows можно различными способами, вот три наиболее удобных и быстрых:
- Нажмите Ctrl + Shift + Esc где угодно, находясь в Windows
- Нажмите Ctrl + Alt + Del
- Кликните правой кнопкой мыши по панели задач Windows и выберите пункт «Запустить диспетчер задач».

Вызов диспетчера задач из панели задач Windows
Надеюсь, этих способов будет достаточно.
Есть и другие, например, можно создать ярлык на рабочем столе или вызвать диспетчер через «Выполнить». Подробнее на эту тему: 8 способов открыть диспетчер задач Windows 10 (подойдет и для предыдущих ОС). Перейдем к тому, что именно можно делать с помощью диспетчера задач.
Просмотр загрузки процессора и использования памяти RAM
В Windows 7 диспетчер задач по умолчанию открывается на вкладке «Приложения», на которой можно увидеть список программ, быстро закрыть из них с помощью команды «Снять задачу», которая работает даже в случае если приложение зависло.
Эта вкладка не позволяет видеть использование ресурсов программой. Более того, на данной вкладке отображаются не все программы, запущенные на вашем компьютере — то программное обеспечение, которое работает в фоновом режиме и не имеет окон, здесь не отображается.

Диспетчер задач Windows 7
Если Вы перейдете на вкладку «Процессы», можно будет увидеть список всех запущенных на компьютере программ (для текущего пользователя), включая фоновые процессоры, которые могут быть невидимы или находиться в системном трее Windows. Кроме этого, на вкладке процессы отображается процессорное время и используемая запущенной программой оперативная память компьютера, что в некоторых случаях позволяет сделать полезные выводы о том, что именно тормозит систему.
Чтобы увидеть список процессов, запущенных на компьютере, нажмите кнопку «Показать процессы всех пользователей».

Диспетчер задач Windows 8 процессы
В Windows 8 главной вкладкой диспетчера задач является «Процессы», на которой отображается вся информация об использовании программами и содержащимися в них процессами ресурсов компьютера.
Как убить процессы в Windows

Убить процесс в диспетчере задач Windows
Убить процессы — означает прекратить их выполнение и выгрузить из памяти Windows. Чаще всего возникает необходимость убить фоновый процесс: например, вы вышли из игры, но компьютер тормозит и вы видите, что файл игра.exe продолжает висеть в диспетчере задач Windows и кушать ресурсы или какая-то программа грузит процессор на 99%. В этом случае, вы можете кликнуть правой кнопкой мыши по этому процессу и выбрать пункт контекстного меню «Снять задачу».
Проверка использования ресурсов компьютера

Производительность в диспетчере задач Windows
Если в диспетчере задач Windows Вы откроете вкладку «Производительность», то вы сможете увидеть общую статистику использования ресурсов компьютера и отдельные графики для оперативной памяти, процессора и каждого ядра процессора. В Windows 8 на этой же вкладке будет отображаться и статистика использования сети, в Windows 7 эта информация доступна на вкладке «Сеть». В Windows 10 на вкладке производительность стала доступна также информация о нагрузке на видеокарту.
Просмотр использования доступа к сети каждым процессом по отдельности
Если у Вас тормозит Интернет, но непонятно, какая именно программа что-то качает, вы можете узнать это, для чего в диспетчере задач на вкладке «Производительность» нажмите кнопку «Открыть монитор ресурсов».

Монитор ресурсов Windows
В мониторе ресурсов на вкладке «Сеть» есть вся необходимая информация — можно увидеть, какие программы пользуются доступом в Интернет и используют ваш трафик. Стоит отметить, что в списке будут и приложения, которые не используют доступ в сеть Интернет, но задействуют сетевые возможности для коммуникации с устройствами компьютера.
Аналогичным образом в мониторе ресурсов Windows 7 Вы можете отследить использование жесткого диска, оперативной памяти и других ресурсов компьютера. В Windows 10 и 8 большую часть этой информации можно увидеть, находясь на вкладку «Процессы» диспетчера задач.
Управление, включение и выключение автозагрузки в диспетчере задач
В Windows 10 и 8 диспетчер задач обзавелся новой вкладкой «Автозагрузка», на которой Вы можете увидеть список всех программ, запускающихся автоматически при старте Windows и использование ими ресурсов. Здесь же вы можете убрать ненужные программы из автозагрузки (однако, здесь отображаются не все программы. Подробнее: Автозагрузка программ Windows 10).

Программы в автозагрузке в Диспетчере задач
В Windows 7 для этого вы можете воспользоваться вкладкой Автозагрузка в msconfig, либо воспользоваться сторонними утилитами для очистки автозагрузки, например CCleaner.
На этом завершу свой краткий экскурс в Диспетчер задач Windows для начинающих, надеюсь, он Вам был полезен, раз уж Вы дочитали досюда. Если вы поделитесь этой статьей с другими — будет просто замечательно.